Gene prediction in novel fungal genomes using an ab initio algorithm with unsupervised training
- 1 School of Biology, Georgia Institute of Technology, Atlanta, Georgia 30332, USA;
- 2 Wallace H. Coulter Department of Biomedical Engineering, Georgia Institute of Technology and Emory University, Atlanta, Georgia 30332, USA;
- 3 Computational Science and Engineering Division, College of Computing, Georgia Institute of Technology, Atlanta, Georgia 30332, USA
-
↵4 These authors contributed equally to this work.
Abstract
We describe a new ab initio algorithm, GeneMark-ES version 2, that identifies protein-coding genes in fungal genomes. The algorithm does not require a predetermined training set to estimate parameters of the underlying hidden Markov model (HMM). Instead, the anonymous genomic sequence in question is used as an input for iterative unsupervised training. The algorithm extends our previously developed method tested on genomes of Arabidopsis thaliana, Caenorhabditis elegans, and Drosophila melanogaster. To better reflect features of fungal gene organization, we enhanced the intron submodel to accommodate sequences with and without branch point sites. This design enables the algorithm to work equally well for species with the kinds of variations in splicing mechanisms seen in the fungal phyla Ascomycota, Basidiomycota, and Zygomycota. Upon self-training, the intron submodel switches on in several steps to reach its full complexity. We demonstrate that the algorithm accuracy, both at the exon and the whole gene level, is favorably compared to the accuracy of gene finders that employ supervised training. Application of the new method to known fungal genomes indicates substantial improvement over existing annotations. By eliminating the effort necessary to build comprehensive training sets, the new algorithm can streamline and accelerate the process of annotation in a large number of fungal genome sequencing projects.
Reliable ab initio gene prediction in eukaryotic genomic sequences remains an open problem in spite of impressive progress made in developing gene prediction algorithms (Burge and Karlin 1997; Krogh 1997; Parra et al. 2000; Reese et al. 2000; Stanke and Waack 2003; Guigo et al. 2006). Much attention has been given to developing alternative, extrinsic methods that use EST/cDNA to genome mapping, spliced alignments of known protein sequences, or patterns of conservation between related genomes (Gelfand et al. 1996; Mott 1997; Mathe et al. 2002; Birney et al. 2004; Stanke et al. 2008). The extrinsic methods exhibit, as a rule, high specificity (Sp), while ab initio, intrinsic methods show high sensitivity (Sn). These properties make methods of both types indispensable in genome annotation pipelines. For accurate statistical description of protein-coding regions, efficient ab initio algorithms employ the fifth-order three periodic Markov chain models incorporated into hidden Markov models (HMMs) (Kulp et al. 1996; Burge and Karlin 1997) The number of algorithm parameters, several thousands, is high; thus, a training set of ∼1000 experimentally validated genes is necessary for parameter estimation. Compilation of such large training sets represents a bottleneck in genome annotation pipelines and a practical challenge that hampers the use of ab initio gene prediction algorithms.
To circumvent this difficulty, we developed a gene finder able to extract model parameters from the original genomic sequence (Lomsadze et al. 2005). We demonstrated that unsupervised model training, well known in prokaryotic gene finding (Audic and Claverie 1998; Hayes and Borodovsky 1998; Salzberg et al. 1998; Besemer et al. 2001; Larsen and Krogh 2003; Delcher et al. 2007), is also feasible for eukaryotes. Particularly, for genomes of Arabidopsis thaliana, Drosophia melanogaster, and Caenorhabditis elegans, the accuracy of the gene finder with unsupervised parameter estimation matched the accuracy of a conventional supervised gene finder. Nevertheless, variability in eukaryotic gene organization is by far greater than that has been observed in prokaryotes; thus, automatic algorithms specialized for genomes that share some important features may provide higher accuracy. Along this line, we have explored the opportunity to better analyze genomes where a significant part of the information for intron splicing is carried by a branch point (BP) site. Many fungal genomes fall into this category. Fungal genomes are relatively densely populated with genes (with protein-coding regions occupying from 27.8% of genome in Neurospora crassa to 52.6% in Botritus cineria), and these genes exhibit significant variation in exon-intron structure (Fig. 1).

Annotations of the 16 fungal genomes demonstrate significant variability in gene organization: both in the average size of exons and introns as well as in the number of introns per gene (1, Schizosaccharomyces pombe; 2, Aspergillus niger; 3, Botrytis cinerea; 4, Stagonospora nodorum; 5, Fusarium oxysporum; 6, Magnaporthe grisea; 7, Neurospora crassa; 8, Fusarium graminearum; 9, Fusarium verticillioides; 10, Sclerotinia sclerotiorum; 11, Aspergillus terreus; 12, Aspergillus nidulans; 13, Coccidioides immitis; 14, Rhizopus oryzae; 15, Coprinus cinereus (also known as Coprinopsis cinerea); 16, Cryptococcus neoformans).
The BP site models with parameters estimated by supervised training were used earlier in several gene finding algorithms (Lukashin et al. 1992; Hebsgaard et al. 1996; Burge and Karlin 1997; Stanke and Waack 2003). Structures of the BP models used varied from a positional frequency matrix in NetGene2 (Hebsgaard et al. 1996), IntronScan (Lim and Burge 2001), and GipsyGene (Neverov et al. 2003) to the second-order windowed weight array matrix (WWAM) generating a 21-nt-long sequence in GenScan (Burge and Karlin 1997), to the third-order WWAM generating a 32-nt-long sequence in AUGUSTUS (Stanke and Waack 2003). Derivation of a positional frequency matrix proceeded simultaneously with the putative BP sites alignment constructed by simulated annealing (Lukashin et al. 1992), an HMM-based EM algorithm (Hebsgaard et al. 1996), or a Markov chain Monte Carlo (MCMC) method (Thompson et al. 2003).
A fundamental question, “how much information is required by the recognition mechanism that controls splicing of short introns to accurately identify the locations of introns in primary transcript sequences and how this information is distributed?”, was addressed by computational modeling (Lim and Burge 2001). The analysis of five diverse species demonstrated that in D. melanogaster, A. thaliana, C. elegans, and Homo sapiens, the BP site contributes less than 5% of information necessary for accurate intron splicing; however, in yeast (Saccharromyces cerevisiae), a species with just ∼200 spliced genes, the BP site contributes ∼40% of information. More recently, a study of five genomes from phyla Ascomycota and Basidiomicota has also shown a presence of strongly conserved BP sites in fungal species with genes interrupted by introns much more frequently than genes in yeast genomes (Kupfer et al. 2004).
Existing evidence of a significant role of the fungal BP sites suggests that the HMM model underlying an ab initio algorithm should account for introns possessing conserved BP sites. To address this issue, we introduced an enhanced intron submodel that accommodates intron sequences with and without BP sites. In the context of this project, estimation of parameters of this submodel has to be done by unsupervised training. To solve the training task, we combined two unsupervised training approaches: the Viterbi training (Durbin et al. 1998) and the MCMC method (Thompson et al. 2003). The MCMC algorithm is run in full at each iteration of the Viterbi training procedure to generate an update of parameters of the new intron submodel. Since an HMM fit to data is largely determined by the values of emission probabilities (Mitrophanov et al. 2005), the emission probabilities are updated in each iteration while the probabilities of transition between hidden states are updated once in a few iterations.
To test the algorithm, we selected 16 genomes from the three fungal phyla (Supplemental Fig. S1) and compiled sets of sequences containing EST validated genes. We demonstrated that the self-training algorithm with the enhanced intron submodel predicts fungal genes with higher accuracy than either the original self-training algorithm or algorithms with supervised training. Application of the new algorithm indicated that a few of the 16 selected genomes are likely to be overannotated while several are underannotated. A number of fungal genome sequencing projects (more than 300 projects have been registered at www.genomesonline.org) may benefit from the new method higher accuracy, as well as from the convenience of an immediate transition from sequencing to the gene prediction and annotation stage without taking time on the tedious extraction of a training set of manually curated genes.
Methods
Sequence data
Genomic and EST sequences of 16 fungal genomes (Table 1; Supplemental Tables S1, S2) are from GenBank (www.ncbi.nlm.nih.gov/Genbank) and the Broad Institute (www.broad.mit.edu). The fungal genomes selected for this study varied in size from 20 Mb (Cryptococcus neoformans) to 60 Mb (Fusarium oxysporum) and in GC content from 36% (Rhizopus oryzae) to 52% (Aspergillus terreus). These genomes (as annotated) show a significant variation in gene number and organization of exon-intron structure: from 5055 genes in Schizosaccharomyces pombe to 17,735 genes in F. oxyporum; an average number of introns per annotated gene varied from 0.9 (S. pombe) to 4.9 (C. neoformans) (Table 1).
Characteristics of the 16 fungal genomes and of the complements of predicted and annotated genes
Iterative unsupervised estimation of model parameters used in the original algorithm
A conventional ab initio gene prediction algorithm with assigned HMM parameters produces a sequence parse into protein-coding and noncoding regions (Burge and Karlin 1997). Conversely, in an iterative self-training algorithm, a given sequence parse is used for HMM parameters re-estimation (Lomsadze et al. 2005). To obtain an initial sequence parse, our original self-training algorithm uses (1) three-periodic Markov chain models with parameters inferred from codon frequencies determined as functions of genome GC content (Besemer and Borodovsky 1999), (2) zero-order model of noncoding region initialized with genome-specific nucleotide frequencies, and (3) minimal size (2 nucleotide [nt]) models of canonic splice sites. Understandably, sequence parses made at the start of the process are treated with caution. Only those exon-intron structures that produce open reading frames (ORFs) with sufficient length and coding potential are selected into an update of a training set (Lomsadze et al. 2005). Further consecutive steps (rounds) of sequence parsing, selection of a training set and parameter re-estimation continue, as supposed by the logic of the Viterbi training (Durbin et al. 1998), with sequence parse k producing the kth version of the parameter set. In contrast with the conventional Viterbi training, the HMM architecture is allowed to change in iterations; e.g., the model of acceptor site grows from its initial simplistic form of just two canonical letters AG to the first-order Markov model generating 21-nt-long sequence fragments. The iterative process comes to conversion at a point where the predicted sequence parse k + 1 is not distinguishable from the previous parse k. Typically, conversion of the original algorithm was observed by the sixth iteration.
Introduction of the enhanced intron submodel
The new intron submodel provides two alternative paths of hidden states for an intron sequence (Fig. 2). The bottom path, the one that existed in the original algorithm, consists of “intron” and “long acceptor” states. The new top path has four hidden states: “upstream spacer,” “BP site,” “downstream spacer,” and “short acceptor.” The “upstream spacer” generates a nucleotide sequence situated between the donor site and the BP site; nucleotide composition of this sequence and the sequence generated by the “intron” state in the bottom path are the same. This setting is justified by earlier reports (Kupfer et al. 2004), as well as by our observations. The “downstream spacer” generates a sequence between the BP site and the acceptor site modeled by the first-order homogeneous Markov model. Nucleotide composition of downstream spacers is reduced in guanine and shows strong asymmetry between frequencies of adenine and thymine, with preference for thymine. The length distribution of the downstream spacer sequences has a skewed bell shape (Supplemental Fig. S2) with a clear lower bound that is apparently maintained by negative selection. The “short acceptor” state that models just 2 nt upstream of AG (compared with 18 nt modeled by the “long acceptor”) is appropriate for fungal genomes whose introns do not possess a poly-pyrimidine (poly-Y) tail upstream of the acceptor site while having a strongly conserved BP site. However, introns in some fungal genomes do have the poly-Y tail (see below). The probability of transition from a donor state to a BP-holding intron (top path), P(bp), is genome specific. Another genome-specific transition probability in the intron submodel is the probability of transition, P(ie), to internal exon (Fig. 2).

The hidden state diagram for the enhanced intron submodel (direct strand).
Changes in the procedure of parameter estimation
The iterative self-training procedure follows the path of the original algorithm up to the fourth iteration (Lomsadze et al. 2005). During the initial iterations, the probability value P(bp) in the intron submodel (Fig. 2) was set to zero. Parameterization of the new intron submodel begins with assignment of a nonzero P(bp) value, 0.5, at the fifth iteration. Unsupervised estimation of the parameters of the top path of the enhanced intron submodel focuses on derivation of parameters of the BP model. A model of the BP site per se is a positional Markov model. An alignment of true BP sites, should they be known, provides positional frequency statistics of nucleotides or dinucleotides for the BP model parameter estimation. We use the MCMC method, the Gibbs sampler algorithm (Lawrence et al. 1993; Thompson et al. 2003), to construct a multiple alignment of intron sequences scored within the “target windows” that are used to reveal evolutionarily conserved BP sites (the details are given in the next section). A “target window” positioned in a given intron creates a parse delineating two more intron sections, the BP upstream and the BP downstream sequences. The set of upstream (downstream) sequences is used to define parameters of the compositional model and the length distribution of the upstream (downstream) spacer. Graphic illustration of several components of the intron model computed for Stagonospora nodorum is given in Figure 3. After completion of the fifth iteration, the value of P(bp) is changed from 0.5 to a ratio of the number of introns predicted (emitted) via the hidden states of the “top path” to the total number of introns (Supplemental Table S3). Notably, the value of this ratio correlates with the ratio of introns with weak BP sites, as identified by the Gibbs sampler alignment algorithm, to the total number of introns in the Gibbs sampler alignment (data not shown).

The logos of splice sites and branch point models as well as the graph of the length distribution of the spacer between branch point and acceptor site (as determined for the S. nodorum genome).
The value of the probability of a transition from an intron to an exon state, P(ie), relates to the average number of exons per gene. It is assumed that empirical distribution of the number of exons per gene follows the shape of geometric distribution (Supplemental Fig. S3). Therefore, the value of P(ie) is estimated by fitting a geometric distribution to the distribution of number of exons per gene that emerged as a result of gene prediction. In the computations for a given genome, we initially set P(ie) to 0.5 and do not change this value through the iterations until convergence. Then the corrected value, P(ie)*, is estimated from the updated distribution of number of exons per gene as predicted. Subsequently, the training procedure is repeated until convergence with the new fixed value P(ie)* and P(ie) is re-estimated. If the updated estimate, P(ie)**, is close to P(ie)*, which is usually a case, we accept P(ie)* as a final value of P(ie).
Interestingly, the noticeable differences between the shapes of empirical distributions of a number of exons per gene (Supplemental Fig. S3) and their theoretically expected shapes (the straight lines) call for a revision of the HMM architecture used in the algorithm, a subject of a separate study.
Estimation of parameters of the new intron submodel
In running the Gibbs sampler, we did not attempt to streamline the sampling process by fixing the BP nucleotide “A” (Hebsgaard et al. 1996) by masking a part of a sequence to reduce the search space (Lim and Burge 2001) or by creating initial profiles based on a knowledge derived from related species (Neverov et al. 2003). Still, we selected a subset of all predicted introns with lengths close to the one observed with maximum frequency (±10 nt); additionally, we reduced each intron sequence to a 50-nt fragment situated upstream of the acceptor site (if the sequence is longer than 50 nt). The rationale for doing this is as follows. First, very short or very long introns are likely to be erroneous; also, even in truly long introns, the BP site may be situated further away than 50 nt from the acceptor site. Second, reducing fragment lengths to 50 nt makes the Gibbs sampler procedure more efficient. The length of the positional frequency model of the BP site (the “target window” length) was chosen to be 9 nt based on computational experiments with window lengths from 7–11 nt (data not shown). The Gibbs sampler was run in the site sampler mode assuming a single motif per sequence (http://bayesweb.wadsworth.org/web_help_text.Gibbs_versions.html). Given that a single iteration of the Gibbs sampler includes repositioning of each sequence involved in alignment, the number of iterations used was 500 (the default setting). At the final step, the positional frequency model was derived from only those motifs in a given intron sequence that appeared within the target window more than 50% of the time at the stage of the near optimal sampling, normally reached after the first 250 iterations. Since we did not require the presence of adenine “A” in the branching position, as it is not a necessity in nature, nucleotides T, C, or G could appear in the branching position with small frequencies. To more accurately estimate these small values, we have reduced the Gibbs sampler default 10% fraction of pseudo counts to 0.1%. Next, we used the model of BP sites derived from a subset of introns to determine the most likely BP positions in the remaining introns as positions possessing the highest score with regard to the BP model. All predicted BP positions were then used to delineate more precisely the length distribution of upstream spacers. Also, we used the set of downstream spacer sequences as a training set for the compositional model of downstream spacer sequence. Finally, with parameters of the enhanced intron submodel in place, the algorithm is ready for the next iteration.
Preparation of test sets
Expressed sequence tags (ESTs) data were available for each of the 16 fungal species (Supplemental Table S2). For assessment of the algorithm performance, we used EST validated genes identified by a local pipeline mapping EST to genomic DNA (A. Kislyuk, A. Lomsadze, and M. Borodovsky, unpubl.). We have compiled test sets of two types. A test set of type I included only complete genes validated by EST sequences; a test set of type II included both complete and incomplete genes (Supplemental Table S4).
The EST to genome mapping proceeded as follows. First, genome-specific ESTs were aligned to genomic sequence using the program BLAT (Kent 2002). If (1) an individual alignment failed to cover more than 90% of the EST sequence or (2) any of the exons in alignment had an EST to genomic sequence identity below 90%, the whole EST sequence was discarded. Alignments that delineated introns with noncanonical splice sites were discarded as well. Integrated transcripts (alignment clusters) were generated from the retained EST to genome alignments by joining alignments that shared the same introns. If members of integrated transcripts obtained in this way disagreed on some other introns, the alignment cluster was split into noncontradictory transcripts of maximal length. At the next step, each transcript was analyzed for the presence of a noninterrupted protein-coding region in the GeneMark.hmm-P program (Lukashin and Borodovsky 1998) modified to use the Kozak context model along with the heuristic model of protein-coding regions (Besemer and Borodovsky 1999), and predicts protein-coding regions as whole or partial ORFs. Normally, just one transcript from an alignment cluster would pass the filter for the presence of only one gene. Otherwise, if two or more distinct transcripts with conflicting gene structures would appear, we assumed that the locus in question is hosting a gene with alternative splicing; then the whole integrated transcript was removed from consideration. Subsequent mapping of a transcript to genomic DNA defined either a complete (containing both 5′ and 3′ UTR, with translation start and end predicted by the modified GeneMark.hmm-P program) or incomplete gene. The rules of thus described EST-to-DNA mapping as well as transcript selection are rather stringent. As a consequence, the test sets of complete genes (type I test sets) turned out to be larger than 150 genes for only four of the fungal species analyzed here: Coprinus cinereus, Coccidioides immitis, Fusarium verticillioides, and Magnaporthe grisea (Supplemental Table S4). Additionally, we generated a type I test set for S. pombe, the most studied genome, by using annotated complete genes with protein products exactly matching S. pombe proteins in the SWISS-PROT database (Watanabe and Harayama 2001). The type II test sets, the test sets that include incomplete genes, were compiled for the remaining 11 fungal genomes (Supplemental Table S4). We should emphasize that the translation initiation and termination sites in the test set of complete genes were determined computationally; thus, the values of Sn and Sp determined for these sites should be taken with caution.
To create yet another type of a test set, we have connected 1277 manually curated complete S. pombe genes by random sequences emulating noncoding regions of the S. pombe genome with 31% GC content. The “intergenic” sequences of a given “artificial chromosome” were chosen to have one and the same length L; thus, we created instances of the S. pombe artificial chromosome for several L values ranging from 50 to 6000 nt. All gene sequences were placed in the direct strand of a chromosome. Computational experiments with the reverse complement of an artificial chromosome produced the same results as ones reported for the direct sequence.
Results
Algorithm testing and application to several fungal genomes
We applied the new algorithm to genomic sequences of fungal species from the phyla Ascomycota, Basidiomycota, and Zygomycota (Table 1; Supplemental Fig. S1); the set of 16 species spans large evolutionally distances and exhibits significant variability in genome size, gene number, average number of introns per gene, as well as in the number of repetitive elements (Supplemental Table S5). The average sizes of exons and introns vary from 250 to 450 nt and from 90 to 160 nt, respectively (Fig. 1). Notably, the data show that Ascomycetes have fewer introns per gene and longer average intron and exon sizes than Basidiomycetes and Zygomycetes. The analysis of each genome went through the following steps. First, the program was run on unannotated genomic sequences and produced the HMM model parameters along with gene predictions. Second, we used the test set generated for a given genome (see Methods) to assess the prediction accuracy in terms of Sn and Sp. Third, we compared genes predicted in a whole genome with its current annotation and analyzed observed differences. We also used the S. pombe artificial chromosomes (see Methods) to assess the frequency of gene merging and splitting, frequency of false-positive gene predictions in intergenic sequences, as well as an error rate in the exact gene prediction. The S. pombe genome in our set has the least number of introns per gene, with 55% of its genes possessing no introns at all.
Note that the yeast-like genomes, with 90%–95% of the intronless genes, belong to a gray area where the ab initio gene prediction programs developed for either prokaryotes or eukaryotes generate sufficiently accurate predictions for the intronless protein-coding ORFs. An accurate prediction of the remaining multiple exon genes presents a challenge. A prokaryotic gene finder will at best predict all exons in a gene as separate ORFs. A eukaryotic gene finder could potentially produce a much better result. However, the small total number of introns in a yeast-like genome presents a challenge for both supervised and unsupervised training, since it poses a natural restriction on the size of a training set for estimation of parameters of the intron submodel. We are aware of this problem and are working on the algorithm for accurate prediction of the intron containing genes in the yeast-like genomes.
Assessment of the accuracy of gene prediction
We demonstrated on test sets of complete and incomplete genes (see Methods) that transition to the enhanced intron submodel significantly improved Sn and Sp of prediction of splice sites, introns, and internal exons (Table 2; Supplemental Table S6). Notably, Sn was boosted higher than Sp in almost all categories (Table 2; Fig. 4; Supplemental Table S6). Still, for the R. oryzae genome, we observed just a slight increase in Sn and Sp values (Fig. 3). The likely reason behind this observation is as follows. Introns of the fungal species from phyla Ascomycota and Basidiomycota exhibit sequence conservation around the BP site while the conserved sequence near acceptor sites is short (and less informative). To the contrary, introns of R. oryzae, a member of phylum Zygomycota, possess a 20-nt-long poly-Y tail combined with a weak BP signal (Supplemental Figs. S4, S5). Weakly conserved BP sites and long poly-Y tails were observed also in introns of Phycomyces blakesleeanuss, a member of the same order of Zygomycota as R. oryzae (M. Bruce, A. Lomsadze, and M. Borodovsky, unpubl.). Notably, the estimated value of P(bp) for R. oryzae is equal to 0.22; thus the role of the BP model in intron prediction (and, arguably, its role in the splicing mechanism) is relatively small. Note that for the other 15 fungal species, we have P(bp) = 0.90, with the exception of P(bp) = 0.77 for Magnaporthe grisea (Supplemental Table S3). This distinction between members of the fungal phyla Ascomycota and Basidiomycota on one side and the phylum Zygomycota on the other indicates that the BP site centered type of the splicing mechanism (thought to be typical for fungi) or the poly-Y tail centered type (thought to be typical for higher eukaryotes) could evolve under selection pressure as alternative options in several eukaryotic lineages, including some lineages of fungal species.
Accuracy of prediction of gene structure elements (Sn/Sp)
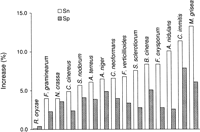
The increase in values of Sn and Sp of internal exon prediction achieved by the algorithm with enhanced intron submodel compared with the values of Sn and Sp of the algorithm with original intron submodel (at the points of algorithms’ convergence).
Findings made upon derivation of the site models
We compared the models of BP and splice sites inferred by the MCMC method from intron sequences determined ab initio with the models derived by the same MCMC method from intron sequences mapped in genomic sequence via ESTs. The number of EST derived introns in a given genome varied from 1152 (F. oxysporum) to 7812 (C. cinereus); the set of introns identified by ab initio algorithm in the same genome was observed to be three to 48 times larger. The relative entropies of the first-order models of BP and splice sites differed between two types of models by no more than 7% in almost all cases (Supplemental Table S7). As a rule, a BP site carries an amount of information comparable to what is carried by a donor site. Importantly, in all species but R. oryzae, the BP sites actually carry more information for accurate splicing than acceptor sites. In the predicted BP sites of all of the 16 fungal species except for R. oryzae, the consensus sequence of the positional nucleotide frequencies was CTNAC (Supplemental Fig. S5). The estimated frequencies of the canonical “A” in the BP position varied from 97% (R. oryzae) to 99% (C. cinereus). The most frequent length of the downstream spacer was 8–18 nt. We also observed characteristic unimodal shapes for the downstream spacer length distributions with the narrowest peak for S. nodorum (Supplemental Fig. S2). The value of the relative entropy for the spacer length distributions, with regard to the uniform distribution, can be used as a measure of “compactness” of the BP site localization. A low value of this parameter, in concert with a deviation of the consensus of the emerging BP model from CTNAC, usually pointed out to a problem with input sequence data; this could be due to either (1) a scarcity of evolutionarily conserved BP motifs in the sample (e.g., R. oryzae), or (2) significant enrichment with the extraneous sequences (due to erroneous acceptor site predictions).
Dynamics of the change in gene prediction accuracy upon algorithm iterations.
We traced the step-by-step changes in the accuracy of gene prediction by using the model parameters generated in subsequent iterations. We performed this analysis for the five test sets of complete genes (Set I in Supplemental Table S4). The values of Sn and Sp for predictions of exons, splice sites, initiation sites, and termination sites are shown in Supplemental Figure S6 as functions of iteration index. In the first iteration, one could expect to see a relatively low gene prediction accuracy of the algorithm employing heuristic models. However, this accuracy is high enough to allow for selecting a training set for reparameterization and improving the models to produce rather high Sp values in the second iteration: 40%–65% in internal exon prediction. Sp continues to grow in the third iteration where Sn remains in the range 20%–40%. However, in the next iteration, where length distributions of introns and exons are switched from uniform ones to estimated from predicted gene models, the Sn values jump to 58%–80%. Further improvement occurs in the fifth iteration, where we parameterize and start to use the enhanced intron submodel (Supplemental Fig. S6). We have to emphasize that the increases in Sn follow increases in Sp in the previous iteration. High Sp values indicate that the majority of current predictions are correct and ensure that the training set compiled for the next iteration includes a high percentage of correctly labeled sequences. Thus, not surprisingly, selection of a more reliable source for parameter estimation leads to better performance, particularly an increase in Sn.
Assessment of the accuracy of gene prediction in S. pombe artificial chromosomes
A test set having strictly one gene per sequence is not suitable for identification of errors in gene merging or for detection of incorrectly predicted genes in intergenic regions. However, for any given genome, it is difficult to find a large set of sequences possessing several validated genes in a row. Therefore, similar to an earlier implemented approach (Pavy et al. 1999), we used 1277 verified complete genes of S. pombe to construct a set of artificial chromosomes; “connectors” between genes were random sequences with fixed lengths ranging from 50 nt in the shortest chromosome to 6000 nt in the longest one (see Methods).
First, we observed that for all the lengths of intergenic regions the algorithm with the enhanced intron submodel had almost exactly the same performance as the original algorithm; both algorithms made a total of two to three splits in 1277 genes regardless of the length of the intergenic region. Second, we have detected that the new intron submodel makes the algorithm less prone to gene merging (Fig. 5). By taking into account the fact that 50% of intergenic regions in the S. pombe genome are longer than 750 nt (Supplemental Fig. S7) and that the real genes are located in both strands, which reduces the chance of merging, we estimate that the algorithm may merge ∼20 out of 1000 (2%) of genes. Third, the new algorithm predicts false genes in intergenic regions at a slightly lower rate than the original algorithm (Supplemental Fig. S8). Thus, the rate of false-positive predictions is estimated at three per 1000 intergenic regions. Finally, in terms of exact gene prediction, the algorithm with the new intron submodel shows quite stable performance if intergenic regions are shorter than 1500 nt; here, it is able to exactly predict ∼900 genes out of 1277 (Supplemental Fig. S9). The original algorithm makes exact predictions for ∼800 genes in all types of the artificial chromosomes.
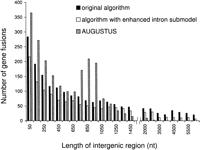
Statistics of erroneous gene fusions predicted in the S. pombe artificial chromosomes: the number of gene fusions per 1277 genes. The chromosomes differ in the length of random sequences emulating intergenic regions; all genes are placed in direct strand.
Comparison of the gene complements predicted and annotated in fungal genomes
We observed that predictions made by the new algorithm were in general agreement with the currently existing gene annotations both in terms of the total number of genes and the number of introns per spliced gene (Table 1). Particularly, in seven genomes out of 16—Aspergillus nidulans, A. terreus, Coprinus cinereus, C. neoformans, F. verticillioides, N. crassa, and S. pombe, the numbers of genes predicted and annotated were quite close to each other. The difference in total numbers of predicted and annotated genes was near or exceeded 1000 genes in genomes of nine species: Aspergillus niger, Botrytis cinerea, C. immitis, Fusarium graminearum, F. oxysporum, M. grisea, R. oryzae, S. nodorum, and Sclerotinia sclerotiorum. Only in three genomes, A. terreus, F. oxysporum, and F. verticulloides, was the number of predicted genes larger than the number of genes annotated (Table 1; Supplemental Fig. S10).
To further investigate this matter, we singled out in each of the nine genomes a set of “common” genes, both predicted and annotated, and then focused on the remaining two sets: genes annotated but not predicted and genes predicted but not annotated. The protein products of genes in both sets were used as queries for similarity searches against the “nr” protein sequence database (www.ncbi.nlm.nih.gov/) and the Conserved Domain Database (CDD) (www.ncbi.nlm.nih.gov/Structure/cdd/cdd.shtml; Marchler-Bauer et al. 2007).
Genes annotated but not predicted
A rather small fraction of protein products of these genes had a statistically significant similarity to proteins in the “nr” and CDD databases (Table 3). Notably, many of these proteins were rather short in length (e.g., B. cinerea) (Supplemental Fig. S11), an observation that may raise concerns about reliability of annotation of the corresponding genes.
Statistics of comparative genomics analysis of protein products of the genes annotated in the nine fungal genomes
Genes predicted but not annotated
We did not observe an excess of short genes in this category (e.g., F. oxysporum) (Supplemental Fig. S11). The fraction of the encoded proteins that exhibit similarity to proteins in the “nr” database was larger than in the group of genes annotated but not predicted (Table 4). Many of these similarities were detected with “nr” database proteins characterized as “hypothetical.” Such findings support the ab initio predictions, though they do not shed light on the protein function. Still, similarities detected to known proteins led to several interesting findings as described in the Supplemental Results.
Statistics of comparative genomics analysis of protein products of genes newly predicted in the nine fungal genomes
Comparison with other gene prediction programs
For a fair comparison of gene prediction programs using conventional supervised training, the programs have to be trained on the same data set that does not overlap with the test set. In assessment of a self-training program, the “no-overlap of training and test sets” condition can be fulfilled if the test set sequences are excluded from input to the self-training algorithm. However, a program that employs unsupervised training does not make any use of annotated genomic regions provided as a training set. Thus, a program with supervised training has a certain information advantage, unless the training set is biased (which is a frequent concern). Therefore, how to conduct a fair comparison of supervised and unsupervised programs is not immediately obvious. Thus, we conducted the program comparisons “as is” with an understanding that rigorous rules of fair competitions are yet to be determined.
The GipsyGene program is one of a few designed specifically for fungal genomes (Neverov et al. 2003). It was trained for A. nidulans and N. crassa. An addition of the BP model to the GipsyGene program led to increase of internal exon prediction Sn from 69%–75% to 75%–80% (with upper limits cited for A. nidulans). Given the difference in the test sets, it is reasonable to compare only Sn values, which in our case are 82.6%–83.6% for the original algorithm and 89.1%–91.8% for the algorithm with enhanced intron submodel (Supplemental Table S6). While a significant improvement in prediction accuracy was reached by GipsyGene after addition of the BP model, the overall accuracy remained relatively low, a fact apparently related to a small size of available training sets (193 and 99 genes for A. nidulans and N. crassa, respectively).
We also made a performance comparison with the locally run gene finder AUGUSTUS (Stanke and Waack 2003). For this purpose, we used the test sets of sequences of five fungal genomes with verified complete genes (Supplemental Table S4, Set I). In terms of average accuracy, (Sn + Sp)/2, the new program has shown better results in all eight categories for F. verticulloides, M. grisea, and S. pombe and in seven out of eight categories for C. immitis and C. cinereus (Table 5). Note that insufficiently high performance of AUGUSTUS for F. verticillioides could be explained by the use of the model parameters derived for the genome of F. graminearum (and selected for AUGUSTUS from a set of pre-computed models). For M. grisea, the new algorithm shows 8.3% higher Sn and 5.3% higher Sp in internal exon prediction accuracy, while AUGUSTUS performs marginally better in Sp for detection of initiation and termination sites and for nucleotides. Nevertheless, all the average values, (Sn + Sp)/2, for M. grisea are higher for the new algorithm than for AUGUSTUS. There are several reasons to emphasize the results obtained for S. pombe. First, the size of S. pombe genome, 12 Mb, is close to the minimum size (10 Mb) required for unsupervised training (Lomsadze et al. 2005). Second, a large number of experimentally verified S. pombe genes are known; thus, the S. pombe genome is a good target for an algorithm using supervised training. Third, the test set contains about a half of all S. pombe genes with multiple exons; thus the chance of overlap between the AUGUSTUS training set and the current test set is high. Still, performance of the unsupervised algorithm on the S. pombe genome is better in all categories with respect to (Sn + Sp)/2.
Comparison of the performances of the GeneMark-ES-2 program and the AUGUSTUS program
We have further extended the comparative tests to the S. pombe artificial chromosomes. In gene splitting, both AUGUSTUS and the new algorithm show almost identical error rates (two to three gene splits per 1277 genes). In chromosomes with intergenic regions shorter than 1100 nt, AUGUSTUS predicts a larger number of gene fusions (Fig. 5) and makes more errors in exact gene prediction (Supplemental Fig. S9). AUGUSTUS shows local increases (spikes) in error rates for gene merging and a decrease in the accuracy of exact gene prediction for chromosomes with 750- to 950-nt-long intergenic regions. These effects could be related to the settings made in AUGUSTUS for modeling intergenic regions. On the other hand, AUGUSTUS makes a fewer number of false-positive predictions in intergenic regions longer than 4500 nt (Supplemental Fig. S8).
Discussion
It is natural to anticipate that the line of development of eukaryotic gene prediction algorithms would follow the path of prokaryotic gene finding. For prokaryotes, algorithms that focused almost entirely on the prediction stage of the gene identification problem (i.e., how to find genes given a training sequence) evolved into automatic self-training systems capable of adjusting to genome-specific properties in the process of estimating algorithm parameters from anonymous sequence (Audic and Claverie 1998; Hayes and Borodovsky 1998; Salzberg et al. 1998; Besemer et al. 2001; Larsen and Krogh 2003). A recent dramatic increase in the number of eukaryotic targets of genome sequencing has necessitated the development of unsupervised ab initio gene prediction algorithms for eukaryotes. We demonstrated earlier that an iterative ab initio self-training training is feasible for eukaryotic genomes (Lomsadze et al. 2005). Here we have further developed this approach to reach high accuracy in the application to genomes with specific features of gene organization, such as a large group of fungal genomes.
The introduction of the enhanced intron submodel significantly improved the prediction accuracy of the donor and acceptor sites as well as exons and introns (Table 2; Supplemental Table S6). The new algorithm predicted internal exons in 12 fungal genomes with Sn and Sp averages higher than 90% (Table 2; Supplemental Table S6). Since the new intron submodel increases the accuracy of exon detection, the accuracy of prediction of translation termination sites increases due to improved accuracy of detection of the last exon and its reading frame.
Fungal genomes analyzed in this article have been annotated by experts using both intrinsic and extrinsic methods of gene prediction (Supplemental Table S8). For instance, C. neoformans was annotated via the combined use of Exonerate (www.ebi.ac.uk/∼guy/exonerate/), Twinscan (Korf et al. 2001), SNAP (Korf 2004), GeneZilla (www.genezilla.org/), and Glimmer.hmm (Majoros et al. 2003). We consider the public annotation of genes in C. neoformans genome as one of the best in our sample (Tenney et al. 2004), similar in accuracy to annotation of the well-studied S. pombe genome. It is quite satisfying to report that a single gene prediction algorithm applied to the genomes of C. neoformans and S. pombe, though significantly different in terms of number of introns per gene, produced predictions that match the established gene annotations quite well (Table 1). In general, comparison of the annotated and predicted genes in the 16 fungal genomes shows the tendency to have more annotated genes than predicted (Table 1). Interestingly, while the total numbers of predicted and annotated genes may differ significantly, the predicted and annotated average intron densities are close to each other in the majority of cases (Table 1).
A short intron length is likely to be an indication that the intron definition mechanism is in use, which detects an intron part of the pre-mRNA by spliceosome, rather than an exon part. In the fungal species studied here, we observed predominantly short introns (<100 nt). However, splicing by intron definition may not be necessarily associated with formation of strongly conserved BP sites as is revealed in the case of R. oryzae, a Zygomycete. In contrast with the fungal species studied here from the phyla Ascomycota and Basidiomycota, R. oryzae short introns possess weak BP signals along with pronounced poly-Y tails near acceptor sites. Notably, fungal introns with strong BP sites, such as observed in the genomes of C. immitis, M. grisea, and N. crassa have even longer introns than R. oryzae (Supplemental Fig. S12). Interestingly, the exon length distributions of the species studied here show less variability than seen for the introns (Supplemental Fig. S13).
Conclusions
We anticipate that the ab initio self-training algorithm with enhanced intron submodel will be a useful tool for eukaryotic genomes with gene organizations similar to fungal genomes analyzed here. We have to emphasize that even within the fungal phyla, the deeply branched lineages are ubiquitous and the diversity is significant. Nevertheless, the algorithm adaptive training strategy allows for the automatic adjustment of the HMM architecture and the corresponding parameters. Probabilities of transitions between hidden states in the enhanced intron submodel are tuned to fit genomes with various numbers of introns per gene, as well as genomes with different types of splicing mechanisms: those that use information either from the BP sites or from the poly-Y tails. We have demonstrated that prior knowledge of the type of the splicing mechanism is not necessary for the application of the algorithm. Moreover, the algorithm is able to adapt to a genome with an a priori unknown fraction of introns possessing conserved BP sites. In our tests, we observed that the algorithm predicted splice sites in 13 fungal genomes with higher than 90% accuracy (Sn and Sp).
The advantage of the new ab initio gene prediction tool is twofold. First, it shows high performance; second, it is user friendly for the analysis of novel genomes, since it excludes an elaborate development of a training set. We also have to say that the self-training procedure is amenable to incorporation of extrinsic data (work in progress). We anticipate that the self-training approach will facilitate simplification and standardization of the architecture of gene annotation pipelines. While self-training seems to be especially valuable for early stages of sequencing projects, even at more advanced stages of the project with ample extrinsic information available, the self-training algorithm provides an integration framework for accurate and consistent gene annotation.
Acknowledgments
We thank Andrey Kislyuk for help in developing the software program used for preparation of the test sets; Marc Bruce, Igor Grigoriev, and Chinnappa Kodira for useful discussions; King Jordan for useful comments on the manuscript; and Wenhan Zhu and Ryan Mills for help with manuscript preparation. This work was supported in part by grant GM58763 to Y.O.C. and grant HG00783 to M.B. from the National Institutes of Health (NIH). Funding to pay publication charges for this article was provided by NIH grants GM58763 and HG00783.
Footnotes
-
↵5 Corresponding author.
↵5 E-mail borodovsky{at}gatech.edu; fax (404) 894-4243.
-
[Supplemental material is available online at www.genome.org. The new software program GeneMark-ES version 2 is freely available for download from http://exon.gatech.edu/genemark/gmhmm-es-2008.]
-
Article published online before print. Article and publication date are at http://www.genome.org/cgi/doi/10.1101/gr.081612.108.
-
- Received May 31, 2008.
- Accepted August 26, 2008.
- Copyright © 2008, Cold Spring Harbor Laboratory Press