HFR Progs Supplement
Matlab routines to perform QA/QC on high frequency radar (HFR) data and calculate temporal and spatial statistics.
Contact: John Largier Ph.D.

The zipped archives linked below contain Matlab routines to calculate temporal and spatial statistics for HF radar data, and perform QA/QC on the data. The processing methods are described in the technical report "HF Radar Processing Using “Nearest-Neighbor” Statistics, A Technical Report", developed for the California Coastal Conservancy for the Coastal Ocean Currents Monitoring Program by Chris Halle. Please reference the paper and/or acknowledge this website if using these routines or statistics.
StatsAndUsefulScripts
The two folders in the StatsAndUsefulScripts folder (HF_Scratch and HFR_Progs_Supplement) both contain the scripts that actually calculate the statistics and qa/qc the radials and totals. These are as yet somewhat unorganized, so the routines can be found in either folder. In general, script names generally follow a naming convention (1) scripts starting with “Get” – calculate the statistics, (2) script starting with “Clean” – qa/qc the radials or totals using the previously calculated statistics and user-specified totals, and (3) scripts starting with “Inv” – use the previously calculates stats and allow the user to interactively investigate the effects of setting different screening levels for the statistics.
SampleDrivingScripts
The scripts in the SampleDrivingScripts folder contain examples of how to call the processing routines. The ReadMe file in the SampleDrivingScripts folder indicates the proper order of processing. Please note that the scripts have not been optimized for speed, and can be repetitive.
The scripts set up the radials and totals in monthly files for processing and storage.
HFRosePlotRoutines
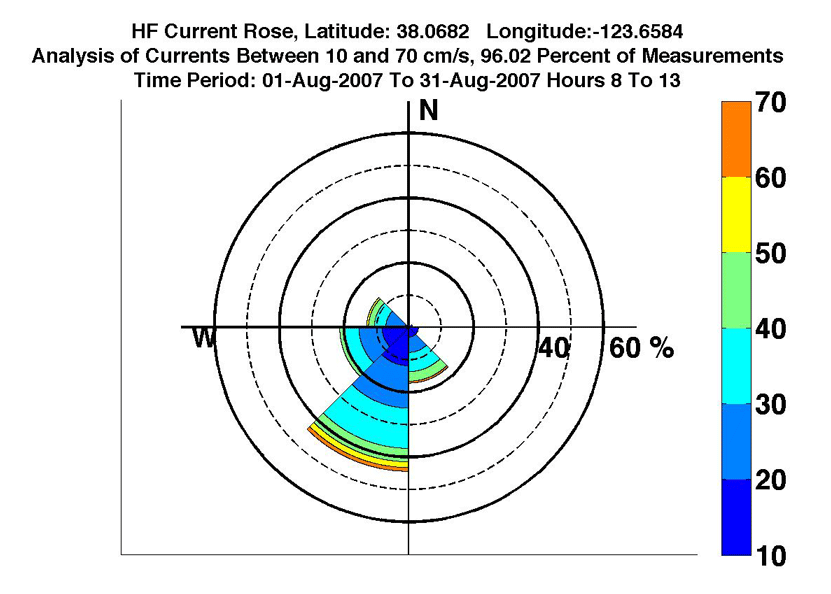
Current Rose Routines for HFR Data: prompt driven routines that allow the user to specify the date search range, etc, and generate plots.
Also see HFR Progs Matlab Toolbox
