Markets
The Economies Adding the Most to Global Growth in 2019

The Economies Adding the Most to Global Growth in 2019
Global economics is effectively a numbers game.
As long as the data adds up to economic expansion on a worldwide level, it’s easy to keep the status quo rolling. Companies can shift resources to the growing segments, and investors can put capital where it can go to work.
At the end of the day, growth cures everything – it’s only when it dries up that things get hairy.
Breaking Down Global Growth in 2019
Today’s chart uses data from Standard Chartered and the IMF to break down where economic growth is happening in 2019 using purchasing power parity (PPP) terms. Further, it also compares the share of the global GDP pie taken by key countries and regions over time.
Let’s start by looking at where global growth is forecasted to occur in 2019:
| Country or Region | Share of Global GDP Growth (PPP) in 2019F |
|---|---|
| China | 33% |
| Other Asia (Excl. China/Japan) | 29% |
| United States | 11% |
| Middle East & North Africa | 4% |
| Euro Area | 4% |
| Latin America & Caribbean | 3% |
| Other Europe | 3% |
| Sub-Saharan Africa | 2% |
| Japan | 1% |
| United Kingdom | 1% |
| Canada | 1% |
| Rest of World | 8% |
The data here mimics some of the previous estimates we’ve seen from Standard Chartered, such as this chart which projects the largest economies in 2030.
Asia as a whole will account for 63% of all global GDP growth (PPP) this year, with the lion’s share going to China. Countries like India and Indonesia will contribute to the “Other Asia” share, and Japan will only contribute 1% to the global growth total.
In terms of developed economies, the U.S. will lead the pack (11%) in contributing to global growth. Europe will add 8% between its various sub-regions, and Canada will add 1%.
Share of Global Economy Over Time
Based on the above projections, we were interested in taking a look at how each region or country’s share of global GDP (PPP) has changed over recent decades.
This time, we used IMF projections from its data mapper tool to loosely approximate the regions above, though there are some minor differences in how the data is organized.
| Country or Region | Share of GDP (PPP, 1980) | Share of GDP (PPP, 2019F) | Change |
|---|---|---|---|
| Developing Asia | 8.9% | 34.1% | +25.2 pp |
| European Union | 29.9% | 16.0% | -13.9 pp |
| United States | 21.6% | 15.0% | -6.6 pp |
| Latin America & Caribbean | 12.2% | 7.4% | -4.8 pp |
| Middle East & North Africa | 8.6% | 6.5% | -2.1 pp |
| Sub-Saharan Africa | 2.4% | 3.0% | +0.6 pp |
In the past 40 years or so, Developing Asia has increased its share of the global economy (in PPP terms) from 8.9% to an estimated 34.1% today. This dominant region includes China, India, and other fast-growing economies.
The European Union and the United States combined for 51.5% of global productivity in 1980, but they now account for 31% of the total economic mix. Similarly, the Latin America and MENA regions are seeing similar decreases in their share of the economic pie.


United States
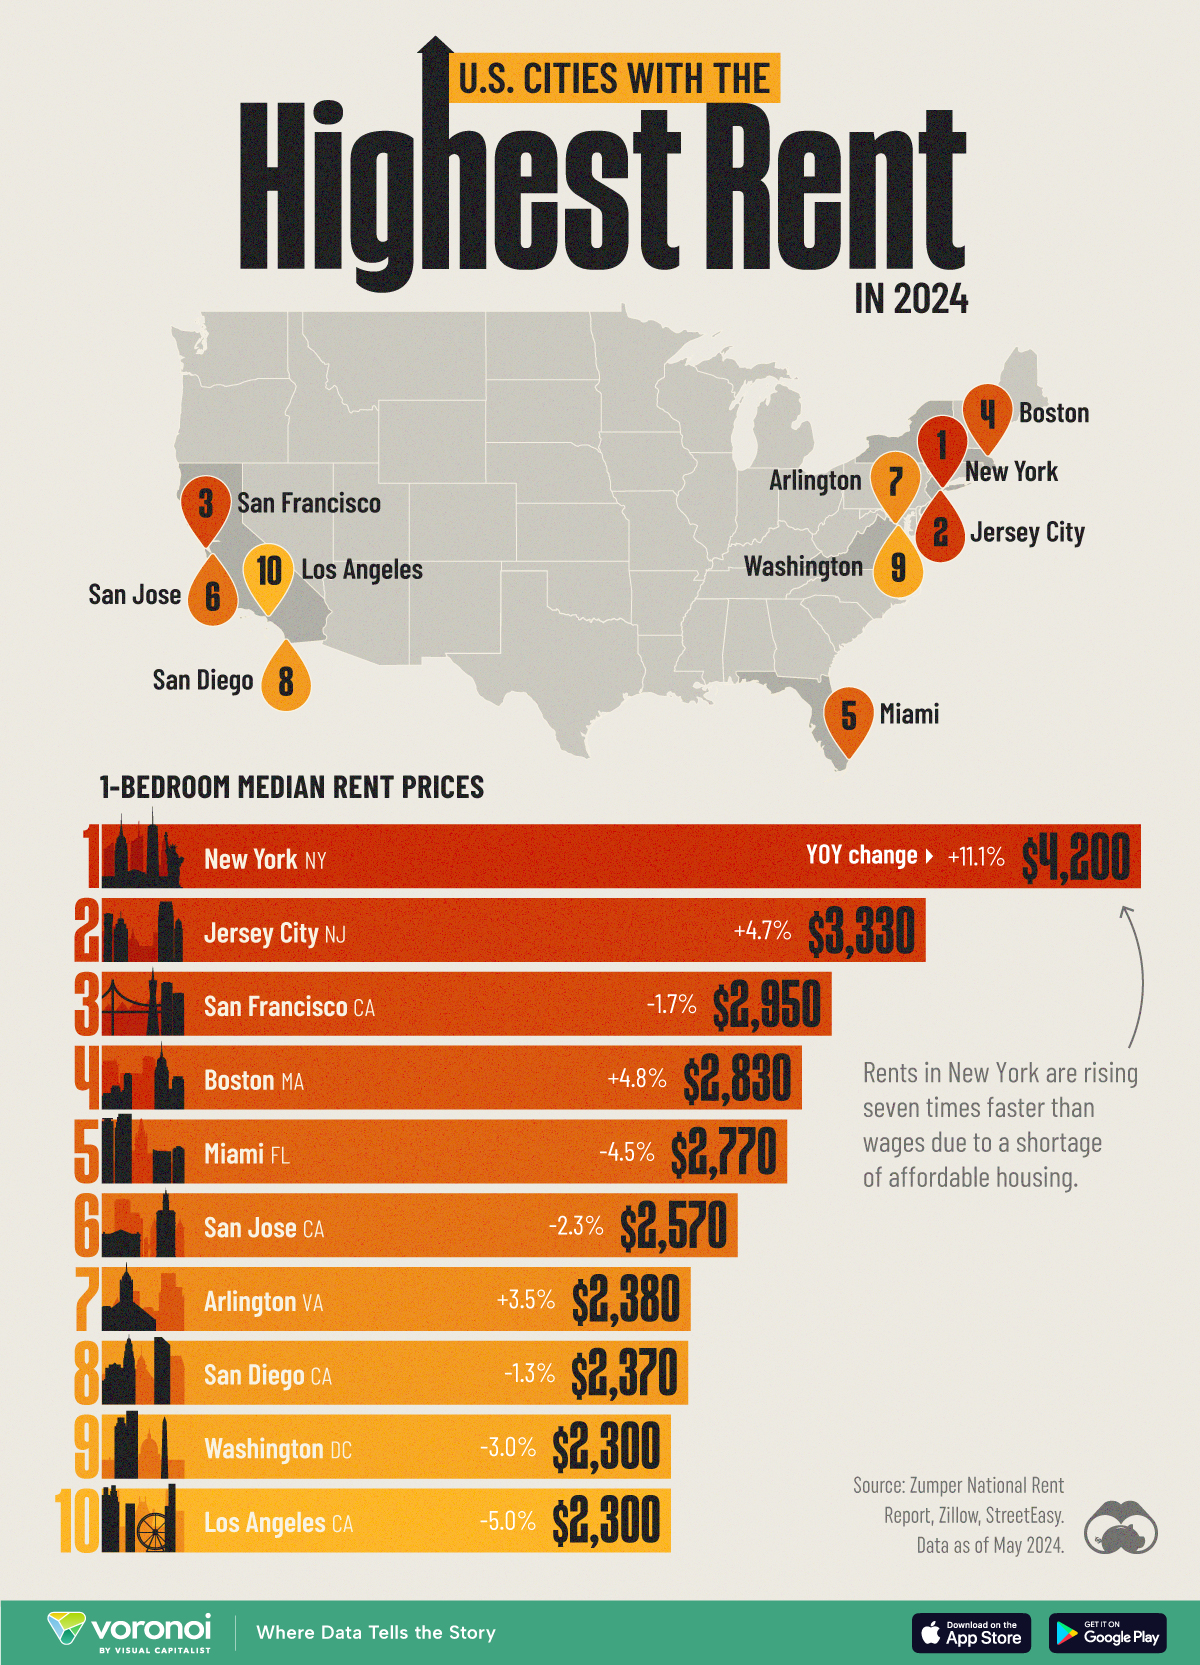
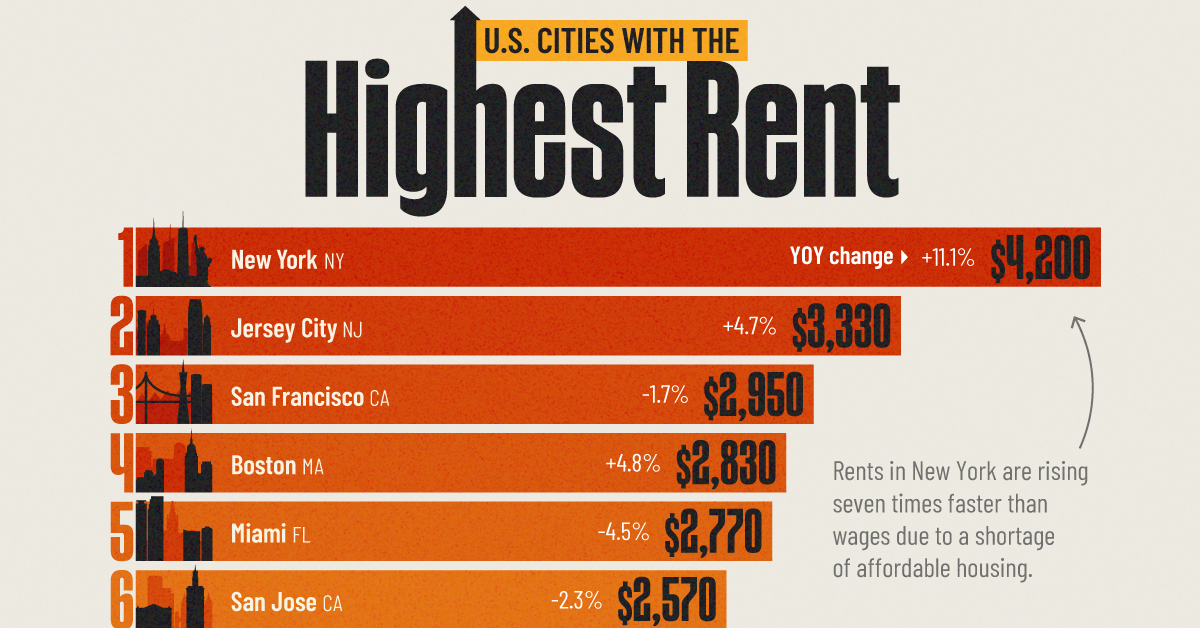
Ranked: U.S. Cities with the Highest Rent in 2024
NYC tops the list with an average monthly cost of $4,200 for a one-bedroom apartment.
Ranked: U.S. Cities with the Highest Rent in 2024
This was originally posted on our Voronoi app. Download the app for free on iOS or Android and discover incredible data-driven charts from a variety of trusted sources.
Rental prices have surged in several American cities in recent years. Factors such as inflation, a limited housing inventory, a changing workforce, and barriers to homeownership have all contributed to the increase in rent costs.
This graphic shows the top 10 American cities with the highest rental costs as of May 2024, according to the Zumper National Rent Index. Prices are for 1-bedroom units.
NYC Prices: $4,200 for One-Bedroom
New York tops the list with an average monthly cost of $4,200 for a one-bedroom apartment. Not only is it expensive, but due to high demand, living in the Big Apple can be competitive.
While half of all renters in the U.S. spend more than 30% of their income on rent, residents in New York can spend more than 40% of their income renting a place.
| Ranking | City | Price in 2024 | Price in 2023 | YOY change |
|---|---|---|---|---|
| 1 | New York, NY | $4,200 | $3,780 | 11.1% |
| 2 | Jersey City, NJ | $3,330 | $3,181 | 4.7% |
| 3 | San Francisco, CA | $2,950 | $3,001 | -1.7% |
| 4 | Boston, MA | $2,830 | $2,700 | 4.8% |
| 5 | Miami, FL | $2,770 | $2,900 | -4.5% |
| 6 | San Jose, CA | $2,570 | $2,630 | -2.3% |
| 7 | Arlington, VA | $2,380 | $2,299 | 3.5% |
| 8 | San Diego, CA | $2,370 | $2,401 | -1.3% |
| 9 | Washington, DC | $2,300 | $2,371 | -3.0% |
| 9 | Los Angeles, CA | $2,300 | $2,421 | -5.0% |
Across the Hudson River, Jersey City ranks second, with one-bedroom suites priced at $3,330.
On the West Coast, San Francisco leads with $2,950 for a one-bedroom unit. Four of the 10 most expensive cities to rent are in California.
According to a study by Harvard University, the pandemic has intensified the housing affordability crisis in the United States. While high-end market supply may offer some relief to middle and higher-income renters, lower-income households will continue to struggle due to high construction costs and market dynamics.
What are the most valuable housing markets in the United States? We ranked housing markets in this chart to find out.
-
 Demographics6 days ago
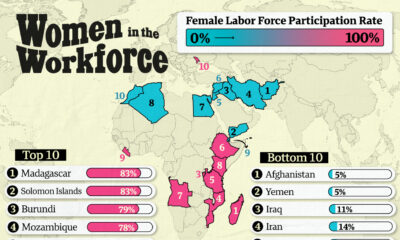
Which Countries Have the Most and Least Women in the Workforce?
-

 Markets2 weeks ago
Comparing Saudi Aramco’s $1.9T Valuation to Its Rivals
-

 Mining2 weeks ago
Visualizing Cobalt Production by Country in 2023
-
 Maps2 weeks ago
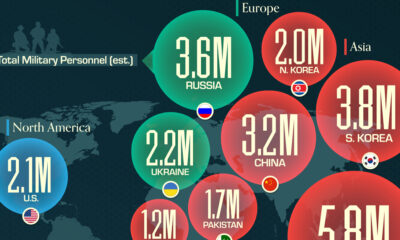
Mapped: The World’s Largest Armies in 2024
-

 Demographics2 weeks ago
Charted: America’s Most Popular Baby Names in 2023
-
 Technology1 week ago
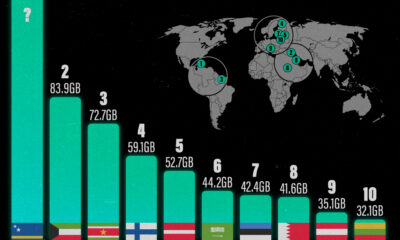
Visualizing the Top Countries, by Mobile Data Usage
-

 Misc1 week ago
Ranked: Top 10 Deadliest Animals for Humans
-

 United States1 week ago
The World’s Largest Economies: Comparing the U.S. and China