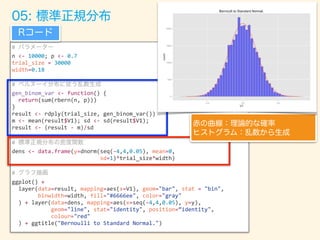
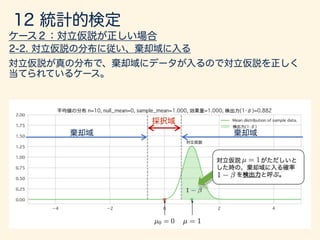
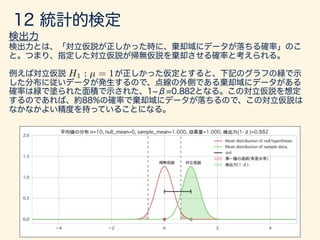
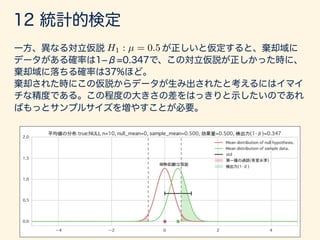
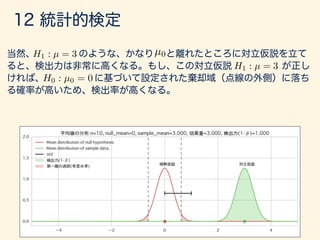
数学カフェ 確率・統計・機械学習回 「速習 確率・統計」
185 likes118,157 views

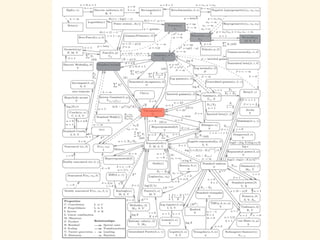
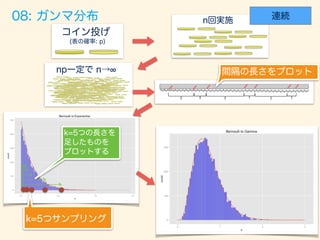
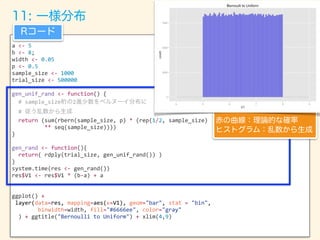
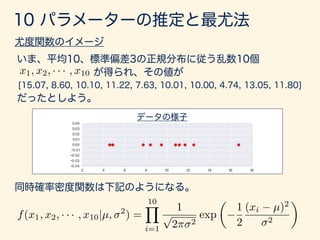
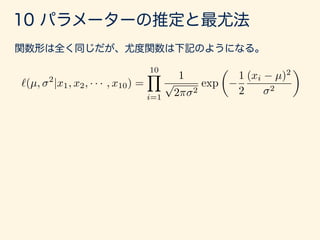
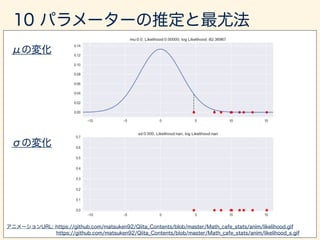
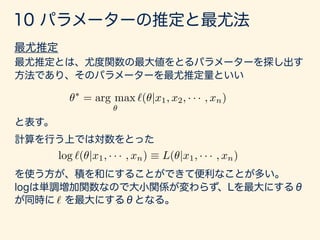
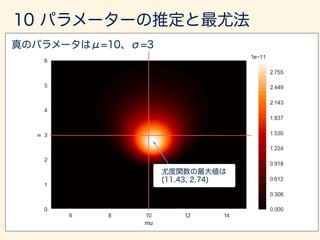
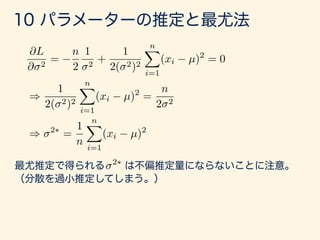
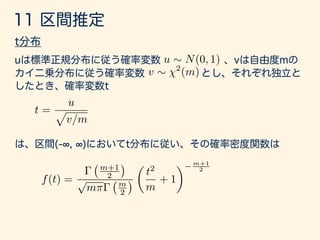
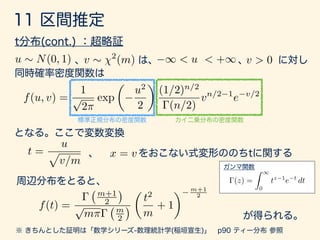
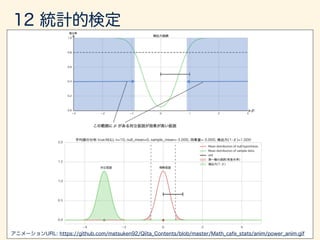
The document describes various probability distributions that can arise from combining Bernoulli random variables. It shows how a binomial distribution emerges from summing Bernoulli random variables, and how Poisson, normal, chi-squared, exponential, gamma, and inverse gamma distributions can approximate the binomial as the number of Bernoulli trials increases. Code examples in R are provided to simulate sampling from these distributions and compare the simulated distributions to their theoretical probability density functions.


![#
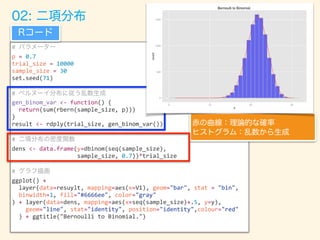
p <- 0.7; n <- 1000;
trial_size <- 100000; width <- 0.3;
df <- 3
# (3 )
gen_binom_var <- function() {
return(sum(rbern(n, p)))
}
gen_chisq_var <- function() {
result <- rdply(trial_size, gen_binom_var())
return(((result$V1 - mean(result$V1))/sd(result$V1))**2)
}
# df
result <- rlply(df, gen_chisq_var(),.progress = "text")
res <- data.frame(x=result[[1]] + result[[2]] + result[[3]])
# ( =3)
xx <- seq(0,20,0.1)
dens <- data.frame(y=dchisq(x=xx, df=df)*trial_size*width)
#
ggplot() + layer(data=data, mapping=aes(x=x), geom="bar", stat = "bin",
binwidth=width, fill="#6666ee", color="gray"
) + layer(data=dens, mapping=aes(x=xx, y=y),
geom="line", stat="identity", position="identity",
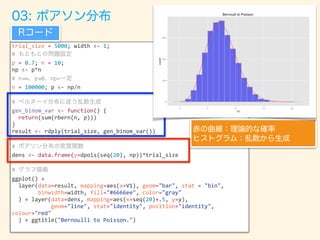
colour="blue" ) + ggtitle("Bernoulli to Chisquare")](https://image.slidesharecdn.com/rev012-170415120540/85/-75-320.jpg)

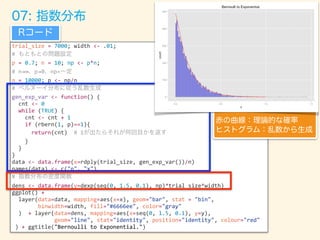

![trial_size = 7000; width <- .035;
#
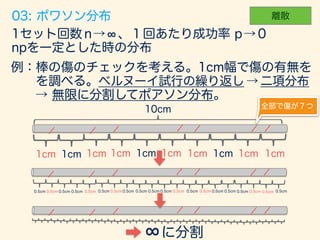
p = 0.7; n = 10; np <- p*n;
# n!∞ p!0 np=
n = 10000; p <- np/n; alpha <- 5
#
get_interval <- function(){
cnt <- 0
while (TRUE) {
cnt <- cnt + 1
if (rbern(1, p)==1){ return(cnt) }
}
}
gen_exp_var <- function() {
data <- data.frame(x=rdply(trial_size, get_interval())/n)
names(data) <- c("n", "x")
return(data)
}
result <- rlply(alpha, gen_exp_var())
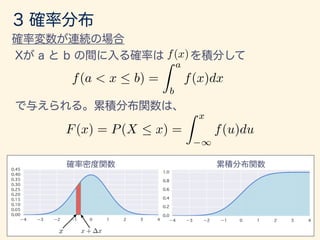
data <- data.frame(x=result[[1]]$x + result[[2]]$x + result[[3]]$x + result[[4]]$x +
result[[5]]$x)
#
dens <- data.frame(y=dgamma(seq(0, 3,.01), shape=alpha, rate=np)*trial_size*width)
ggplot() +
layer(data=data, mapping=aes(x=x), geom="bar", stat = "bin",
binwidth=width, fill="#6666ee", color="gray"
) + layer(data=dens, mapping=aes(x=seq(0,3,.01), y=y),
geom="line", stat="identity", position="identity", colour="red"
) + ggtitle("Bernoulli to Gamma")](https://image.slidesharecdn.com/rev012-170415120540/85/-84-320.jpg)

![trial_size = 7000; width <- .;
#
p = 0.7; n = 10; np <- p*n;
# n!∞ p!0 np=
n = 10000; p <- np/n; alpha <- 5
#
get_interval <- function(){
cnt <- 0
while (TRUE) {
cnt <- cnt + 1
if (rbern(1, p)==1){ return(cnt) }
}
}
gen_exp_var <- function() {
data <- data.frame(x=rdply(trial_size, get_interval())/n)
names(data) <- c("n", "x")
return(data)
}
result <- rlply(alpha, gen_exp_var())
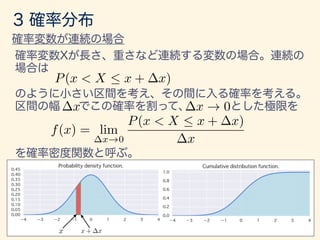
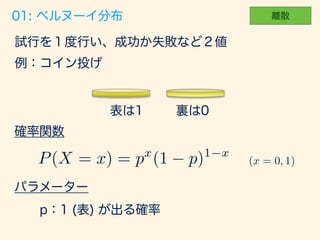
data <- data.frame(x=1/(result[[1]]$x + result[[2]]$x + result[[3]]$x +
result[[4]]$x + result[[5]]$x))
#
dens <- data.frame(y=dinvgamma(seq(0, 23,.01), shape=5, rate=1/np)*trial_size*width)
ggplot() +
layer(data=data, mapping=aes(x=x), geom="bar", stat = "bin",
binwidth=width, fill="#6666ee", color="gray"
) + layer(data=dens, mapping=aes(x=seq(0,3,.01), y=y),
geom="line", stat="identity", position="identity", colour="red"
) + ggtitle("Bernoulli to Inversegamma")](https://image.slidesharecdn.com/rev012-170415120540/85/-88-320.jpg)
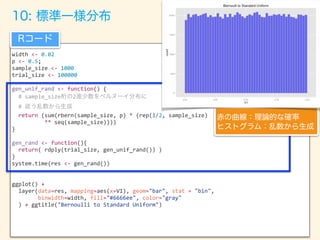


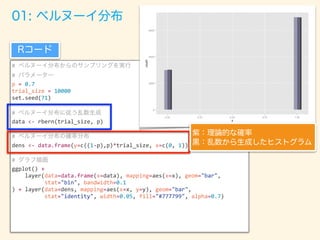
![width <- 0.03; p <- 0.5
digits_length <- 30; set_size <- 3
trial_size <- 30000
gen_unif_rand <- function() {
# digits_length 2
#
return (sum(rbern(digits_length, p) *
(rep(1/2, digits_length) **
seq(digits_length))))
}
gen_rand <- function(){
return( rdply(set_size, gen_unif_rand())$V1 )
}
unif_dataset <- rlply(trial_size, gen_rand, .progress='text')
p <- ceiling(set_size * 0.5); q <- set_size - p + 1
get_nth_data <- function(a){ return(a[order(a)][p]) }
disp_data <- data.frame(lapply(unif_dataset, get_nth_data))
names(disp_data) <- seq(length(disp_data)); disp_data <- data.frame(t(disp_data))
names(disp_data) <- "V1"
x_range <- seq(0, 1, 0.001)
dens <- data.frame(y=dbeta(x_range, p, q)*trial_size*width)
ggplot() +
layer(data=disp_data, mapping=aes(x=V1), geom="bar", stat = "bin",
binwidth=width, fill="#6666ee", color="gray"
) + layer(data=dens, mapping=aes(x=x_range, y=y),
geom="line", stat="identity", position="identity", colour="red"
) + ggtitle("Bernoulli to Beta")](https://image.slidesharecdn.com/rev012-170415120540/85/-100-320.jpg)
![E[X] = X( )P( ) + X( )P( )
= 0 ⇥ 0.8 + 1, 000, 000 ⇥ 0.2
= 200, 000
E[X] =
X
x
xp(x)
µ](https://image.slidesharecdn.com/rev012-170415120540/85/-102-320.jpg)
![✓
n
x
◆
=
n!
(n x)!x!
E[X] =
nX
x=0
xP(x) =
nX
x=0
x
✓
n
x
◆
px
(1 p)n x
=
nX
x=0
x
n!
(n x)!x!
px
(1 p)n x
=
nX
x=0
n
(n 1)!
(n x)!(x 1)!
px
(1 p)n x
= np
nX
x=0
✓
n 1
m 1
◆
p(x 1)
(1 p)(n 1) (x 1)
= np
= np
nX
x=1
✓
n 1
m 1
◆
p(x 1)
(1 p)(n 1) (x 1)
= np](https://image.slidesharecdn.com/rev012-170415120540/85/-103-320.jpg)
![Var[X] = E[(X E[X])2
]
=
X
x
(x E[x])2
P(x)
= 2
µ](https://image.slidesharecdn.com/rev012-170415120540/85/-104-320.jpg)
![Var[x] = E[(X E[X])2
]
=
Z 1
1
(x E[x])2
f(x)dx
= 2
E[X] =
Z 1
1
xf(x)dx
= µ](https://image.slidesharecdn.com/rev012-170415120540/85/-105-320.jpg)
![E[g(X)] =
Z 1
1
g(x)f(x)dx
g(X) = (X E[X])2
E[ · ] =
Z 1
1
· f(x)dx](https://image.slidesharecdn.com/rev012-170415120540/85/-106-320.jpg)
![g(x) = xk
E[g(X)] = E[Xk
] =
Z 1
1
xk
f(x)dx
µ0
k](https://image.slidesharecdn.com/rev012-170415120540/85/-107-320.jpg)
![g(x) = (x E[x])k
E[g(X)] = E[(X E[X]])k
] =
Z 1
1
(x E[x])k
f(x)dx
µk](https://image.slidesharecdn.com/rev012-170415120540/85/-108-320.jpg)
![E[cX] = cE[X]
* E[cX] =
Z 1
1
cxf(x)dx = c
Z 1
1
xf(x)dx
= cE[X]](https://image.slidesharecdn.com/rev012-170415120540/85/-109-320.jpg)
![Var[cX] = c2
Var[X]
* Var[cX] =
Z 1
1
(cx E[cx])2
f(x)dx
=
Z 1
1
(cx cµ)2
f(x)dx
=
Z 1
1
c2
(x µ)2
f(x)dx
= c2
Z 1
1
(x µ)2
f(x)dx
= c2
Var[X]](https://image.slidesharecdn.com/rev012-170415120540/85/-110-320.jpg)


![EX,Y [ g(X, Y )] =
Z 1
1
Z 1
1
g(x, y)f(x, y)dxdy
g(x, y) = x0.8
y0.8 (x, y) ⇠ N((4, 4), S) S =
1 0.5
0.4 1
EX,Y [ g(X, Y )] = 8.02](https://image.slidesharecdn.com/rev012-170415120540/85/-114-320.jpg)
![g(X, Y ) = (X µX)(Y µY )
Cov[X, Y ] = E[(X µX)(Y µY )]](https://image.slidesharecdn.com/rev012-170415120540/85/-115-320.jpg)
![g(X, Y ) = (X µX)(Y µY )
µX µX
µX µX
µY
µY
µY
µY
S1 = S2 =
S3 = S4 =
1 0.8
0.8 1
1 0.8
0.8 1
1 0
0 1
1 0.999
0.999 1
Cov[X, Y ] = E[(X µX)(Y µY )]
(x, y) ⇠ N((4, 4), S)](https://image.slidesharecdn.com/rev012-170415120540/85/-116-320.jpg)

![x1 · · · xn
g1(x1), · · · , gn(xn) x1 · · · xn
E[
nY
i=1
gi(xi)] =
nY
i=1
E[gi(xi)]
E[g1(x1)] E[gn(xn)]
E[
nY
i=1
gi(xi)] =
Z 1
1
· · ·
Z 1
1
g1(x1) · · · gn(xn)f(x1, · · · , xn)dx1 · · · dxn
=
Z 1
1
g1(x1)f(x1)dx1 · · ·
Z 1
1
gn(xn)f(xn)dxn
=
nY
i=1
E[gi(xi)]
f(x1) · · · f(xn)](https://image.slidesharecdn.com/rev012-170415120540/85/-120-320.jpg)
![E[c1x1 + · · · + cnxn]
=
Z 1
1
· · ·
Z 1
1
(c1x1 + · · · + cnxn)f(x1 · · · , xn)dx1 · · · dxn
= c1
Z 1
1
· · ·
Z 1
1
x1f(x1 · · · , xn)dx1 · · · dxn · · ·
cn
Z 1
1
· · ·
Z 1
1
xnf(x1 · · · , xn)dx1 · · · dxn
=c1
Z 1
1
x1dx1 · · · cn
Z 1
1
xndxn
=c1µ1 + · · · + cnµn
f(x1) · · · f(xn)
f(x1) · · · f(xn)
µ1 µn
=c1
Z 1
1
x1dx1 · · · cn
Z 1
1
xndxn
=c1µ1 + · · · + cnµn](https://image.slidesharecdn.com/rev012-170415120540/85/-122-320.jpg)
![Var[c1x1 + · · · + cnxn]
= E[{(c1x1 + · · · + cnxn) E[c1x1 + · · · + cnxn]}2
]
= E[{c1(x1 µ1) + · · · + c1(x1 µ1)}2
]
= E[
nX
i=1
c2
i (xi µi)2
+
X
i6=j
cicj(xi µj)(xi µj)]
=
nX
i=1
c2
i E[(xi µi)2
] +
X
i6=j
cicjE[(xi µj)(xi µj)]
= c2
1
2
1 + · · · + c2
n
2
n
c1µ1 + · · · + cnµn
= E[xi µi]E[xj µj] = 0= 2
i](https://image.slidesharecdn.com/rev012-170415120540/85/-123-320.jpg)

![x1 · · · xn
T = x1 + · · · + xn
E[T] = E[x1 + · · · + xn]
= E[x1] + · · · + E[xn]
= nµ
Var[T] = Var[x1 + · · · + xn]
= Var[x1] + · · · + Var[xn]
= n 2
2
1 = · · · = 2
n
c1 = · · · = cn = 1
Var[c1x1 + · · · + cnxn]
= c2
1
2
1 + · · · + c2
n
2
n](https://image.slidesharecdn.com/rev012-170415120540/85/-126-320.jpg)
![¯x =
1
n
nX
i=1
xi =
1
n
T
E[¯x] =
1
n
E[T] = n ·
1
n
µ = µ
Var[¯x] = Var[
1
n
T] =
1
n2
Var[T] =
2
n
µ
2](https://image.slidesharecdn.com/rev012-170415120540/85/-127-320.jpg)
![Var[¯x] =
2
n
=
0.0833
500
= 0.000166
E[¯x] = 0.5](https://image.slidesharecdn.com/rev012-170415120540/85/-128-320.jpg)
![Var[¯x]](https://image.slidesharecdn.com/rev012-170415120540/85/-129-320.jpg)


![2
=
Z 1
1
(x µ)2
f(x)dx
=
Z
I1
(x µ)2
f(x)dx +
Z
I2
(x µ)2
f(x)dx +
Z
I3
(x µ)2
f(x)dx
2
=
Z
I1
(x µ)2
f(x)dx +
Z
I3
(x µ)2
f(x)dx
=
Z
I1
2 2
f(x)dx +
Z
I3
2 2
f(x)dx
= 2 2
[P(x 2 I1) + P(x 2 I3)]
I1 = ( 1, µ ),
I2 = [µ , µ + ],
I3 = (µ + , 1)
= P(|x µ| > )
P(|x µ| > ) 5
1
2
)](https://image.slidesharecdn.com/rev012-170415120540/85/-132-320.jpg)


![g(x) = ext
E[ext
] =
Z 1
1
ext
f(x)dx
Mx(t) = E[ext
]
Mx(t)
My(t)
x
t = 0
y](https://image.slidesharecdn.com/rev012-170415120540/85/-147-320.jpg)
![g(x) = ext
ext
= 1 + xt +
t2
2!
x2
+ · · · +
tk
k!
xk
+ · · ·
Mx(t) = E[ext
]
= E[1 + xt +
t2
2!
x2
+ · · · +
tk
k!
xk
+ · · · ]
= 1 + tE[x] +
t2
2!
E[x2
] + · · · +
tk
k!
E[xk
] + · · ·
= 1 + xµ0
1 +
t2
2!
µ0
2 + · · · +
tk
k!
µ0
k + · · ·](https://image.slidesharecdn.com/rev012-170415120540/85/-148-320.jpg)
![Mx(t)
d
dtk
Mx(t) = E[xk
ext
]
t = 0
d
dtk
Mx(0) = E[xk
] = µ0
k](https://image.slidesharecdn.com/rev012-170415120540/85/-149-320.jpg)
![x ⇠ N(µ, )
Mx(t) = E[ext
] =
Z 1
1
ext 1
p
2⇡ 2
exp
✓
1
2
(x µ)2
2
◆
dx
z =
x µ
x = µ + z dx = dz](https://image.slidesharecdn.com/rev012-170415120540/85/-150-320.jpg)
![Mx(t) =
Z 1
1
e(µ+ z)t 1
p
2⇡ 2
exp
✓
1
2
z2
◆
dz
= eµt
Z 1
1
1
p
2⇡
exp
✓
tz
1
2
z2
◆
dz
= eµt
Z 1
1
1
p
2⇡
exp
✓
1
2
[z2
2 tz 2
t2
+ 2
t2
]
◆
dz
= eµt
Z 1
1
1
p
2⇡
e
2t2
2 exp
✓
1
2
(z t)2
◆
dz
= eµt
e
2t2
2
Z 1
1
1
p
2⇡
exp
✓
1
2
(z t)2
◆
dz
z t = w dz = dw
Mx(t) = eµt
e
2t2
2
Z 1
1
1
p
2⇡
exp
✓
w2
2
◆
dw = eµt+
2t2
2](https://image.slidesharecdn.com/rev012-170415120540/85/-151-320.jpg)
![Var[x] = E[x2
] (E[x])2
= (µ2
+ 2
) (µ)2
= 2
Var[x] = E[(x E[x])2
]
= E[x2
2E[x]x + E[x]2
)
= E[x2
] 2E[x]2
+ E[x]2
= E[x2
] E[x]2
t = 0
E[x] = M0
x(0) = (µ + 2
· 0)eµ·0+
2·02
2 = µ
E[x2
] = M00
x (0) =
⇣
eµ·0+
2·02
2
⌘
{(µ + 2
· 0)2
+ 2
} = µ2
+ 2](https://image.slidesharecdn.com/rev012-170415120540/85/-153-320.jpg)

![xi µ
p
n
xi µ
p
n
Mxi µ
p
n
(t) = E[e
xi µ
p
n
t
]
= 1 + 2 t2
2!n
+ µ3
t3
3!n3/2
+ · · · + µk
tk
k!nk/2
+ · · ·
= 1 +
2
t2
2n
+
n
2n
=
1
2n
n n ! 0 n ! 0
= 1 +
2
t2
+ n
2n](https://image.slidesharecdn.com/rev012-170415120540/85/-157-320.jpg)
![T0
=
x1 µ
p
n
+
x2 nµ
p
n
+ · · · +
xn µ
p
n
=
nX
i=1
xi µ
p
n
MT 0 (t) = MPn
i=1
⇣
xi µ
p
n
⌘(t) = E[e
Pn
i=1
⇣
xi µ
p
n
⌘
t
]
=
nY
i=0
E[e
⇣
xi µ
p
n
⌘
t
] =
✓
1 +
1
n
2
t2
+ n
2
◆n
er
⌘ lim
n!1
⇣
1 +
r
n
⌘n
r
r
= lim
n!1
⇣
1 +
r
n
⌘n](https://image.slidesharecdn.com/rev012-170415120540/85/-158-320.jpg)
![n = 100000
sample_size = 1000
rvs_list = []
m_list = []
for i in range(n):
unif_rvs = st.uniform.rvs(4.5, size=sample_size) # 5
beta_rvs = st.beta.rvs(a=3, b=3, size=sample_size) # 0.5 β
gamma_rvs = st.gamma.rvs(a=3, size=sample_size) # 3
chi2_rvs = st.chi2.rvs(df=5, size=sample_size) #
exp_rvs = st.expon.rvs(loc=0, size=sample_size) # 1
rvs = np.array([unif_rvs, beta_rvs, gamma_rvs, chi2_rvs, exp_rvs]).flatten()
m_list.append(np.mean(rvs))
rvs_list.append(rvs)](https://image.slidesharecdn.com/rev012-170415120540/85/-160-320.jpg)
![#
n = 10000
sample_size = 1000
rvs_list = []
m_list = []
m_unif = st.uniform.rvs(4, 2, size=sample_size)
m_beta_a = st.uniform.rvs(4, 2, size=sample_size)
m_beta_b = st.uniform.rvs(4, 2, size=sample_size)
m_gamma = rd.randint(2,5,size=sample_size)
m_chi2_df = rd.randint(3,6,size=sample_size)
m_exp = st.uniform.rvs(4, 2, size=sample_size)
def gen_random_state():
return int(dt.now().timestamp() * 10**6) - 1492914610000000 + rd.randint(0, 1000000)
def create_rvs(n):
#rd.seed = int(dt.now().timestamp() * 10**6) - 1492914610000000 + rd.randint(0, 1000000)
print("[START]")
for _ in range(n):
unif_rvs = [st.uniform.rvs(m, size=1, random_state=gen_random_state()) for m in
m_unif] # 5
beta_rvs = [st.beta.rvs(a=a, b=b, size=1, random_state=gen_random_state()) for a, b
in zip(m_beta_a, m_beta_b)]# 0.5 β
gamma_rvs = [st.gamma.rvs(a=a, size=1, random_state=gen_random_state()) for a in
m_gamma] # 3
chi2_rvs = [st.chi2.rvs(df=d, size=1, random_state=gen_random_state()) for d in
m_chi2_df] #
exp_rvs = [st.expon.rvs(loc=l, size=1, random_state=gen_random_state()) for l in
m_exp] # 1
rvs = np.array([unif_rvs, beta_rvs, gamma_rvs, chi2_rvs, exp_rvs]).flatten()
l_mean.append(np.mean(rvs))
l_rvs.append(rvs)
print("[END]")](https://image.slidesharecdn.com/rev012-170415120540/85/-161-320.jpg)
![n_jobs = 20
n_each = int(n/n_jobs)
jobs = [Process(target=create_rvs, args=(n_each,)) for _ in range(n_jobs)]
manager = Manager()
l_rvs = manager.list(range(len(jobs)))
l_mean = manager.list(range(len(jobs)))
start_time = time.time()
for j in jobs:
j.start()
time.sleep(0.2)
for j in jobs:
j.join()
finish_time = time.time()
print(finish_time - start_time)
m_list = l_mean[n_jobs:]
rvs_list = np.array(l_rvs[n_jobs:])
print(rvs_list.shape)](https://image.slidesharecdn.com/rev012-170415120540/85/-162-320.jpg)
![E[(ˆ✓(X) ✓)2
]](https://image.slidesharecdn.com/rev012-170415120540/85/-167-320.jpg)
![E[(ˆ✓(X) ✓)2
]
= E[{(E[ˆ✓(X)] ✓) + (ˆ✓(X) E[ˆ✓(X)])}2
]
= E[(E[ˆ✓(X)] ✓)2
+ 2(E[ˆ✓(X)] ✓)(ˆ✓(X) E[ˆ✓(X)]) + (ˆ✓(X) E[ˆ✓(X)])2
]
= (E[ˆ✓(X)] ✓)2
+ Var[ˆ✓(X)]
E[ˆ✓(X)] ✓
E[(ˆ✓(X) ✓)2
] = Var[ˆ✓(X)]](https://image.slidesharecdn.com/rev012-170415120540/85/-168-320.jpg)
![E[¯x] =
1
n
E[T] = n ·
1
n
µ = µ
¯x
s2
=
1
n 1
nX
i=1
(xi ¯x)2](https://image.slidesharecdn.com/rev012-170415120540/85/-169-320.jpg)
![Var[ˆ✓(X)]
ˆ✓(X)](https://image.slidesharecdn.com/rev012-170415120540/85/-172-320.jpg)


![P
✓
tn 1;↵/2 5
¯x µ
s/
p
n
5 tn 1;↵/2
◆
= 1 ↵
tn 1;↵/2 tn 1;↵/2
↵/2 ↵/2
1 ↵
1 ↵
1 ↵
P
✓
¯x tn 1;↵/2
s
p
n
5 µ 5 ¯x + tn 1;↵/2
s
p
n
◆
= 1 ↵
[ tn 1;↵/2, tn 1;↵/2]
µ
1 ↵](https://image.slidesharecdn.com/rev012-170415120540/85/-189-320.jpg)
![P
✓
tn 1;↵/2 5
¯x µ
s/
p
n
5 tn 1;↵/2
◆
= 1 ↵
tn 1;↵/2 tn 1;↵/2
↵/2 ↵/2
1 ↵
1 ↵
1 ↵
P
✓
¯x tn 1;↵/2
s
p
n
5 µ 5 ¯x + tn 1;↵/2
s
p
n
◆
= 1 ↵
[ tn 1;↵/2, tn 1;↵/2]
µ
1 ↵](https://image.slidesharecdn.com/rev012-170415120540/85/-190-320.jpg)


More Related Content
What's hot (20)
Viewers also liked (7)


Similar to 数学カフェ 確率・統計・機械学習回 「速習 確率・統計」 (20)


More from Ken'ichi Matsui (20)


Recently uploaded (20)


数学カフェ 確率・統計・機械学習回 「速習 確率・統計」
- 2. Twitter
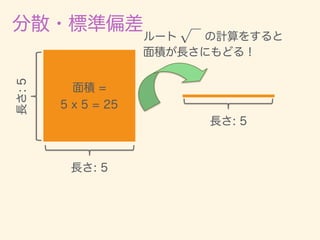
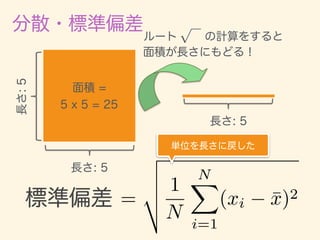
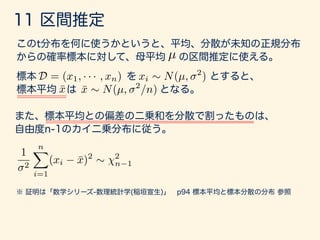
- 11. D = {x1, x2, · · · , xn} ¯x = 1 n nX i=1 xi 2 = 1 n nX i=1 (xi ¯x)2 = v u u t 1 n nX i=1 (xi ¯x)2
- 24. p
- 34. probability
- 35. ! 2 ⌦ = {!1, !2, · · · , !m} ⌦ = { , } ! 2 { , } !(1) = !(2) = !(n) =
- 36. ⌦ = {1, 2, 3, 4, 5, 6} !(1) = !(2) = !(n) = ⌦ = {!1, !2, · · · , !49870000} !(1) = !43890298 = 171cm !(2) = !29184638 = 168cm !(n) = !51398579 = 174cm
- 37. !(1) = !(2) = !(n) =!(3) = !1 !2 !3 !4 !5 !6 !7 !8 !9 !10 = {!1, !2, !3, · · · , !10} ! 2 ⌦ = {ID1, ID2, ID3, · · · , ID10}
- 38. ⌦ ! !
- 39. X = X(!) ⌦ ! ! X(!1) = 0 X(!2) = 0 X(!3) = 0 X(!4) = 0 X(!5) = 0 X(!6) = 0 X(!7) = 0 X(!8) = 0 X(!9) = 0 X(!10) = 100
- 40. ! {! 2 ⌦ : X(!) 2 A} {X 2 A} X(!) X
- 41. {! 2 ⌦ : X(!) 2 A} !1 !2 !3 !4 !5 !6 !7 !8 !9 !10 A X(!) = 100Ac X(!) = 0 !5 or !9
- 42. PX (A) = P(X 2 A) = P({! 2 ⌦ : X(!) 2 A}) ⌦ !5, !9 !5, !9 PX (A) = #({! 2 ⌦ : X(!) 2 A}) #( ) = #(!5, !9) #( ) = 2 10 = 0.2
- 43. PX(⌦) = 1 A1, A2, · · · PX ([iAi) = X i PX (Ai) A1 A2 A3 A4 A5 A6 A7 A8 A9 A10 A11 A12 0 PX(A) 1
- 45. X = X(!) ⌦ A A !1 !2 !3 !4 !5 !6 !7 !8 !11 !10 !9 !12 !13 !14 !15 !16 B C D X(!) = 0 X(!) = 0 #A = #{! 2 ⌦ : X(!) = 0} = 7 #B = #{! 2 ⌦ : X(!) = 1} = 2 #C = #{! 2 ⌦ : X(!) = 2} = 4 #D = #{! 2 ⌦ : X(!) = 3} = 3
- 46. ⌦ A A !1 !2 !3 !4 !5 !6 !7 !8 !11 !10 !9 !12 !13 !14 !15 !16 B C DX(!) = 0 P(X = 0) = PX(A) = #{! 2 ⌦ : X(!) = 0} #⌦ = 7 16 P(X = 1) = PX (B) = #{! 2 ⌦ : X(!) = 1} #⌦ = 2 16 P(X = 2) = PX(C) = #{! 2 ⌦ : X(!) = 2} #⌦ = 4 16 P(X = 3) = PX(D) = #{! 2 ⌦ : X(!) = 3} #⌦ = 3 16
- 47. {x1, x2, · · · , xk} P(X = xi) = f(xi) F(x) = P(X x)
- 48. P(x < X x + x) x + xx x x ! 0 f(x) = lim x!0 P(x < X x + x) x
- 49. x + xx f(x) F(x) = P(X x) = Z x 1 f(u)du f(a < x < b) = Z b a f(x)dx
- 52. P(X = x) = px (1 p)1 x (x = 0, 1)
- 53. # # p = 0.7 trial_size = 10000 set.seed(71) # data <- rbern(trial_size, p) # dens <- data.frame(y=c((1-p),p)*trial_size, x=c(0, 1)) # ggplot() + layer(data=data.frame(x=data), mapping=aes(x=x), geom="bar", stat="bin", bandwidth=0.1 ) + layer(data=dens, mapping=aes(x=x, y=y), geom="bar", stat="identity", width=0.05, fill="#777799", alpha=0.7)
- 55. (x = 0, 1, · · · , n)
- 57. # p = 0.7 trial_size = 10000 sample_size = 30 set.seed(71) # gen_binom_var <- function() { return(sum(rbern(sample_size, p))) } result <- rdply(trial_size, gen_binom_var()) # dens <- data.frame(y=dbinom(seq(sample_size), sample_size, 0.7))*trial_size # ggplot() + layer(data=resuylt, mapping=aes(x=V1), geom="bar", stat = "bin", binwidth=1, fill="#6666ee", color="gray" ) + layer(data=dens, mapping=aes(x=seq(sample_size)+.5, y=y), geom="line", stat="identity", position="identity",colour="red" ) + ggtitle("Bernoulli to Binomial.")
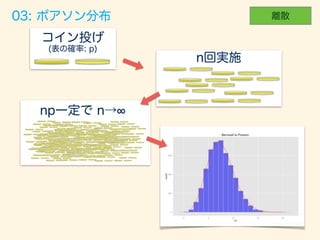
- 60. P(X = x) = e x x!
- 62. trial_size = 5000; width <- 1; # p = 0.7; n = 10; np <- p*n # n!∞ p!0 np= n = 100000; p <- np/n # gen_binom_var <- function() { return(sum(rbern(n, p))) } result <- rdply(trial_size, gen_binom_var()) # dens <- data.frame(y=dpois(seq(20), np))*trial_size # ggplot() + layer(data=result, mapping=aes(x=V1), geom="bar", stat = "bin", binwidth=width, fill="#6666ee", color="gray" ) + layer(data=dens, mapping=aes(x=seq(20)+.5, y=y), geom="line", stat="identity", position="identity", colour="red" ) + ggtitle("Bernoulli to Poisson.")
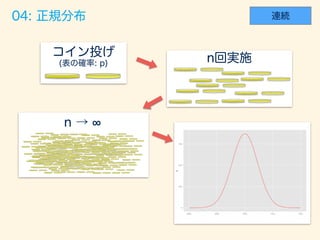
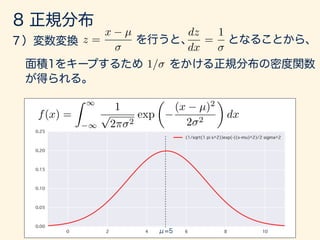
- 64. f(x) = 1 p 2⇡ 2 exp ⇢ 1 2 (x µ)2 2 ( 1 < x < 1)
- 67. # n <- 10000; p <- 0.7; trial_size = 10000 width=10 # gen_binom_var <- function() { return(sum(rbern(n, p))) } result <- rdply(trial_size, gen_binom_var()) # dens <- data.frame(y=dnorm(seq(6800,7200), mean=n*p, sd=sqrt(n*p*(1-p)))*trial_size*width) # ggplot() + layer(data=result, mapping=aes(x=V1), geom="bar", stat = "bin", binwidth=width, fill="#6666ee", color="gray" ) + layer(data=dens, mapping=aes(x=seq(6800,7200), y=y), geom="line", stat="identity", position="identity", colour="red") + ggtitle("Bernoulli to Normal.")
- 69. ( 1 < x < 1) f(x) = 1 p 2⇡ exp ⇢ 1 2 x2
- 71. # n <- 10000; p <- 0.7 trial_size = 30000 width=0.18 # gen_binom_var <- function() { return(sum(rbern(n, p))) } result <- rdply(trial_size, gen_binom_var()) m <- mean(result$V1); sd <- sd(result$V1); result <- (result - m)/sd # dens <- data.frame(y=dnorm(seq(-4,4,0.05), mean=0, sd=1)*trial_size*width) # ggplot() + layer(data=result, mapping=aes(x=V1), geom="bar", stat = "bin", binwidth=width, fill="#6666ee", color="gray" ) + layer(data=dens, mapping=aes(x=seq(-4,4,0.05), y=y), geom="line", stat="identity", position=“identity", colour="red" ) + ggtitle("Bernoulli to Standard Normal.")
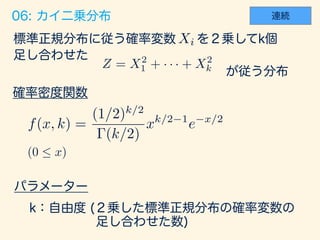
- 73. f(x, k) = (1/2)k/2 (k/2) xk/2 1 e x/2 (0 x) Xi Z = X2 1 + · · · + X2 k
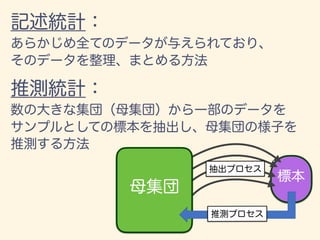
- 75. # p <- 0.7; n <- 1000; trial_size <- 100000; width <- 0.3; df <- 3 # (3 ) gen_binom_var <- function() { return(sum(rbern(n, p))) } gen_chisq_var <- function() { result <- rdply(trial_size, gen_binom_var()) return(((result$V1 - mean(result$V1))/sd(result$V1))**2) } # df result <- rlply(df, gen_chisq_var(),.progress = "text") res <- data.frame(x=result[[1]] + result[[2]] + result[[3]]) # ( =3) xx <- seq(0,20,0.1) dens <- data.frame(y=dchisq(x=xx, df=df)*trial_size*width) # ggplot() + layer(data=data, mapping=aes(x=x), geom="bar", stat = "bin", binwidth=width, fill="#6666ee", color="gray" ) + layer(data=dens, mapping=aes(x=xx, y=y), geom="line", stat="identity", position="identity", colour="blue" ) + ggtitle("Bernoulli to Chisquare")
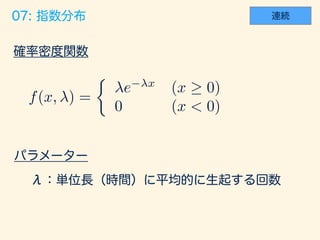
- 78. f(x, ) = ⇢ e x (x 0) 0 (x < 0)
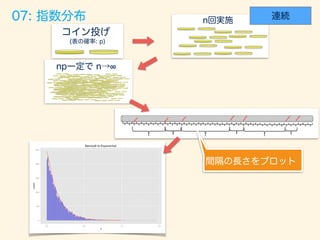
- 80. trial_size = 7000; width <- .01; # p = 0.7; n = 10; np <- p*n; # n!∞ p!0 np= n = 10000; p <- np/n # gen_exp_var <- function() { cnt <- 0 while (TRUE) { cnt <- cnt + 1 if (rbern(1, p)==1){ return(cnt) # 1 } } } data <- data.frame(x=rdply(trial_size, gen_exp_var())/n) names(data) <- c("n", "x") # dens <- data.frame(y=dexp(seq(0, 1.5, 0.1), np)*trial_size*width) ggplot() + layer(data=data, mapping=aes(x=x), geom="bar", stat = "bin", binwidth=width, fill="#6666ee", color="gray" ) + layer(data=dens, mapping=aes(x=seq(0, 1.5, 0.1), y=y), geom="line", stat="identity", position="identity", colour="red" ) + ggtitle("Bernoulli to Exponential.")
- 82. f(x, ↵, ) = ↵ (↵) x↵ 1 exp( x) (0 x < 1) ↵X i=1 Xi ⇠ (↵, )Xi ⇠ Exp( )
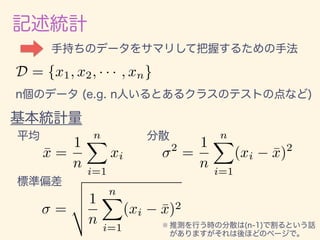
- 84. trial_size = 7000; width <- .035; # p = 0.7; n = 10; np <- p*n; # n!∞ p!0 np= n = 10000; p <- np/n; alpha <- 5 # get_interval <- function(){ cnt <- 0 while (TRUE) { cnt <- cnt + 1 if (rbern(1, p)==1){ return(cnt) } } } gen_exp_var <- function() { data <- data.frame(x=rdply(trial_size, get_interval())/n) names(data) <- c("n", "x") return(data) } result <- rlply(alpha, gen_exp_var()) data <- data.frame(x=result[[1]]$x + result[[2]]$x + result[[3]]$x + result[[4]]$x + result[[5]]$x) # dens <- data.frame(y=dgamma(seq(0, 3,.01), shape=alpha, rate=np)*trial_size*width) ggplot() + layer(data=data, mapping=aes(x=x), geom="bar", stat = "bin", binwidth=width, fill="#6666ee", color="gray" ) + layer(data=dens, mapping=aes(x=seq(0,3,.01), y=y), geom="line", stat="identity", position="identity", colour="red" ) + ggtitle("Bernoulli to Gamma")
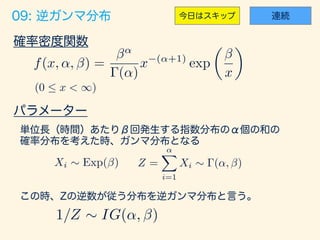
- 86. f(x, ↵, ) = ↵ (↵) x (↵+1) exp ✓ x ◆ (0 x < 1) Xi ⇠ Exp( ) Z = ↵X i=1 Xi ⇠ (↵, ) 1/Z ⇠ IG(↵, )
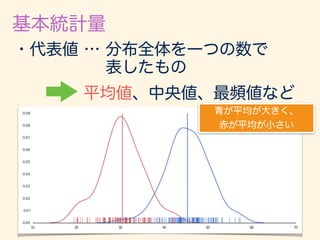
- 88. trial_size = 7000; width <- .; # p = 0.7; n = 10; np <- p*n; # n!∞ p!0 np= n = 10000; p <- np/n; alpha <- 5 # get_interval <- function(){ cnt <- 0 while (TRUE) { cnt <- cnt + 1 if (rbern(1, p)==1){ return(cnt) } } } gen_exp_var <- function() { data <- data.frame(x=rdply(trial_size, get_interval())/n) names(data) <- c("n", "x") return(data) } result <- rlply(alpha, gen_exp_var()) data <- data.frame(x=1/(result[[1]]$x + result[[2]]$x + result[[3]]$x + result[[4]]$x + result[[5]]$x)) # dens <- data.frame(y=dinvgamma(seq(0, 23,.01), shape=5, rate=1/np)*trial_size*width) ggplot() + layer(data=data, mapping=aes(x=x), geom="bar", stat = "bin", binwidth=width, fill="#6666ee", color="gray" ) + layer(data=dens, mapping=aes(x=seq(0,3,.01), y=y), geom="line", stat="identity", position="identity", colour="red" ) + ggtitle("Bernoulli to Inversegamma")
- 90. f(x) = ⇢ 1 (0 x 1) 0 (otherwise)
- 91. Z = x1(1/2)1 + x2(1/2)2 + · · · + xq(1/2)q
- 92. width <- 0.02 p <- 0.5; sample_size <- 1000 trial_size <- 100000 gen_unif_rand <- function() { # sample_size 2 # return (sum(rbern(sample_size, p) * (rep(1/2, sample_size) ** seq(sample_size)))) } gen_rand <- function(){ return( rdply(trial_size, gen_unif_rand()) ) } system.time(res <- gen_rand()) ggplot() + layer(data=res, mapping=aes(x=V1), geom="bar", stat = "bin", binwidth=width, fill="#6666ee", color="gray" ) + ggtitle("Bernoulli to Standard Uniform")
- 94. f(x, a, b) = ⇢ (b a) 1 (a x b) 0 (otherwise)
- 96. a <- 5 b <- 8; width <- 0.05 p <- 0.5 sample_size <- 1000 trial_size <- 500000 gen_unif_rand <- function() { # sample_size 2 # return (sum(rbern(sample_size, p) * (rep(1/2, sample_size) ** seq(sample_size)))) } gen_rand <- function(){ return( rdply(trial_size, gen_unif_rand()) ) } system.time(res <- gen_rand()) res$V1 <- res$V1 * (b-a) + a ggplot() + layer(data=res, mapping=aes(x=V1), geom="bar", stat = "bin", binwidth=width, fill="#6666ee", color="gray" ) + ggtitle("Bernoulli to Uniform") + xlim(4,9)
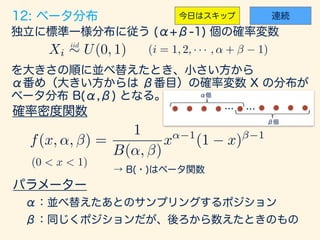
- 98. f(x, ↵, ) = 1 B(↵, ) x↵ 1 (1 x) 1 (0 < x < 1) Xi ⇠ U(0, 1)iid (i = 1, 2, · · · , ↵ + 1)
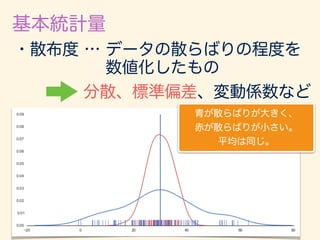
- 100. width <- 0.03; p <- 0.5 digits_length <- 30; set_size <- 3 trial_size <- 30000 gen_unif_rand <- function() { # digits_length 2 # return (sum(rbern(digits_length, p) * (rep(1/2, digits_length) ** seq(digits_length)))) } gen_rand <- function(){ return( rdply(set_size, gen_unif_rand())$V1 ) } unif_dataset <- rlply(trial_size, gen_rand, .progress='text') p <- ceiling(set_size * 0.5); q <- set_size - p + 1 get_nth_data <- function(a){ return(a[order(a)][p]) } disp_data <- data.frame(lapply(unif_dataset, get_nth_data)) names(disp_data) <- seq(length(disp_data)); disp_data <- data.frame(t(disp_data)) names(disp_data) <- "V1" x_range <- seq(0, 1, 0.001) dens <- data.frame(y=dbeta(x_range, p, q)*trial_size*width) ggplot() + layer(data=disp_data, mapping=aes(x=V1), geom="bar", stat = "bin", binwidth=width, fill="#6666ee", color="gray" ) + layer(data=dens, mapping=aes(x=x_range, y=y), geom="line", stat="identity", position="identity", colour="red" ) + ggtitle("Bernoulli to Beta")
- 102. E[X] = X( )P( ) + X( )P( ) = 0 ⇥ 0.8 + 1, 000, 000 ⇥ 0.2 = 200, 000 E[X] = X x xp(x) µ
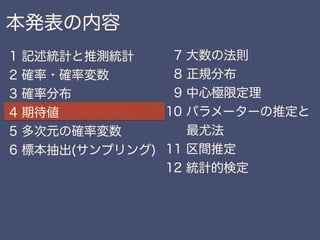
- 103. ✓ n x ◆ = n! (n x)!x! E[X] = nX x=0 xP(x) = nX x=0 x ✓ n x ◆ px (1 p)n x = nX x=0 x n! (n x)!x! px (1 p)n x = nX x=0 n (n 1)! (n x)!(x 1)! px (1 p)n x = np nX x=0 ✓ n 1 m 1 ◆ p(x 1) (1 p)(n 1) (x 1) = np = np nX x=1 ✓ n 1 m 1 ◆ p(x 1) (1 p)(n 1) (x 1) = np
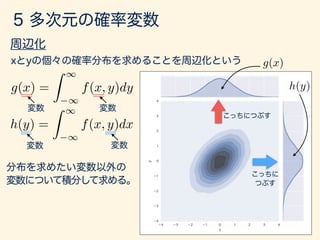
- 104. Var[X] = E[(X E[X])2 ] = X x (x E[x])2 P(x) = 2 µ
- 105. Var[x] = E[(X E[X])2 ] = Z 1 1 (x E[x])2 f(x)dx = 2 E[X] = Z 1 1 xf(x)dx = µ
- 106. E[g(X)] = Z 1 1 g(x)f(x)dx g(X) = (X E[X])2 E[ · ] = Z 1 1 · f(x)dx
- 107. g(x) = xk E[g(X)] = E[Xk ] = Z 1 1 xk f(x)dx µ0 k
- 108. g(x) = (x E[x])k E[g(X)] = E[(X E[X]])k ] = Z 1 1 (x E[x])k f(x)dx µk
- 109. E[cX] = cE[X] * E[cX] = Z 1 1 cxf(x)dx = c Z 1 1 xf(x)dx = cE[X]
- 110. Var[cX] = c2 Var[X] * Var[cX] = Z 1 1 (cx E[cx])2 f(x)dx = Z 1 1 (cx cµ)2 f(x)dx = Z 1 1 c2 (x µ)2 f(x)dx = c2 Z 1 1 (x µ)2 f(x)dx = c2 Var[X]
- 112. P(x < X 5 x + x, y < Y 5 y + y) x, y ! 0 f(x, y) = lim x, y!0 P(x < X 5 x + x, y < Y 5 y + y) f(x, y)
- 113. g(x) = Z 1 1 f(x, y)dy h(y) = Z 1 1 f(x, y)dx g(x) h(y)
- 114. EX,Y [ g(X, Y )] = Z 1 1 Z 1 1 g(x, y)f(x, y)dxdy g(x, y) = x0.8 y0.8 (x, y) ⇠ N((4, 4), S) S = 1 0.5 0.4 1 EX,Y [ g(X, Y )] = 8.02
- 115. g(X, Y ) = (X µX)(Y µY ) Cov[X, Y ] = E[(X µX)(Y µY )]
- 116. g(X, Y ) = (X µX)(Y µY ) µX µX µX µX µY µY µY µY S1 = S2 = S3 = S4 = 1 0.8 0.8 1 1 0.8 0.8 1 1 0 0 1 1 0.999 0.999 1 Cov[X, Y ] = E[(X µX)(Y µY )] (x, y) ⇠ N((4, 4), S)
- 117. f(x, y) f(x, y) = g(x)h(y)
- 118. f(x, y) = g(x)h(y) = 0
- 119. (x1, x2, · · · , xn) x1 f(x1) = Z · · · Z f(x1, · · · , xn)dx2 · · · dxn x1 f(x1, · · · , xn) = f(x1) · · · f(xn) x1 · · · xn
- 120. x1 · · · xn g1(x1), · · · , gn(xn) x1 · · · xn E[ nY i=1 gi(xi)] = nY i=1 E[gi(xi)] E[g1(x1)] E[gn(xn)] E[ nY i=1 gi(xi)] = Z 1 1 · · · Z 1 1 g1(x1) · · · gn(xn)f(x1, · · · , xn)dx1 · · · dxn = Z 1 1 g1(x1)f(x1)dx1 · · · Z 1 1 gn(xn)f(xn)dxn = nY i=1 E[gi(xi)] f(x1) · · · f(xn)
- 121. x1 · · · xn xi µi 2 i i = 1, 2, · · · , n c = (c1, · · · , cn) c1x1 + · · · + cnxn c1µ1 + · · · + cnµn c2 1 2 1 + · · · + c2 n 2 n
- 122. E[c1x1 + · · · + cnxn] = Z 1 1 · · · Z 1 1 (c1x1 + · · · + cnxn)f(x1 · · · , xn)dx1 · · · dxn = c1 Z 1 1 · · · Z 1 1 x1f(x1 · · · , xn)dx1 · · · dxn · · · cn Z 1 1 · · · Z 1 1 xnf(x1 · · · , xn)dx1 · · · dxn =c1 Z 1 1 x1dx1 · · · cn Z 1 1 xndxn =c1µ1 + · · · + cnµn f(x1) · · · f(xn) f(x1) · · · f(xn) µ1 µn =c1 Z 1 1 x1dx1 · · · cn Z 1 1 xndxn =c1µ1 + · · · + cnµn
- 123. Var[c1x1 + · · · + cnxn] = E[{(c1x1 + · · · + cnxn) E[c1x1 + · · · + cnxn]}2 ] = E[{c1(x1 µ1) + · · · + c1(x1 µ1)}2 ] = E[ nX i=1 c2 i (xi µi)2 + X i6=j cicj(xi µj)(xi µj)] = nX i=1 c2 i E[(xi µi)2 ] + X i6=j cicjE[(xi µj)(xi µj)] = c2 1 2 1 + · · · + c2 n 2 n c1µ1 + · · · + cnµn = E[xi µi]E[xj µj] = 0= 2 i
- 125. x1 · · · xn x1 · · · xn xi µ 2 (µ, 2 )
- 126. x1 · · · xn T = x1 + · · · + xn E[T] = E[x1 + · · · + xn] = E[x1] + · · · + E[xn] = nµ Var[T] = Var[x1 + · · · + xn] = Var[x1] + · · · + Var[xn] = n 2 2 1 = · · · = 2 n c1 = · · · = cn = 1 Var[c1x1 + · · · + cnxn] = c2 1 2 1 + · · · + c2 n 2 n
- 127. ¯x = 1 n nX i=1 xi = 1 n T E[¯x] = 1 n E[T] = n · 1 n µ = µ Var[¯x] = Var[ 1 n T] = 1 n2 Var[T] = 2 n µ 2
- 128. Var[¯x] = 2 n = 0.0833 500 = 0.000166 E[¯x] = 0.5
- 129. Var[¯x]
- 131. µ 2 P(|x µ| > ) 5 1 2 µ 2 1/ 2 = 1 ) P(|x µ| > ) 5 1 = 2 ) P(|x µ| > ) 5 1/4 = 3 ) P(|x µ| > ) 5 1/9
- 132. 2 = Z 1 1 (x µ)2 f(x)dx = Z I1 (x µ)2 f(x)dx + Z I2 (x µ)2 f(x)dx + Z I3 (x µ)2 f(x)dx 2 = Z I1 (x µ)2 f(x)dx + Z I3 (x µ)2 f(x)dx = Z I1 2 2 f(x)dx + Z I3 2 2 f(x)dx = 2 2 [P(x 2 I1) + P(x 2 I3)] I1 = ( 1, µ ), I2 = [µ , µ + ], I3 = (µ + , 1) = P(|x µ| > ) P(|x µ| > ) 5 1 2 )
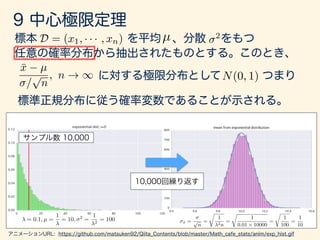
- 133. x1 · · · xn µ 2 " > 0 lim n!1 P{|¯xn µ| = "} = 0 ¯xn = 1 n nX i=1 xi ¯xn µ ¯xn ! µ in P
- 134. " > 0 P(|¯xn µ| > ") = P(|¯xn µ| > " p n p n ) 5 2 "2n = 2 ¯x= = 1 2
- 137. f(x) = 1 p 2⇡ 2 exp ✓ (x µ)2 2 2 ◆ f(x) = 1 p 2⇡ exp ✓ x2 2 ◆ 1 < x < 1 1 < x < 1
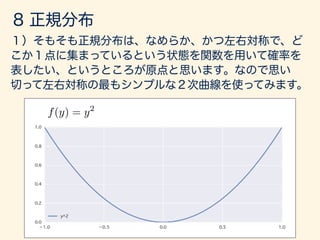
- 138. f(y) = y2
- 139. f(x) = x2 f(y) = y2
- 140. f(y) = exp( y2 )
- 141. z = p 2y f(z) = exp ✓ 1 2 z2 ◆
- 142. Z 1 1 e y2 dy = p ⇡ Z 1 1 exp ✓ z2 2 ◆ dz = p 2⇡ Z 1 1 1 p 2⇡ exp ✓ z2 2 ◆ dz = 1 dz = p 2dy
- 144. z = x µ dz dx = 1 f(x) = Z 1 1 1 p 2⇡ 2 exp ✓ (x µ)2 2 2 ◆ dx 1/
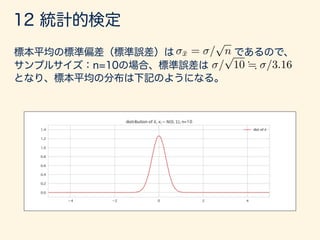
- 146. D = (x1, · · · , xn) µ 2 ¯x µ / p n , n ! 1 N(0, 1) = 0.1, µ = 1 = 10, 2 = 1 2 = 100 ¯x = p n = r 1 2n = r 1 0.01 ⇥ 10000 = r 1 100 = 1 10
- 147. g(x) = ext E[ext ] = Z 1 1 ext f(x)dx Mx(t) = E[ext ] Mx(t) My(t) x t = 0 y
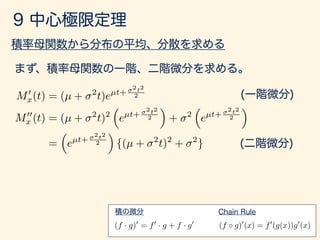
- 148. g(x) = ext ext = 1 + xt + t2 2! x2 + · · · + tk k! xk + · · · Mx(t) = E[ext ] = E[1 + xt + t2 2! x2 + · · · + tk k! xk + · · · ] = 1 + tE[x] + t2 2! E[x2 ] + · · · + tk k! E[xk ] + · · · = 1 + xµ0 1 + t2 2! µ0 2 + · · · + tk k! µ0 k + · · ·
- 149. Mx(t) d dtk Mx(t) = E[xk ext ] t = 0 d dtk Mx(0) = E[xk ] = µ0 k
- 150. x ⇠ N(µ, ) Mx(t) = E[ext ] = Z 1 1 ext 1 p 2⇡ 2 exp ✓ 1 2 (x µ)2 2 ◆ dx z = x µ x = µ + z dx = dz
- 151. Mx(t) = Z 1 1 e(µ+ z)t 1 p 2⇡ 2 exp ✓ 1 2 z2 ◆ dz = eµt Z 1 1 1 p 2⇡ exp ✓ tz 1 2 z2 ◆ dz = eµt Z 1 1 1 p 2⇡ exp ✓ 1 2 [z2 2 tz 2 t2 + 2 t2 ] ◆ dz = eµt Z 1 1 1 p 2⇡ e 2t2 2 exp ✓ 1 2 (z t)2 ◆ dz = eµt e 2t2 2 Z 1 1 1 p 2⇡ exp ✓ 1 2 (z t)2 ◆ dz z t = w dz = dw Mx(t) = eµt e 2t2 2 Z 1 1 1 p 2⇡ exp ✓ w2 2 ◆ dw = eµt+ 2t2 2
- 152. (f · g)0 = f0 · g + f · g0 (f g)0 (x) = f0 (g(x))g0 (x) M0 x(t) = (µ + 2 t)eµt+ 2t2 2 M00 x (t) = (µ + 2 t)2 ⇣ eµt+ 2t2 2 ⌘ + 2 ⇣ eµt+ 2t2 2 ⌘ = ⇣ eµt+ 2t2 2 ⌘ {(µ + 2 t)2 + 2 }
- 153. Var[x] = E[x2 ] (E[x])2 = (µ2 + 2 ) (µ)2 = 2 Var[x] = E[(x E[x])2 ] = E[x2 2E[x]x + E[x]2 ) = E[x2 ] 2E[x]2 + E[x]2 = E[x2 ] E[x]2 t = 0 E[x] = M0 x(0) = (µ + 2 · 0)eµ·0+ 2·02 2 = µ E[x2 ] = M00 x (0) = ⇣ eµ·0+ 2·02 2 ⌘ {(µ + 2 · 0)2 + 2 } = µ2 + 2
- 154. D = (x1, · · · , xn) µ 2 ¯x µ / p n , n ! 1 N(0, 1) T = x1 + · · · + xn T nµ p n 2T0 = T nµ p n = ¯x µ 1/ p n
- 155. Mx(t) My(t) x t = 0 y T T0 = T nµ p n N(0, 2 )
- 156. Mxi (t) = 1 + µ0 1t + µ0 2 t2 2! + µ0 3 t3 3! + · · · Mxi µ(t) = 1 + µ1t + µ2 t2 2! + µ3 t3 3! + · · · = 1 + 0 + 2 t2 2! + µ3 t3 3! + · · ·
- 157. xi µ p n xi µ p n Mxi µ p n (t) = E[e xi µ p n t ] = 1 + 2 t2 2!n + µ3 t3 3!n3/2 + · · · + µk tk k!nk/2 + · · · = 1 + 2 t2 2n + n 2n = 1 2n n n ! 0 n ! 0 = 1 + 2 t2 + n 2n
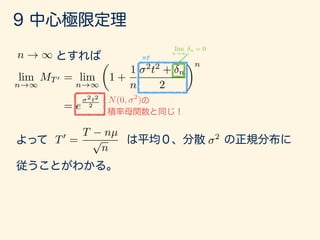
- 158. T0 = x1 µ p n + x2 nµ p n + · · · + xn µ p n = nX i=1 xi µ p n MT 0 (t) = MPn i=1 ⇣ xi µ p n ⌘(t) = E[e Pn i=1 ⇣ xi µ p n ⌘ t ] = nY i=0 E[e ⇣ xi µ p n ⌘ t ] = ✓ 1 + 1 n 2 t2 + n 2 ◆n er ⌘ lim n!1 ⇣ 1 + r n ⌘n r r = lim n!1 ⇣ 1 + r n ⌘n
- 159. n ! 1 lim n!1 MT 0 = lim n!1 ✓ 1 + 1 n 2 t2 + n 2 ◆n = e 2t2 2 lim n!1 n = 0 N(0, 2 ) T0 = T nµ p n 2
- 160. n = 100000 sample_size = 1000 rvs_list = [] m_list = [] for i in range(n): unif_rvs = st.uniform.rvs(4.5, size=sample_size) # 5 beta_rvs = st.beta.rvs(a=3, b=3, size=sample_size) # 0.5 β gamma_rvs = st.gamma.rvs(a=3, size=sample_size) # 3 chi2_rvs = st.chi2.rvs(df=5, size=sample_size) # exp_rvs = st.expon.rvs(loc=0, size=sample_size) # 1 rvs = np.array([unif_rvs, beta_rvs, gamma_rvs, chi2_rvs, exp_rvs]).flatten() m_list.append(np.mean(rvs)) rvs_list.append(rvs)
- 161. # n = 10000 sample_size = 1000 rvs_list = [] m_list = [] m_unif = st.uniform.rvs(4, 2, size=sample_size) m_beta_a = st.uniform.rvs(4, 2, size=sample_size) m_beta_b = st.uniform.rvs(4, 2, size=sample_size) m_gamma = rd.randint(2,5,size=sample_size) m_chi2_df = rd.randint(3,6,size=sample_size) m_exp = st.uniform.rvs(4, 2, size=sample_size) def gen_random_state(): return int(dt.now().timestamp() * 10**6) - 1492914610000000 + rd.randint(0, 1000000) def create_rvs(n): #rd.seed = int(dt.now().timestamp() * 10**6) - 1492914610000000 + rd.randint(0, 1000000) print("[START]") for _ in range(n): unif_rvs = [st.uniform.rvs(m, size=1, random_state=gen_random_state()) for m in m_unif] # 5 beta_rvs = [st.beta.rvs(a=a, b=b, size=1, random_state=gen_random_state()) for a, b in zip(m_beta_a, m_beta_b)]# 0.5 β gamma_rvs = [st.gamma.rvs(a=a, size=1, random_state=gen_random_state()) for a in m_gamma] # 3 chi2_rvs = [st.chi2.rvs(df=d, size=1, random_state=gen_random_state()) for d in m_chi2_df] # exp_rvs = [st.expon.rvs(loc=l, size=1, random_state=gen_random_state()) for l in m_exp] # 1 rvs = np.array([unif_rvs, beta_rvs, gamma_rvs, chi2_rvs, exp_rvs]).flatten() l_mean.append(np.mean(rvs)) l_rvs.append(rvs) print("[END]")
- 162. n_jobs = 20 n_each = int(n/n_jobs) jobs = [Process(target=create_rvs, args=(n_each,)) for _ in range(n_jobs)] manager = Manager() l_rvs = manager.list(range(len(jobs))) l_mean = manager.list(range(len(jobs))) start_time = time.time() for j in jobs: j.start() time.sleep(0.2) for j in jobs: j.join() finish_time = time.time() print(finish_time - start_time) m_list = l_mean[n_jobs:] rvs_list = np.array(l_rvs[n_jobs:]) print(rvs_list.shape)
- 164. D = (x1, · · · , xn)
- 165. ✓0 = ˆ✓(X1, · · · , Xn) ˆ✓lower(X1, · · · , Xn) 5 ✓0 5 ˆ✓upper(X1, · · · , Xn)
- 166. ˆ✓(X)
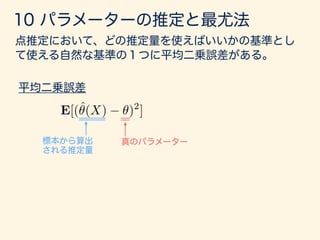
- 167. E[(ˆ✓(X) ✓)2 ]
- 168. E[(ˆ✓(X) ✓)2 ] = E[{(E[ˆ✓(X)] ✓) + (ˆ✓(X) E[ˆ✓(X)])}2 ] = E[(E[ˆ✓(X)] ✓)2 + 2(E[ˆ✓(X)] ✓)(ˆ✓(X) E[ˆ✓(X)]) + (ˆ✓(X) E[ˆ✓(X)])2 ] = (E[ˆ✓(X)] ✓)2 + Var[ˆ✓(X)] E[ˆ✓(X)] ✓ E[(ˆ✓(X) ✓)2 ] = Var[ˆ✓(X)]
- 169. E[¯x] = 1 n E[T] = n · 1 n µ = µ ¯x s2 = 1 n 1 nX i=1 (xi ¯x)2
- 171. lim n!1 P{|¯xn µ| = "} = 0 ¯xn ! µ in P ˆ✓n(X) n ! 1 ˆ✓n(X) ! ✓ in P ˆ✓n(X) ¯xn µ
- 172. Var[ˆ✓(X)] ˆ✓(X)
- 175. D = (x1, · · · , xn) xi f(xi) nY i=1 f(xi) nY i=1 f(xi|✓) xi `(✓|x1, x2, · · · , xn) = nY i=1 f(xi|✓)
- 176. x1, x2, · · · , x10 f(x1, x2, · · · , x10|µ, 2 ) = 10Y i=1 1 p 2⇡ 2 exp ✓ 1 2 (xi µ)2 2 ◆
- 177. `(µ, 2 |x1, x2, · · · , x10) = 10Y i=1 1 p 2⇡ 2 exp ✓ 1 2 (xi µ)2 2 ◆
- 179. ✓⇤ = arg max ✓ `(✓|x1, x2, · · · , xn) log `(✓|x1, · · · , xn) ⌘ L(✓|x1, · · · , xn) `
- 181. µ, 2 L(µ, 2 |x1, x2, · · · , x10) = n 2 (2⇡) n 2 log 2 1 2 2 nX i=1 (xi µ)2 @L @µ = 1 2 2 nX i=1 (xi µ)2 ) nX i=1 xi = nµ ) µ⇤ = 1 n nX i=1 xi `(µ, 2 |x1, x2, · · · , xn) = nY i=1 1 p 2⇡ 2 exp ✓ 1 2 (xi µ)2 2 ◆
- 182. @L @ 2 = n 2 1 2 + 1 2( 2)2 nX i=1 (xi µ)2 = 0 ) 1 2( 2)2 nX i=1 (xi µ)2 = n 2 2 ) 2⇤ = 1 n nX i=1 (xi µ)2 2⇤
- 184. D = (x1, · · · , xn)µ 2 µ
- 185. u ⇠ N(0, 1) t = u p v/m v ⇠ 2 (m) f(t) = m+1 2 p m⇡ m 2 ✓ t2 m + 1 ◆ m+1 2
- 186. u ⇠ N(0, 1) v ⇠ 2 (m) v > 01 < u < +1 f(u, v) = 1 p 2⇡ exp ✓ u2 2 ◆ (1/2)n/2 (n/2) vn/2 1 e v/2 t = u p v/m x = v f(t) = m+1 2 p m⇡ m 2 ✓ t2 m + 1 ◆ m+1 2 (z) = Z 1 0 tz 1 e t dt
- 187. µ D = (x1, · · · , xn) xi ⇠ N(µ, 2 ) ¯x ⇠ N(µ, 2 /n)¯x 1 2 nX i=1 (xi ¯x)2 ⇠ 2 n 1
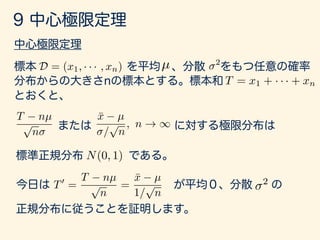
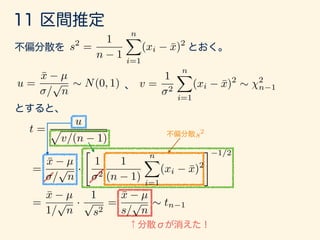
- 188. u = ¯x µ / p n ⇠ N(0, 1) v = 1 2 nX i=1 (xi ¯x)2 ⇠ 2 n 1 t = u p v/(n 1) = ¯x µ / p n · " 1 2 1 (n 1) nX i=1 (xi ¯x)2 # 1/2 = ¯x µ 1/ p n · 1 p s2 = ¯x µ s/ p n ⇠ tn 1 s2 = 1 n 1 nX i=1 (xi ¯x)2 s2
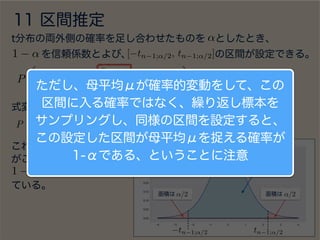
- 189. P ✓ tn 1;↵/2 5 ¯x µ s/ p n 5 tn 1;↵/2 ◆ = 1 ↵ tn 1;↵/2 tn 1;↵/2 ↵/2 ↵/2 1 ↵ 1 ↵ 1 ↵ P ✓ ¯x tn 1;↵/2 s p n 5 µ 5 ¯x + tn 1;↵/2 s p n ◆ = 1 ↵ [ tn 1;↵/2, tn 1;↵/2] µ 1 ↵
- 190. P ✓ tn 1;↵/2 5 ¯x µ s/ p n 5 tn 1;↵/2 ◆ = 1 ↵ tn 1;↵/2 tn 1;↵/2 ↵/2 ↵/2 1 ↵ 1 ↵ 1 ↵ P ✓ ¯x tn 1;↵/2 s p n 5 µ 5 ¯x + tn 1;↵/2 s p n ◆ = 1 ↵ [ tn 1;↵/2, tn 1;↵/2] µ 1 ↵
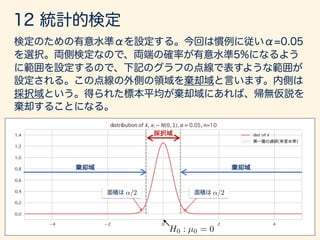
- 193. = 1 µ = 0 H0 : µ0 = 0 H1 : µ 6= µ0
- 194. ¯x = / p n / p 10 ; /3.16
- 195. ↵/2 ↵/2 H0 : µ0 = 0
- 202. H1 : µ = 1
- 203. H1 : µ = 0.5
- 204. H1 : µ = 3 µ0H1 : µ = 3 H0 : µ0 = 0
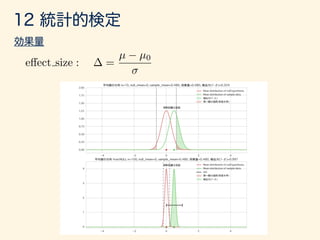
- 206. e↵ect size : = µ µ0
- 212. … … … … … … … …
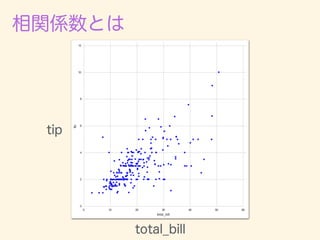
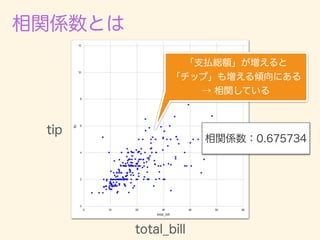
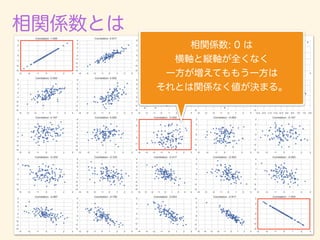
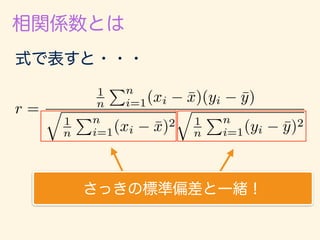
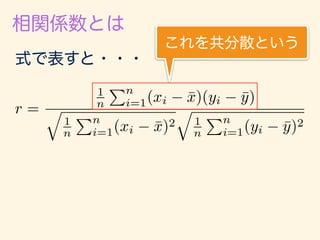
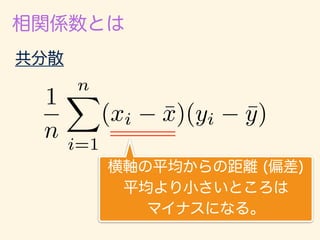
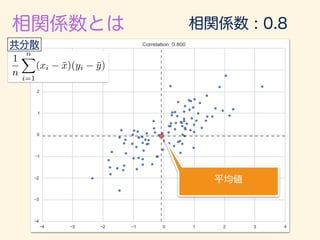
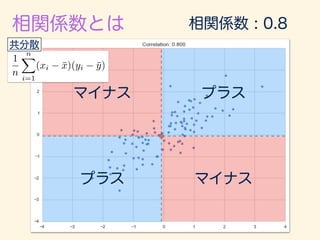
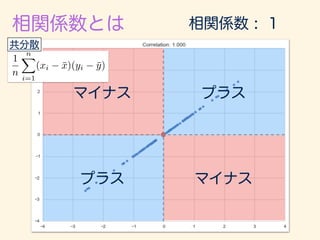
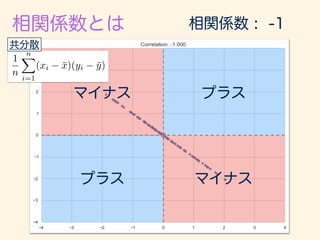
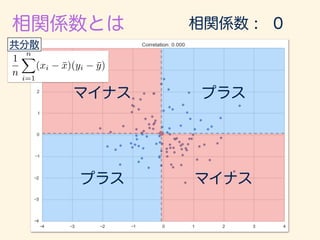
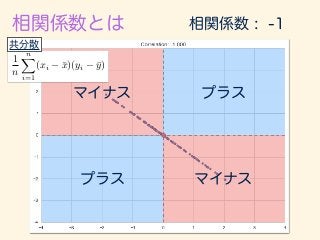
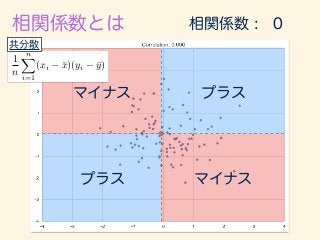
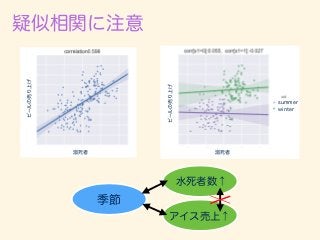
- 221. r = 1 n Pn i=1(xi ¯x)(yi ¯y) q 1 n Pn i=1(xi ¯x)2 q 1 n Pn i=1(yi ¯y)2
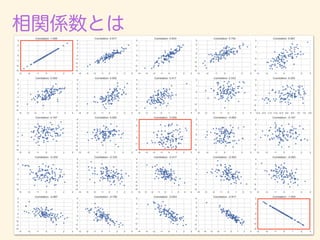
- 222. r = 1 n Pn i=1(xi ¯x)(yi ¯y) q 1 n Pn i=1(xi ¯x)2 q 1 n Pn i=1(yi ¯y)2
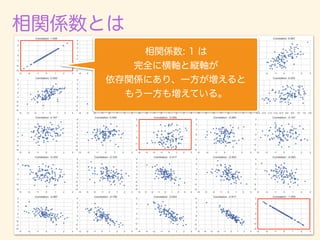
- 223. r = 1 n Pn i=1(xi ¯x)(yi ¯y) q 1 n Pn i=1(xi ¯x)2 q 1 n Pn i=1(yi ¯y)2
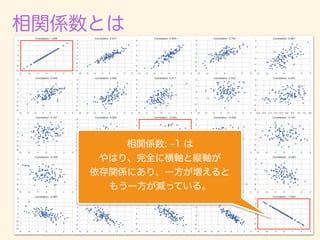
- 224. r = 1 n Pn i=1(xi ¯x)(yi ¯y) q 1 n Pn i=1(xi ¯x)2 q 1 n Pn i=1(yi ¯y)2