Python Matplotlib Tutorial | Matplotlib Tutorial | Python Tutorial | Python Training | Edureka
26 likes5,139 views

The document is a training guide about Python's data visualization using Matplotlib, covering key topics such as why data visualization is important, its definition, and various types of plots like bar graphs, histograms, scatter plots, and pie charts. It includes basic code examples to create these plots and discusses customization options for graphs. The guide aims to help users interpret data effectively through visual representations.


![www.edureka.co/pythonEDUREKA PYTHON CERTIFICATION TRAINING
Getting Started
Here's some basic code to generate one of the most simple graph.
from matplotlib import pyplot as plt
#Plotting to our canvas
plt.plot([1,2,3],[4,5,1])
#Showing what we plotted
plt.show()](https://image.slidesharecdn.com/pythonmatplotlib-edureka-170719052138/85/Python-Matplotlib-Tutorial-Matplotlib-Tutorial-Python-Tutorial-Python-Training-Edureka-13-320.jpg)
![www.edureka.co/pythonEDUREKA PYTHON CERTIFICATION TRAINING
Getting Started
Lets add title and labels to our graph
from matplotlib import pyplot as plt
x = [5,8,10]
y = [12,16,6]
plt.plot(x,y)
plt.title('Info')
plt.ylabel('Y axis')
plt.xlabel('X axis')
plt.show()
Title
Labels](https://image.slidesharecdn.com/pythonmatplotlib-edureka-170719052138/85/Python-Matplotlib-Tutorial-Matplotlib-Tutorial-Python-Tutorial-Python-Training-Edureka-14-320.jpg)
![www.edureka.co/pythonEDUREKA PYTHON CERTIFICATION TRAINING
Adding Style To Our Graph
from matplotlib import pyplot as plt
from matplotlib import style
style.use('ggplot')
x = [5,8,10]
y = [12,16,6]
x2 = [6,9,11]
y2 = [6,15,7]
plt.plot(x,y,'g',label='line one', linewidth=5)
plt.plot(x2,y2,'c',label='line two',linewidth=5)
plt.title('Epic Info')
plt.ylabel('Y axis')
plt.xlabel('X axis')
plt.legend()
plt.grid(True,color='k')
plt.show()](https://image.slidesharecdn.com/pythonmatplotlib-edureka-170719052138/85/Python-Matplotlib-Tutorial-Matplotlib-Tutorial-Python-Tutorial-Python-Training-Edureka-15-320.jpg)
![www.edureka.co/pythonEDUREKA PYTHON CERTIFICATION TRAINING
Bar Graph
import matplotlib.pyplot as plt
plt.bar([1,3,5,7,9],[5,2,7,8,2], label="Example one")
plt.bar([2,4,6,8,10],[8,6,2,5,6], label="Example two", color='g')
plt.legend()
plt.xlabel('bar number')
plt.ylabel('bar height')
plt.title('Info')
plt.show()](https://image.slidesharecdn.com/pythonmatplotlib-edureka-170719052138/85/Python-Matplotlib-Tutorial-Matplotlib-Tutorial-Python-Tutorial-Python-Training-Edureka-16-320.jpg)
![www.edureka.co/pythonEDUREKA PYTHON CERTIFICATION TRAINING
Histogram
import matplotlib.pyplot as plt
population_ages =
[22,55,62,45,21,22,34,42,42,4,99,102,110,120,121,122,130,111,115,112,80,75,6
5,54,44,43,42,48]
bins = [0,10,20,30,40,50,60,70,80,90,100,110,120,130]
plt.hist(population_ages, bins, histtype='bar', rwidth=0.8)
plt.xlabel('x')
plt.ylabel('y')
plt.title('Histogram')
plt.legend()
plt.show()](https://image.slidesharecdn.com/pythonmatplotlib-edureka-170719052138/85/Python-Matplotlib-Tutorial-Matplotlib-Tutorial-Python-Tutorial-Python-Training-Edureka-17-320.jpg)
![www.edureka.co/pythonEDUREKA PYTHON CERTIFICATION TRAINING
Scatter Plot
import matplotlib.pyplot as plt
x = [1,2,3,4,5,6,7,8]
y = [5,2,4,2,1,4,5,2]
plt.scatter(x,y, label='skitscat', color='k)
plt.xlabel('x')
plt.ylabel('y')
plt.title('Scatter Plot')
plt.legend()
plt.show()](https://image.slidesharecdn.com/pythonmatplotlib-edureka-170719052138/85/Python-Matplotlib-Tutorial-Matplotlib-Tutorial-Python-Tutorial-Python-Training-Edureka-18-320.jpg)
![www.edureka.co/pythonEDUREKA PYTHON CERTIFICATION TRAINING
Stack Plot
import matplotlib.pyplot as plt
days = [1,2,3,4,5]
sleeping = [7,8,6,11,7]
eating = [2,3,4,3,2]
working = [7,8,7,2,2]
playing = [8,5,7,8,13]
plt.plot([],[],color='m', label='Sleeping', linewidth=5)
plt.plot([],[],color='c', label='Eating', linewidth=5)
plt.plot([],[],color='r', label='Working', linewidth=5)
plt.plot([],[],color='k', label='Playing', linewidth=5)
plt.stackplot(days, sleeping,eating,working,playing, colors=['m','c','r','k'])
plt.xlabel('x')
plt.ylabel('y')
plt.title('Stck Plot')
plt.legend()
plt.show()](https://image.slidesharecdn.com/pythonmatplotlib-edureka-170719052138/85/Python-Matplotlib-Tutorial-Matplotlib-Tutorial-Python-Tutorial-Python-Training-Edureka-19-320.jpg)
![www.edureka.co/pythonEDUREKA PYTHON CERTIFICATION TRAINING
Pie Chart
import matplotlib.pyplot as plt
slices = [7,2,2,13]
activities = ['sleeping','eating','working','playing']
cols = ['c','m','r','b']
plt.pie(slices,
labels=activities,
colors=cols,
startangle=90,
shadow= True,
explode=(0,0.1,0,0),
autopct='%1.1f%%')
plt.title('Pie Plot')
plt.show()](https://image.slidesharecdn.com/pythonmatplotlib-edureka-170719052138/85/Python-Matplotlib-Tutorial-Matplotlib-Tutorial-Python-Tutorial-Python-Training-Edureka-20-320.jpg)


More Related Content


Similar to Python Matplotlib Tutorial | Matplotlib Tutorial | Python Tutorial | Python Training | Edureka (20)


Python Matplotlib Tutorial | Matplotlib Tutorial | Python Tutorial | Python Training | Edureka
- 1. www.edureka.co/pythonEDUREKA PYTHON CERTIFICATION TRAINING Python Matplotlib
- 2. www.edureka.co/pythonEDUREKA PYTHON CERTIFICATION TRAINING Agenda ➢ Why Data Visualization? ➢ What Is Data Visualization? ➢ What Is Matplotlib? ➢ Types Of Plots ➢ Getting Started
- 3. www.edureka.co/pythonEDUREKA PYTHON CERTIFICATION TRAINING Why Data Visualization?
- 4. www.edureka.co/pythonEDUREKA PYTHON CERTIFICATION TRAINING Why Data Visualization? Human brain can process information easily when it is in pictorial or graphical form
- 5. www.edureka.co/pythonEDUREKA PYTHON CERTIFICATION TRAINING Why Data Visualization? Data visualization allows us to quickly interpret the data and adjust different variables to see their effect
- 6. www.edureka.co/pythonEDUREKA PYTHON CERTIFICATION TRAINING What Is Data Visualization?
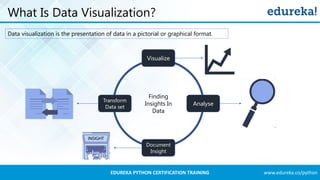
- 7. www.edureka.co/pythonEDUREKA PYTHON CERTIFICATION TRAINING What Is Data Visualization? Data visualization is the presentation of data in a pictorial or graphical format. Visualize Analyse Document Insight Transform Data set Finding Insights In Data
- 8. www.edureka.co/pythonEDUREKA PYTHON CERTIFICATION TRAINING What Is Matplotlib?
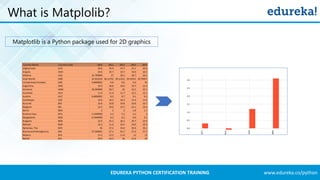
- 9. www.edureka.co/pythonEDUREKA PYTHON CERTIFICATION TRAINING What is Matplolib? Matplotlib is a Python package used for 2D graphics
- 10. www.edureka.co/pythonEDUREKA PYTHON CERTIFICATION TRAINING Types Of Plots
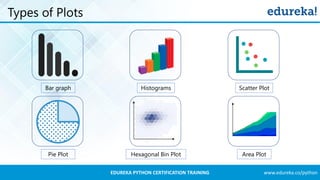
- 11. www.edureka.co/pythonEDUREKA PYTHON CERTIFICATION TRAINING Types of Plots Bar graph Histograms Scatter Plot Pie Plot Hexagonal Bin Plot Area Plot
- 12. www.edureka.co/pythonEDUREKA PYTHON CERTIFICATION TRAINING Getting Started
- 13. www.edureka.co/pythonEDUREKA PYTHON CERTIFICATION TRAINING Getting Started Here's some basic code to generate one of the most simple graph. from matplotlib import pyplot as plt #Plotting to our canvas plt.plot([1,2,3],[4,5,1]) #Showing what we plotted plt.show()
- 14. www.edureka.co/pythonEDUREKA PYTHON CERTIFICATION TRAINING Getting Started Lets add title and labels to our graph from matplotlib import pyplot as plt x = [5,8,10] y = [12,16,6] plt.plot(x,y) plt.title('Info') plt.ylabel('Y axis') plt.xlabel('X axis') plt.show() Title Labels
- 15. www.edureka.co/pythonEDUREKA PYTHON CERTIFICATION TRAINING Adding Style To Our Graph from matplotlib import pyplot as plt from matplotlib import style style.use('ggplot') x = [5,8,10] y = [12,16,6] x2 = [6,9,11] y2 = [6,15,7] plt.plot(x,y,'g',label='line one', linewidth=5) plt.plot(x2,y2,'c',label='line two',linewidth=5) plt.title('Epic Info') plt.ylabel('Y axis') plt.xlabel('X axis') plt.legend() plt.grid(True,color='k') plt.show()
- 16. www.edureka.co/pythonEDUREKA PYTHON CERTIFICATION TRAINING Bar Graph import matplotlib.pyplot as plt plt.bar([1,3,5,7,9],[5,2,7,8,2], label="Example one") plt.bar([2,4,6,8,10],[8,6,2,5,6], label="Example two", color='g') plt.legend() plt.xlabel('bar number') plt.ylabel('bar height') plt.title('Info') plt.show()
- 17. www.edureka.co/pythonEDUREKA PYTHON CERTIFICATION TRAINING Histogram import matplotlib.pyplot as plt population_ages = [22,55,62,45,21,22,34,42,42,4,99,102,110,120,121,122,130,111,115,112,80,75,6 5,54,44,43,42,48] bins = [0,10,20,30,40,50,60,70,80,90,100,110,120,130] plt.hist(population_ages, bins, histtype='bar', rwidth=0.8) plt.xlabel('x') plt.ylabel('y') plt.title('Histogram') plt.legend() plt.show()
- 18. www.edureka.co/pythonEDUREKA PYTHON CERTIFICATION TRAINING Scatter Plot import matplotlib.pyplot as plt x = [1,2,3,4,5,6,7,8] y = [5,2,4,2,1,4,5,2] plt.scatter(x,y, label='skitscat', color='k) plt.xlabel('x') plt.ylabel('y') plt.title('Scatter Plot') plt.legend() plt.show()
- 19. www.edureka.co/pythonEDUREKA PYTHON CERTIFICATION TRAINING Stack Plot import matplotlib.pyplot as plt days = [1,2,3,4,5] sleeping = [7,8,6,11,7] eating = [2,3,4,3,2] working = [7,8,7,2,2] playing = [8,5,7,8,13] plt.plot([],[],color='m', label='Sleeping', linewidth=5) plt.plot([],[],color='c', label='Eating', linewidth=5) plt.plot([],[],color='r', label='Working', linewidth=5) plt.plot([],[],color='k', label='Playing', linewidth=5) plt.stackplot(days, sleeping,eating,working,playing, colors=['m','c','r','k']) plt.xlabel('x') plt.ylabel('y') plt.title('Stck Plot') plt.legend() plt.show()
- 20. www.edureka.co/pythonEDUREKA PYTHON CERTIFICATION TRAINING Pie Chart import matplotlib.pyplot as plt slices = [7,2,2,13] activities = ['sleeping','eating','working','playing'] cols = ['c','m','r','b'] plt.pie(slices, labels=activities, colors=cols, startangle=90, shadow= True, explode=(0,0.1,0,0), autopct='%1.1f%%') plt.title('Pie Plot') plt.show()
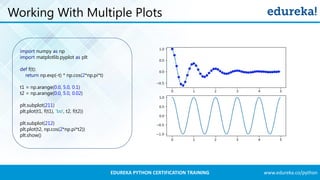
- 21. www.edureka.co/pythonEDUREKA PYTHON CERTIFICATION TRAINING Working With Multiple Plots import numpy as np import matplotlib.pyplot as plt def f(t): return np.exp(-t) * np.cos(2*np.pi*t) t1 = np.arange(0.0, 5.0, 0.1) t2 = np.arange(0.0, 5.0, 0.02) plt.subplot(211) plt.plot(t1, f(t1), 'bo', t2, f(t2)) plt.subplot(212) plt.plot(t2, np.cos(2*np.pi*t2)) plt.show()
- 22. www.edureka.co/pythonEDUREKA PYTHON CERTIFICATION TRAINING Session In A Minute Why Data Visualization? What Is Data Visualization? Types Of Plots Getting Started What Is Matplotlib? Working With Multiple Plots
- 23. www.edureka.co/pythonEDUREKA PYTHON CERTIFICATION TRAINING Thank You … Questions/Queries/Feedback