Data Science With Python | Python For Data Science | Python Data Science Course | Simplilearn
What’s in it for you?
What is Data Science?
Basics of Python for Data Analysis
Why learn Python?
How to Install Python?
Python Libraries for Data Analysis
Exploratory analysis using Pandas
Introduction to series and data frame
Loan Prediction Problem
Data Wrangling using Pandas
Building a Predictive Model using Scikit-Learn
Logistic Regression
What is Data Science?
Example
Restaurants can predict how many
customers will visit on a weekend
and plan their food inventory to
handle the demand
Service Planning
System can be trained based on
customer behavior pattern to
predict the likelihood of a
customer buying a product
Customer Prediction
Data Science is about finding and exploring data in real world, and then using that knowledge to solve
business problems
Why Python?
Let’s first understand, why we
want to use Python?
Why Python?
The usage statistics based on google trends depict that Python is currently more popular than R or SAS
for Data Science!
Why Python?
SPEED PACKAGES DESIGN GOAL
But, there are various factors you should consider before deciding which language is best for
your Data Analysis:
Why Python?
SPEED PACKAGES DESIGN GOAL
But, there are various factors you should consider before deciding which language is best for
your Data Analysis:
Why Python?
SPEED PACKAGES DESIGN GOAL
But, there are various factors you should consider before deciding which language is best for
your Data Analysis:
Why Python?
For instructor
Design Goal:
Syntax rules in python helps in building application with concise and readable code base
Packages:
There are numerous packages in Python to choose from like pandas to aggregate & manipulate data, Seaborn or
matplotlib to visualize relational data to mention a few
Speed:
Studies suggest that Python is faster than several widely used languages. Also, we can further speed up python
using algorithms and tools
Installing Python
Now, let’s install Python to
begin the fun
Installing Python
• Go to: http://continuum io/downloads
• Scroll down to download the graphical installer
suitable for your operating system
After successful installation, you can launch Jupyter notebook from Anaconda Navigator
Anaconda comes with pre-installed libraries
In this tutorial, we will be working on Jupyter notebook using Python 3
Python libraries for Data Analysis
Let’s get to know some
important Python libraries for
Data Analysis
Python libraries for Data Analysis
There are many interesting libraries that have made Python popular with Data Scientists:
Python libraries for Data Analysis
Most useful library for variety of high level science and engineering modules like discrete Fourier
transform, Linear Algebra, Optimization and Sparse matrices
Pandas for structured data operations and manipulations It is extensively
used for data munging and preparation
The most powerful feature of NumPy is n-dimensional array This library also contains basic linear algebra
functions, Fourier transforms, advanced random number capabilities
Matplotlib for plotting vast variety of graphs, starting from histograms to line plots to heat plots
contains a lot of efficient tools for machine learning and statistical modeling including classification,
regression, clustering and dimensional reduction
For instructor
Python libraries for Data Analysis
Additional libraries, you might need:
Networkx & I graph
Tensorflow
BeautifulSoup
OS
Python libraries for Data Analysis
os for Operating system and file operations
networkx and igraph for graph based data manipulations
TensorFlow
BeautifulSoup for scrapping web
For instructor
What is SciPy?
SciPy is a set of scientific and numerical tools for Python
• It currently supports special functions, integration, ordinary
differential equation (ODE) solvers, gradient optimization, and
others
• It has fully-featured versions of the linear algebra modules
• It is built on top of NumPy
What is NumPy?
NumPy is the fundamental package for scientific computing with
Python. It contains:
• Powerful N-dimensional array object
• Tools for integrating C/C++ and Fortran code
• It has useful linear algebra, Fourier transform, and random number
capabilities
What is Pandas?
• The most useful Data Analysis library in Python
• Instrumental in increasing the use of Python in Data Science
community
• It is extensively used for data munging and preparation
Pandas is used for structured data operations & manipulations
Exploratory analysis using Pandas
Let’s understand the two most common terms used in Pandas:
Series Dataframe
Exploratory analysis using Pandas
A Series is a one-dimensional object that can
hold any data type such as integers, floats
and strings
Series
A DataFrame is a two dimensional object
that can have columns with potential
different data types
DataFrame
Pandas
Exploratory analysis using Pandas
Default column
names
Default index
Default index
Series DataFrame
Exploratory analysis using Pandas
Default column
names
Default index
Default index
Series DataFrame
Exploratory analysis using Pandas
Problem Statement: Based on customer data, predict whether a particular customer’s loan
will be approved or not
LOAN
Exploratory analysis using Pandas
Now, let’s explore our data using Pandas!
Exploratory analysis using Pandas
Import the necessary libraries and read the dataset using read_csv() function:
Exploratory analysis using Pandas
You can call describe() function to describe all the columns:
Exploratory analysis using Pandas
Let’s see numercial values’ distribution
1 Loan Amount
Exploratory analysis using Pandas
2 Applicant Income
Exploratory analysis using Pandas
Categorical values’ distribution using matplotlib library:
Credit History
Exploratory analysis using Pandas
Hence, ‘loanAmount’ and ‘ApplicantIncome’ needs
Data Wrangling as some extreme values are observed!
Data Wrangling using Pandas
Before proceeding further,
let’s understand what is
Data Wrangling and why we
need it?
Data Wrangling: Process of cleaning and unifying messy
and complex data sets
It reveals more information about your data
Enables decision-making skills in the organization
Helps to gather meaningful and precise data for the business
Data Wrangling using Pandas
You can see if your data has missing values:
Data Wrangling using Pandas
And then you can replace the missing values:
Data Wrangling using Pandas
You can access the data types of each column in a DataFrame:
Data Wrangling using Pandas
You can perform basic math operations to know more about your data:
Data Wrangling using Pandas
You can combine your DataFrames:
Combining DataFrame objects can be done using simple concatenation (provided they have the same columns):
Creates an array of
specified shape and fills it
with random values using
numpy
Data Wrangling using Pandas
Also, if your DataFrame do not have an identical structure:
Data Wrangling using Pandas
You can create a merged dataframe using the merge() function based on the key:
Model Building using Scikit-learn
Now, that we have done data
wrangling, let’s build a
predictive model
Model Building using Scikit-learn
We will use Scikit-learn
module as it provides a range
of supervised and
unsupervised learning
algorithms
Model Building using Scikit-learn
Importing the required scikit-learn module:
Model Building using Scikit-learn
Extracting the variables and then splitting the data into train and test:
Model Building using Scikit-learn
In this case, we will use Logistic
Regression model
Logistic Regression is appropriate
when the dependent variable is
binary
Model Building using Scikit-learn
Fitting the data into Logistic Regression model:
Model Building using Scikit-learn
Predicting the test results:
Model Building using Scikit-learn
To describe the performance of the model let’s build the confusion matrix on test data:
Model Building using Scikit-learn
Let’s calculate ACCURACY and PRECISION from confusion matrix:
False Positive
True Positive
False Negative
True Negative
Model Building using Scikit-learn
Let’s calculate ACCURACY and PRECISION from confusion matrix:
• Accuracy
Overall, how often is the classifier correct?
(TP+TN)/total = (103+18)/150 = 0.80
• Precision
When it predicts yes, how often is it correct?
TP/predicted yes = 103/130 = 0.79
Model Building using Scikit-learn
We can also find the accuracy through Python module:
Model Building using Scikit-learn
So , we have built a model with 80% accuracy
Summary
Data Science & its popularity with python Data Analysis Libraries in python Series and dataframe in pandas
Logistic Regression using scikitData wranglingExploratory analysis
Data Science With Python | Python For Data Science | Python Data Science Course | Simplilearn

More Related Content

PPTX
Data Science Training | Data Science For Beginners | Data Science With Python...
PDF
Data Science Full Course | Edureka
PPTX
Basic of python for data analysis
PDF
Tools and techniques for data science
PDF
Scikit Learn Tutorial | Machine Learning with Python | Python for Data Scienc...
PDF
Python Programming Tutorial | Edureka
PDF
Best Python Libraries For Data Science & Machine Learning | Edureka
PDF
Introduction to Data Science
Data Science Training | Data Science For Beginners | Data Science With Python...
Data Science Full Course | Edureka
Basic of python for data analysis
Tools and techniques for data science
Scikit Learn Tutorial | Machine Learning with Python | Python for Data Scienc...
Python Programming Tutorial | Edureka
Best Python Libraries For Data Science & Machine Learning | Edureka
Introduction to Data Science

What's hot (20)

PDF
Data Science With Python
PDF
Data Science Tutorial | Introduction To Data Science | Data Science Training ...
PPTX
Introduction of Data Science
PDF
Introduction to Python for Data Science
PPTX
Introduction to Data Science
PPTX
Introduction to data science.pptx
PPTX
introduction to data science
PPTX
Data science life cycle
PPTX
PPT on Data Science Using Python
PDF
Python for Data Science | Python Data Science Tutorial | Data Science Certifi...
PDF
Python for Data Science
PDF
Introduction To Data Science
PPTX
Introduction to data science
PPTX
What Is Data Science? | Introduction to Data Science | Data Science For Begin...
PDF
Data science
PDF
Data Science vs Machine Learning – What’s The Difference? | Data Science Cour...
PDF
Data science presentation 2nd CI day
PDF
Learn Python Programming | Python Programming - Step by Step | Python for Beg...
PDF
Data Visualization in Python
PPTX
Machine learning
Data Science With Python
Data Science Tutorial | Introduction To Data Science | Data Science Training ...
Introduction of Data Science
Introduction to Python for Data Science
Introduction to Data Science
Introduction to data science.pptx
introduction to data science
Data science life cycle
PPT on Data Science Using Python
Python for Data Science | Python Data Science Tutorial | Data Science Certifi...
Python for Data Science
Introduction To Data Science
Introduction to data science
What Is Data Science? | Introduction to Data Science | Data Science For Begin...
Data science
Data Science vs Machine Learning – What’s The Difference? | Data Science Cour...
Data science presentation 2nd CI day
Learn Python Programming | Python Programming - Step by Step | Python for Beg...
Data Visualization in Python
Machine learning
Ad

Similar to Data Science With Python | Python For Data Science | Python Data Science Course | Simplilearn (20)

PDF
Python for Data Science: A Comprehensive Guide
PPTX
Python ml
PDF
Python For Data Analysis Unlocking Insightsguide Brian P
PDF
-python-for-data-science-20240911071905Ss8z.pdf
PPTX
Python for Data Analytics and ML examples
PDF
An Overview of Python for Data Analytics
PDF
Python for Data Science 1 / converted Edition Yuli Vasiliev
PDF
Python for Data Analysis Data Wrangling with Pandas NumPy and IPython Wes Mck...
PDF
Python Advanced Predictive Analytics Kumar Ashish
PPTX
Certified Python Business Analyst
PDF
Download full ebook of Mastering Pandas Femi Anthony instant download pdf
PDF
Python for Data Analysis_ Data Wrangling with Pandas, Numpy, and Ipython ( PD...
PPTX
R.SOWMIYA (30323U09086).pptx data science with python
PDF
Python For Data Analysis 3rd Wes Mckinney
PDF
2Essential-Python-Libraries-for-Data-Analytics[1].pdf
PPTX
Data Science_Unit-1.2 part - 2 of intro.pptx
PDF
Python's slippy path and Tao of thick Pandas: give my data, Rrrrr...
PDF
Data analysis from scratch with python beginner guide
PPTX
Abhishek Training PPT.pptx
PPTX
Meetup Junio Data Analysis with python 2018
Python for Data Science: A Comprehensive Guide
Python ml
Python For Data Analysis Unlocking Insightsguide Brian P
-python-for-data-science-20240911071905Ss8z.pdf
Python for Data Analytics and ML examples
An Overview of Python for Data Analytics
Python for Data Science 1 / converted Edition Yuli Vasiliev
Python for Data Analysis Data Wrangling with Pandas NumPy and IPython Wes Mck...
Python Advanced Predictive Analytics Kumar Ashish
Certified Python Business Analyst
Download full ebook of Mastering Pandas Femi Anthony instant download pdf
Python for Data Analysis_ Data Wrangling with Pandas, Numpy, and Ipython ( PD...
R.SOWMIYA (30323U09086).pptx data science with python
Python For Data Analysis 3rd Wes Mckinney
2Essential-Python-Libraries-for-Data-Analytics[1].pdf
Data Science_Unit-1.2 part - 2 of intro.pptx
Python's slippy path and Tao of thick Pandas: give my data, Rrrrr...
Data analysis from scratch with python beginner guide
Abhishek Training PPT.pptx
Meetup Junio Data Analysis with python 2018
Ad

More from Simplilearn (20)

PPTX
Top 50 Scrum Master Interview Questions | Scrum Master Interview Questions & ...
PPTX
Bagging Vs Boosting In Machine Learning | Ensemble Learning In Machine Learni...
PPTX
Future Of Social Media | Social Media Trends and Strategies 2025 | Instagram ...
PPTX
SQL Query Optimization | SQL Query Optimization Techniques | SQL Basics | SQL...
PPTX
SQL INterview Questions .pTop 45 SQL Interview Questions And Answers In 2025 ...
PPTX
How To Start Influencer Marketing Business | Influencer Marketing For Beginne...
PPTX
Cyber Security Roadmap 2025 | How To Become Cyber Security Engineer In 2025 |...
PPTX
How To Become An AI And ML Engineer In 2025 | AI Engineer Roadmap | AI ML Car...
PPTX
What Is GitHub Copilot? | How To Use GitHub Copilot? | How does GitHub Copilo...
PPTX
Top 10 Data Analyst Certification For 2025 | Best Data Analyst Certification ...
PPTX
Complete Data Science Roadmap For 2025 | Data Scientist Roadmap For Beginners...
PPTX
Top 7 High Paying AI Certifications Courses For 2025 | Best AI Certifications...
PPTX
Data Cleaning In Data Mining | Step by Step Data Cleaning Process | Data Clea...
PPTX
Top 10 Data Analyst Projects For 2025 | Data Analyst Projects | Data Analysis...
PPTX
AI Engineer Roadmap 2025 | AI Engineer Roadmap For Beginners | AI Engineer Ca...
PPTX
Machine Learning Roadmap 2025 | Machine Learning Engineer Roadmap For Beginne...
PPTX
Kotter's 8-Step Change Model Explained | Kotter's Change Management Model | S...
PPTX
Gen AI Engineer Roadmap For 2025 | How To Become Gen AI Engineer In 2025 | Si...
PPTX
Top 10 Data Analyst Certification For 2025 | Best Data Analyst Certification ...
PPTX
Complete Data Science Roadmap For 2025 | Data Scientist Roadmap For Beginners...
Top 50 Scrum Master Interview Questions | Scrum Master Interview Questions & ...
Bagging Vs Boosting In Machine Learning | Ensemble Learning In Machine Learni...
Future Of Social Media | Social Media Trends and Strategies 2025 | Instagram ...
SQL Query Optimization | SQL Query Optimization Techniques | SQL Basics | SQL...
SQL INterview Questions .pTop 45 SQL Interview Questions And Answers In 2025 ...
How To Start Influencer Marketing Business | Influencer Marketing For Beginne...
Cyber Security Roadmap 2025 | How To Become Cyber Security Engineer In 2025 |...
How To Become An AI And ML Engineer In 2025 | AI Engineer Roadmap | AI ML Car...
What Is GitHub Copilot? | How To Use GitHub Copilot? | How does GitHub Copilo...
Top 10 Data Analyst Certification For 2025 | Best Data Analyst Certification ...
Complete Data Science Roadmap For 2025 | Data Scientist Roadmap For Beginners...
Top 7 High Paying AI Certifications Courses For 2025 | Best AI Certifications...
Data Cleaning In Data Mining | Step by Step Data Cleaning Process | Data Clea...
Top 10 Data Analyst Projects For 2025 | Data Analyst Projects | Data Analysis...
AI Engineer Roadmap 2025 | AI Engineer Roadmap For Beginners | AI Engineer Ca...
Machine Learning Roadmap 2025 | Machine Learning Engineer Roadmap For Beginne...
Kotter's 8-Step Change Model Explained | Kotter's Change Management Model | S...
Gen AI Engineer Roadmap For 2025 | How To Become Gen AI Engineer In 2025 | Si...
Top 10 Data Analyst Certification For 2025 | Best Data Analyst Certification ...
Complete Data Science Roadmap For 2025 | Data Scientist Roadmap For Beginners...

Recently uploaded (20)

PPTX
PAIN PATHWAY & MANAGEMENT OF ACUTE AND CHRONIC PAIN SPEAKER: Dr. Rajasekhar ...
PPT
hsl powerpoint resource goyloveh feb 07.ppt
PDF
Jana Ojana 2025 Prelims - School Quiz by Pragya - UEMK Quiz Club
PDF
WHAT NURSES SAY_ COMMUNICATION BEHAVIORS ASSOCIATED WITH THE COMP.pdf
PPTX
ENGlishGrade8_Quarter2_WEEK1_LESSON1.pptx
PPTX
CHROMIUM & Glucose Tolerance Factor.pptx
PPTX
Key-Features-of-the-SHS-Program-v4-Slides (3) PPT2.pptx
PDF
CHALLENGES FACED BY TEACHERS WHEN TEACHING LEARNERS WITH DEVELOPMENTAL DISABI...
PPTX
pharmaceutics-1unit-1-221214121936-550b56aa.pptx
DOCX
HELMET DETECTION AND BIOMETRIC BASED VEHICLESECURITY USING MACHINE LEARNING.docx
PPTX
Cite It Right: A Compact Illustration of APA 7th Edition.pptx
PPTX
Diploma pharmaceutics notes..helps diploma students
PDF
Developing speaking skill_learning_mater.pdf
PDF
Unleashing the Potential of the Cultural and creative industries
PPTX
Single Visit Endodontics.pptx treatment in one visit
PDF
IS1343_2012...........................pdf
PPTX
principlesofmanagementsem1slides-131211060335-phpapp01 (1).ppt
PPTX
Unit1_Kumod_deeplearning.pptx DEEP LEARNING
PPTX
Theoretical for class.pptxgshdhddhdhdhgd
PDF
African Communication Research: A review
PAIN PATHWAY & MANAGEMENT OF ACUTE AND CHRONIC PAIN SPEAKER: Dr. Rajasekhar ...
hsl powerpoint resource goyloveh feb 07.ppt
Jana Ojana 2025 Prelims - School Quiz by Pragya - UEMK Quiz Club
WHAT NURSES SAY_ COMMUNICATION BEHAVIORS ASSOCIATED WITH THE COMP.pdf
ENGlishGrade8_Quarter2_WEEK1_LESSON1.pptx
CHROMIUM & Glucose Tolerance Factor.pptx
Key-Features-of-the-SHS-Program-v4-Slides (3) PPT2.pptx
CHALLENGES FACED BY TEACHERS WHEN TEACHING LEARNERS WITH DEVELOPMENTAL DISABI...
pharmaceutics-1unit-1-221214121936-550b56aa.pptx
HELMET DETECTION AND BIOMETRIC BASED VEHICLESECURITY USING MACHINE LEARNING.docx
Cite It Right: A Compact Illustration of APA 7th Edition.pptx
Diploma pharmaceutics notes..helps diploma students
Developing speaking skill_learning_mater.pdf
Unleashing the Potential of the Cultural and creative industries
Single Visit Endodontics.pptx treatment in one visit
IS1343_2012...........................pdf
principlesofmanagementsem1slides-131211060335-phpapp01 (1).ppt
Unit1_Kumod_deeplearning.pptx DEEP LEARNING
Theoretical for class.pptxgshdhddhdhdhgd
African Communication Research: A review

Data Science With Python | Python For Data Science | Python Data Science Course | Simplilearn

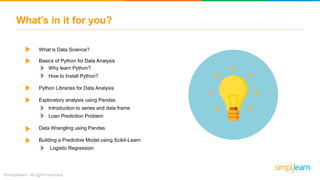
  • 2. What’s in it for you? What is Data Science? Basics of Python for Data Analysis Why learn Python? How to Install Python? Python Libraries for Data Analysis Exploratory analysis using Pandas Introduction to series and data frame Loan Prediction Problem Data Wrangling using Pandas Building a Predictive Model using Scikit-Learn Logistic Regression
  • 3. What is Data Science? Example Restaurants can predict how many customers will visit on a weekend and plan their food inventory to handle the demand Service Planning System can be trained based on customer behavior pattern to predict the likelihood of a customer buying a product Customer Prediction Data Science is about finding and exploring data in real world, and then using that knowledge to solve business problems
  • 4. Why Python? Let’s first understand, why we want to use Python?
  • 5. Why Python? The usage statistics based on google trends depict that Python is currently more popular than R or SAS for Data Science!
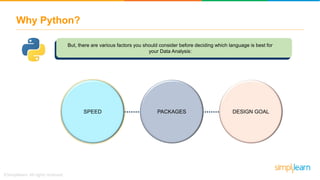
  • 6. Why Python? SPEED PACKAGES DESIGN GOAL But, there are various factors you should consider before deciding which language is best for your Data Analysis:
  • 7. Why Python? SPEED PACKAGES DESIGN GOAL But, there are various factors you should consider before deciding which language is best for your Data Analysis:
  • 8. Why Python? SPEED PACKAGES DESIGN GOAL But, there are various factors you should consider before deciding which language is best for your Data Analysis:
  • 9. Why Python? For instructor Design Goal: Syntax rules in python helps in building application with concise and readable code base Packages: There are numerous packages in Python to choose from like pandas to aggregate & manipulate data, Seaborn or matplotlib to visualize relational data to mention a few Speed: Studies suggest that Python is faster than several widely used languages. Also, we can further speed up python using algorithms and tools
  • 10. Installing Python Now, let’s install Python to begin the fun
  • 11. Installing Python • Go to: http://continuum io/downloads • Scroll down to download the graphical installer suitable for your operating system After successful installation, you can launch Jupyter notebook from Anaconda Navigator Anaconda comes with pre-installed libraries In this tutorial, we will be working on Jupyter notebook using Python 3
  • 12. Python libraries for Data Analysis Let’s get to know some important Python libraries for Data Analysis
  • 13. Python libraries for Data Analysis There are many interesting libraries that have made Python popular with Data Scientists:
  • 14. Python libraries for Data Analysis Most useful library for variety of high level science and engineering modules like discrete Fourier transform, Linear Algebra, Optimization and Sparse matrices Pandas for structured data operations and manipulations It is extensively used for data munging and preparation The most powerful feature of NumPy is n-dimensional array This library also contains basic linear algebra functions, Fourier transforms, advanced random number capabilities Matplotlib for plotting vast variety of graphs, starting from histograms to line plots to heat plots contains a lot of efficient tools for machine learning and statistical modeling including classification, regression, clustering and dimensional reduction For instructor
  • 15. Python libraries for Data Analysis Additional libraries, you might need: Networkx & I graph Tensorflow BeautifulSoup OS
  • 16. Python libraries for Data Analysis os for Operating system and file operations networkx and igraph for graph based data manipulations TensorFlow BeautifulSoup for scrapping web For instructor
  • 17. What is SciPy? SciPy is a set of scientific and numerical tools for Python • It currently supports special functions, integration, ordinary differential equation (ODE) solvers, gradient optimization, and others • It has fully-featured versions of the linear algebra modules • It is built on top of NumPy
  • 18. What is NumPy? NumPy is the fundamental package for scientific computing with Python. It contains: • Powerful N-dimensional array object • Tools for integrating C/C++ and Fortran code • It has useful linear algebra, Fourier transform, and random number capabilities
  • 19. What is Pandas? • The most useful Data Analysis library in Python • Instrumental in increasing the use of Python in Data Science community • It is extensively used for data munging and preparation Pandas is used for structured data operations & manipulations
  • 20. Exploratory analysis using Pandas Let’s understand the two most common terms used in Pandas: Series Dataframe
  • 21. Exploratory analysis using Pandas A Series is a one-dimensional object that can hold any data type such as integers, floats and strings Series A DataFrame is a two dimensional object that can have columns with potential different data types DataFrame Pandas
  • 22. Exploratory analysis using Pandas Default column names Default index Default index Series DataFrame
  • 23. Exploratory analysis using Pandas Default column names Default index Default index Series DataFrame
  • 24. Exploratory analysis using Pandas Problem Statement: Based on customer data, predict whether a particular customer’s loan will be approved or not LOAN
  • 25. Exploratory analysis using Pandas Now, let’s explore our data using Pandas!
  • 26. Exploratory analysis using Pandas Import the necessary libraries and read the dataset using read_csv() function:
  • 27. Exploratory analysis using Pandas You can call describe() function to describe all the columns:
  • 28. Exploratory analysis using Pandas Let’s see numercial values’ distribution 1 Loan Amount
  • 29. Exploratory analysis using Pandas 2 Applicant Income
  • 30. Exploratory analysis using Pandas Categorical values’ distribution using matplotlib library: Credit History
  • 31. Exploratory analysis using Pandas Hence, ‘loanAmount’ and ‘ApplicantIncome’ needs Data Wrangling as some extreme values are observed!
  • 32. Data Wrangling using Pandas Before proceeding further, let’s understand what is Data Wrangling and why we need it?
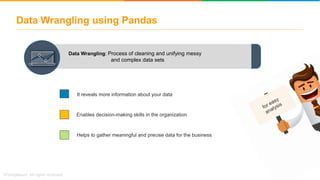
  • 33. Data Wrangling: Process of cleaning and unifying messy and complex data sets It reveals more information about your data Enables decision-making skills in the organization Helps to gather meaningful and precise data for the business Data Wrangling using Pandas
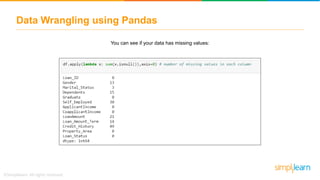
  • 34. Data Wrangling using Pandas You can see if your data has missing values:
  • 35. Data Wrangling using Pandas And then you can replace the missing values:
  • 36. Data Wrangling using Pandas You can access the data types of each column in a DataFrame:
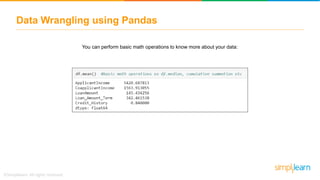
  • 37. Data Wrangling using Pandas You can perform basic math operations to know more about your data:
  • 38. Data Wrangling using Pandas You can combine your DataFrames: Combining DataFrame objects can be done using simple concatenation (provided they have the same columns): Creates an array of specified shape and fills it with random values using numpy
  • 40. Data Wrangling using Pandas Also, if your DataFrame do not have an identical structure:
  • 41. Data Wrangling using Pandas You can create a merged dataframe using the merge() function based on the key:
  • 42. Model Building using Scikit-learn Now, that we have done data wrangling, let’s build a predictive model
  • 43. Model Building using Scikit-learn We will use Scikit-learn module as it provides a range of supervised and unsupervised learning algorithms
  • 44. Model Building using Scikit-learn Importing the required scikit-learn module:
  • 45. Model Building using Scikit-learn Extracting the variables and then splitting the data into train and test:
  • 46. Model Building using Scikit-learn In this case, we will use Logistic Regression model Logistic Regression is appropriate when the dependent variable is binary
  • 47. Model Building using Scikit-learn Fitting the data into Logistic Regression model:
  • 48. Model Building using Scikit-learn Predicting the test results:
  • 49. Model Building using Scikit-learn To describe the performance of the model let’s build the confusion matrix on test data:
  • 50. Model Building using Scikit-learn Let’s calculate ACCURACY and PRECISION from confusion matrix: False Positive True Positive False Negative True Negative
  • 51. Model Building using Scikit-learn Let’s calculate ACCURACY and PRECISION from confusion matrix: • Accuracy Overall, how often is the classifier correct? (TP+TN)/total = (103+18)/150 = 0.80 • Precision When it predicts yes, how often is it correct? TP/predicted yes = 103/130 = 0.79
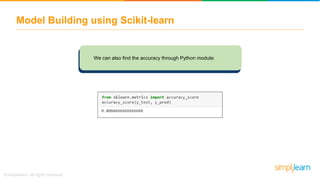
  • 52. Model Building using Scikit-learn We can also find the accuracy through Python module:
  • 53. Model Building using Scikit-learn So , we have built a model with 80% accuracy
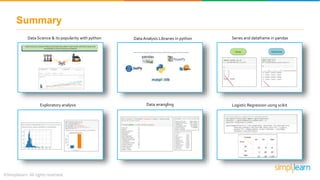
  • 54. Summary Data Science & its popularity with python Data Analysis Libraries in python Series and dataframe in pandas Logistic Regression using scikitData wranglingExploratory analysis

Editor's Notes

  • #3: Remove title case