Arctic sea ice cover retreated rapidly in July 2024, pushing the daily ice extent at the end of the month to the third lowest in the 46-year satellite record. Extensive low-concentration areas of sea ice are found in the Beaufort and East Siberian Seas, reaching 85 degrees North. In the Southern Ocean, sea ice is nearing the extreme low record extent set just last year, caused mostly by a large ice-free area in the southwestern Indian Ocean. As a result, global sea ice extent is at record lows for this time of year.
Overview of conditions
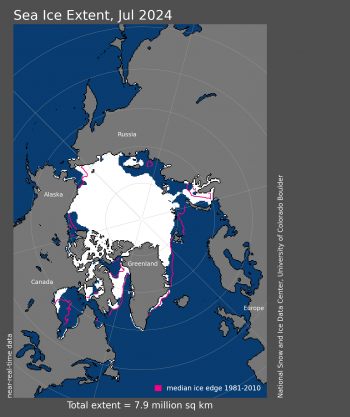
Figure 1a. Arctic sea ice extent for July 2024 was 7.89 million square kilometers (3.05 million square miles). The magenta line shows the 1981 to 2010 average extent for that month. Sea Ice Index data. About the data
Credit: National Snow and Ice Data Center
High-resolution image

Figure 1b. The graph above shows Arctic sea ice extent as of August 5, 2024, along with daily ice extent data for four previous years and the record low year. 2024 is shown in blue, 2023 in green, 2022 in orange, 2021 in brown, 2020 in magenta, and 2012 in dashed brown. The 1981 to 2010 median is in dark gray. The gray areas around the median line show the interquartile and interdecile ranges of the data. Sea Ice Index data.
Credit: National Snow and Ice Data Center
High-resolution image

Figure 1c. This image from the Japan Aerospace Exploration Agency (JAXA) Advanced Microwave Scanning Radiometer 2 (AMSR2) shows sea ice concentration in the Arctic Ocean on August 5, 2024, highlighting areas of low concentration ice stretching north from the Beaufort and East Siberian Seas, and north of Greenland.
Credit: Japan Aerospace Exploration Agency, courtesy University of Bremen
High-resolution image
Arctic sea ice extent averaged for July 2024 was 7.89 million square kilometers (3.05 million square miles), the sixth lowest in the 46-year passive microwave satellite record (Figure 1a and 1b). As of August 1, daily sea ice extent is third lowest behind 2019 and 2020, and just below 2012, the record low year. The July sea ice extent was 1.58 million square kilometers (610,000 square miles) below the 1981 to 2010 average and 600,000 square kilometers (232,000 square miles) above 2020, the record low July.
Ice loss during the month was greatest in the Kara and East Siberian Seas, Baffin Bay, Hudson Bay, and the Canadian Archipelago. Extensive low-concentration areas of sea ice are found in the Beaufort and East Siberian Seas (Figure 1c). A small patch of ice remains in western Hudson Bay, unusual for this time of year. There is still sea ice in both the northern and southern Northwest Passage routes according to passive microwave satellite data. On the Siberian side, the unusually packed area of sea ice south of Wrangel Island remains. Note that icebreakers and ice-capable liquefied natural gas (LNG) carriers routinely traverse the Northern Sea route along the Russian coast even with fairly thick sea ice.
Arctic sea ice retreat in July proceeded at a pace of 113,000 square kilometers (44,000 square miles) per day, faster than the 1981 to 2010 average pace of 87,000 square kilometers (34,000 square miles) per day and only slightly slower than the record pace of 117,000 square kilometers (45,000 square miles) per day set in 2020.
Conditions in context

Figure 2a. This plot shows the departure from the 1981 to 2010 average air temperature in the Arctic at the 925 hPa level, in degrees Celsius, for July 2024. Yellows and reds indicate above average temperatures; blues and purples indicate below average temperatures.
Credit: NSIDC courtesy NOAA Earth System Research Laboratory Physical Sciences Laboratory
High-resolution image

Figure 2b. This plot shows average sea level pressure in the Arctic in millibars for July 2024. Yellows and reds indicate high air pressure; blues and purples indicate low pressure.
Credit: NSIDC courtesy NOAA Earth System Research Laboratory Physical Sciences Laboratory
High-resolution image
Air temperatures at the 925 hPa level (approximately 2,500 feet above the surface) were near average overall, with several areas slightly below average. Relatively warm conditions prevailed over the Barents Sea with temperatures 2 to 3 degrees Celsius (4 to 5 degrees Fahrenheit) above average. In the Kara Sea, temperatures were only 1 degree Celsius (2 degrees Fahrenheit) above average. Below average temperatures persisted in a wide swath extending from the East Siberian Sea, over the Beaufort Sea, and onto the Canadian Archipelago and northern Labrador with temperatures 2 degrees Celsius (4 degrees Fahrenheit) below average.
July featured a large area of low sea level pressure centered over Greenland and the Canadian Archipelago, but covering much of the Arctic Ocean.
July 2024 compared to previous years
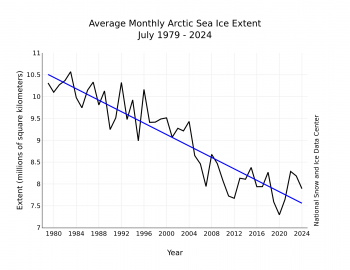
Figure 3. Monthly July ice extent for 1979 to 2024 shows a decline of 6.9 percent per decade.
Credit: National Snow and Ice Data Center
High-resolution image
Including 2024, the downward linear trend in Arctic sea ice extent for July is 66,000 square kilometers (25,000 square miles) per year, or 6.9 percent per decade relative to the 1981 to 2010 average. Based on the linear trend, since 1979, July has lost 2.95 million square kilometers (1.14 million square miles) of sea ice, which is roughly equivalent to 63,646 Olympic-sized swimming pools.
A new reconstruction of early twentieth century Arctic sea ice

Figure 4. These graphs compare three different sea ice reconstructions for March, typically the time of the sea ice maximum, on the left and September, the sea ice minimum, on the right. The three reconstructions include the Hadley Centre Global Sea Ice and Sea Surface Temperature (HadISST) 1.1 in black, Sea Ice Back to 1850 (SIBT1850) in yellow, and the Semenov et al. reconstruction in red.
Credit: Semenov et al., 2024
High-resolution image
Passive microwave sensors on satellites provide a long-term, consistent, and near-complete record of sea ice starting in late 1978. Before that, there are gaps in coverage and the data are less consistent. However, in the Arctic, earlier ice charts based on a variety of sources provide a fairly reliable record of the Arctic sea ice extent back to 1953. Before 1953, one must rely on sparse data and reconstructions. Reconstructions are derived by comparing limited observations of sea ice conditions with parameters that influence sea ice, such as air temperatures, sea surface temperatures, and sea level pressure.
A new reconstruction of Arctic sea ice back to 1901 has recently been published (Semenov et al., 2024). This new reconstruction generally compares well with other pre-satellite reconstructions: Sea Ice Back to 1850 (SIBT1850, Walsh et al., 2017) and the Hadley Centre Global Sea Ice and Sea Surface Temperature (HadISST) 1.1 (Rayner et al., 2003). However, the new data set shows more variability in the pre-1953 period. It also depicts lower September extents during the 1930s and 1940s in the western Arctic like the Beaufort and Chukchi Seas. While there are inherent uncertainties in sea ice reconstruction, results from this new approach support the conclusion that the satellite era trend in extent is outside of the range of natural variability. Nevertheless, caution is needed when interpreting these results because of sparse observations of sea surface and air temperatures.
Antarctic sea ice in 2024: Déjà vu
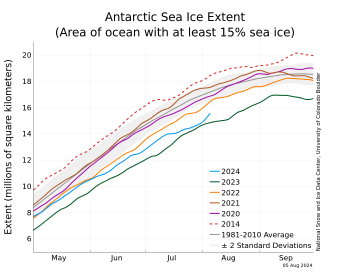
Figure 5a. The graph above shows Antarctic sea ice extent as of August 5, 2024, along with daily ice extent data for four previous years and the record 2014 high year. 2024 is shown in blue, 2023 in green, 2022 in orange, 2021 in brown, 2020 in magenta, and 2014 in dashed brown. The 1981 to 2010 median is in dark gray. The gray areas around the median line show the interquartile and interdecile ranges of the data. Sea Ice Index data.
Credit: National Snow and Ice Data Center
High-resolution image

Figure 5b. This map compares Antarctic sea ice extents between July 1, 2024 in white and July 31, 2024 in blue using the NSIDC comparison tool.
Credit: National Snow and Ice Data Center
High-resolution image
Antarctic sea ice extent in late July stood very close to the levels seen in 2023, which ended up with the lowest seasonal minimum and maximum in the satellite data record (Figure 5a). At the end of July 2024, sea ice was more than 2.1 million square kilometers (811,000 square miles) below the 1981 to 2010 average, and 190,000 square kilometers (73,000 square miles) above 2023. The July extent is particularly low in the southwestern Indian Ocean, where sea ice actually retreated during the month, despite it being mid-winter in the Southern Hemisphere (Figure 5b). This was a result of a pair of intense warm air intrusions, linked to strong high pressure near Enderby Land. Moreover, sea surface temperatures in the southwest Indian Ocean, south of South Africa, were 1 degree Celsius (2 degrees Fahrenheit) above average. Extent is near average in the Pacific Ocean sector and the Ross Sea, whereas in the western Weddell and Bellingshausen Seas, the ice is more extensive than average. Since July 31, sea ice extent has increased rapidly, with most of the growth in the easternmost Weddell Sea and the southwestern Indian Ocean sector.
Further reading
Rayner, N. A., D. E. Parker, E. B. Horton, C. K. Folland, L. V. Alexander, D. P. Rowell, E. C. Kent, and A. Kaplan. 2003. Global analyses of sea surface temperature, sea ice, and night marine air temperature since the late nineteenth century. Journal of Geophysical Research Atmospheres, 108(D14). doi:10.1029/2002JD002670.
Semenov, V. A., T. A. Aldonina, F. Li, N. S. Keenlyside, and L. Wang. 2024. Arctic sea ice variations in the first half of the 20th century: A new reconstruction based on hydrometeorological data. Advances in Atmospheric Sciences, 41(8), 1483-1495. doi:10.1007/s00376-024-3320-x.
Walsh, J. E., W. L. Chapman, F. Fetterer, and J. S. Stewart. 2019. Gridded Monthly Sea Ice Extent and Concentration, 1850 Onward, Version 2 [Data Set]. Boulder, Colorado USA. National Snow and Ice Data Center. doi:10.7265/jj4s-tq79.
Walsh, J. E., F. Fetterer, J. Scott Stewart, and W. L. Chapman. 2017. A database for depicting Arctic sea ice variations back to 1850. Geographical Review, 107(1), 89-107. doi:10.1111/j.1931-0846.2016.12195.x.


