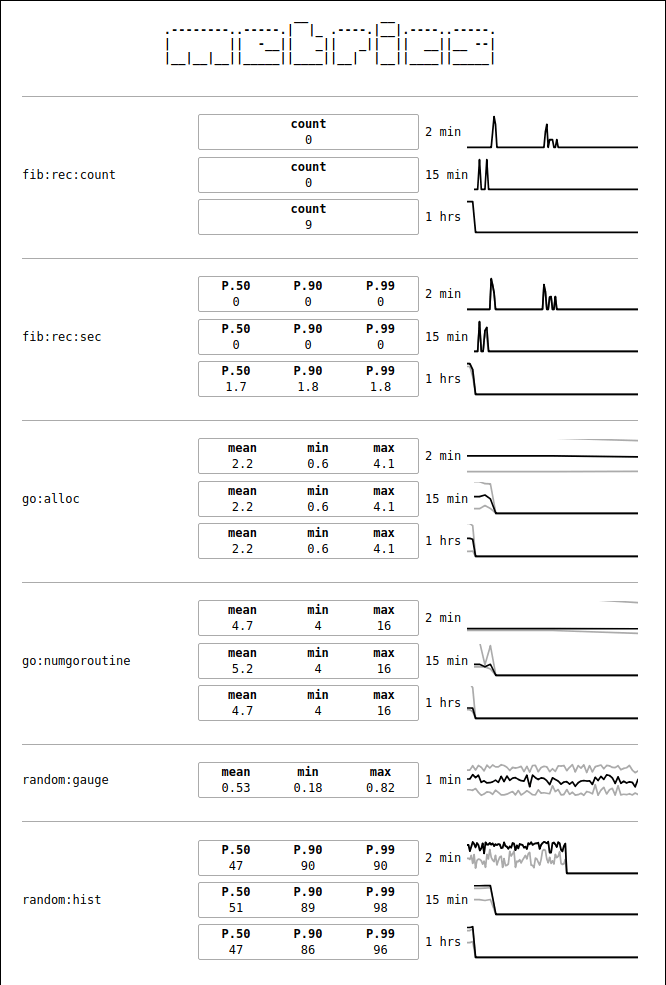
Package provides simple uniform interface for metrics such as counters, gauges and histograms. It keeps track of metrics in runtime and can be used for some basic web service instrumentation in Go, where complex tools such as Prometheus or InfluxDB are not required.
It is compatible with expvar package, that is also commonly used for monitoring.
// Create new metric. All metrics may take time frames if you want them to keep
// history. If no time frames are given the metric only keeps track of a single
// current value.
c := metric.NewCounter("15m10s") // 15 minutes of history with 10 second precision
// Increment counter
c.Add(1)
// Return JSON with all recorded counter values
c.String() // Or json.Marshal(c)

// With expvar

// Register a metric
expvar.Publish("latency", metric.NewHistogram("5m1s", "15m30s", "1h1m"))
// Register HTTP handler to visualize metrics
http.Handle("/debug/metrics", metric.Handler(metric.Exposed))

// Measure time and update the metric
start := time.Now()
...
expvar.Get("latency").(metric.Metric).Add(time.Since(start).Seconds())
Metrics are thread-safe and can be updated from background goroutines.
Nothing fancy, really, but still better than reading plain JSON. No javascript, only good old HTML, CSS and SVG.
Of course you may customize a list of metrics to show in the web UI.
If you need precise values - you may use /debug/vars HTTP endpoint provided
by expvar.
Code is distributed under MIT license, feel free to use it in your proprietary projects as well.
