


Abstract
We present NuSTAR observations of the nearby SN 2023ixf in M101 (d = 6.9 Mpc) that provide the earliest hard X-ray detection of a nonrelativistic stellar explosion to date at δt ≈ 4 days and δt ≈ 11 days. The spectra are well described by a hot thermal bremsstrahlung continuum with T > 25 keV shining through a thick neutral medium with a neutral hydrogen column that decreases with time (initial NHint = 2.6 × 1023 cm−2). A prominent neutral Fe Kα emission line is clearly detected, similar to other strongly interacting supernovae (SNe) such as SN 2010jl. The rapidly decreasing intrinsic absorption with time suggests the presence of a dense but confined circumstellar medium (CSM). The absorbed broadband X-ray luminosity (0.3–79 keV) is LX ≈ 2.5 × 1040 erg s−1 during both epochs, with the increase in overall X-ray flux related to the decrease in the absorbing column. Interpreting these observations in the context of thermal bremsstrahlung radiation originating from the interaction of the SN shock with a dense medium we infer large particle densities in excess of nCSM ≈ 4 × 108 cm−3 at r < 1015 cm, corresponding to an enhanced progenitor mass-loss rate of  M⊙ yr−1 for an assumed wind velocity of vw = 50 km s−1.
Export citation and abstract BibTeX RIS

Original content from this work may be used under the terms of the Creative Commons Attribution 4.0 licence. Any further distribution of this work must maintain attribution to the author(s) and the title of the work, journal citation and DOI.
1. Introduction
Observations of stellar explosions in the past decade have revealed the complex mass-loss history of massive stars in the centuries leading up to core collapse. The observational evidence has been accumulating from a variety of independent channels, including the direct detection of stellar outbursts before the stellar explosion, the presence of narrow spectral lines originating from the ionization of material ahead of the explosion's shock, as well as luminous UV, X-ray, and radio emission (e.g., Schlegel 1990; Filippenko 1997; Chevalier & Fransson 2006, 2017; Soderberg et al. 2006; Pastorello et al. 2007, 2008, 2013, 2018; Dwarkadas et al. 2010; Margutti et al. 2014; Ofek et al. 2014; Morozova et al. 2018, 2020; Bostroem et al. 2019; Stroh et al. 2021; Strotjohann et al. 2021; Dessart & John Hillier 2022; Jacobson-Galán et al. 2022; Perley et al. 2022). The consequent inference of highly time-dependent mass loss in evolved massive stars challenges our current understanding of massive star evolution and points to a new evolutionary path where nuclear burning instabilities and interaction with a binary companion play primary roles (e.g., Quataert & Shiode 2012; Smith 2014; Smith & Arnett 2014).
The supernova (SN) shock interaction with the circumstellar medium (CSM) is a well-known source of copious X-ray and radio emission (e.g., Chevalier & Fransson 2017). For young SNe exploding in dense media, the X-ray spectrum is expected to extend to the hard X-rays and to be dominated by thermal bremsstrahlung emission with high characteristic temperatures of T ≳ 107 K that result from fast shock velocities; vsh ≳ 104 km s−1 (e.g., Fransson et al. 1996), as was confirmed by observations of SNe 2010jl and 2014C (Margutti et al. 2017; Ofek et al. 2014). However, the hard X-ray part of an SN spectrum has been very rarely sampled so far, and only four SNe have been detected (all with NuSTAR): the H-poor, Type Ib SN 2014C (Margutti et al. 2017; Brethauer et al. 2022; Thomas et al. 2022), the H-rich Type IIn SN 2010jl (Ofek et al. 2014; Chandra et al. 2015), the Type IIP SN 2017eaw (Grefensetette et al. 2017), and the remarkable fast blue optical transient AT 2018cow (Margutti et al. 2019). Here we present NuSTAR observations of the closest core-collapse supernova in the past decade, SN 2023ixf, with the earliest detection of a nonrelativistic SN in the hard X-rays.
SN 2023ixf is a Type II supernova discovered by Koichi Itagaki in M101 (NGC 5457; Itagaki 2023). The discovery date was 2023-05-19 17:27:15 UTC, although serendipitous prediscovery data by Chinese amateur astronomers indicate the onset of the supernova at 2023-05-18T20:30 UTC (Mao et al. 2023), so we adopt the latter as T0. We use a distance to M101 of 6.90 Mpc (Riess et al. 2022). The observed optical spectrum showed significant evolution, with the early spectra (Perley et al. 2023) displaying prominent flash ionization spectral features (e.g., Gal-Yam et al. 2014) that subside by ≈10 days after the explosion.
In this Letter we describe the early NuSTAR observations along with Swift monitoring, provide an overview of our results, and discuss the implications of the hard X-ray emission and evolution.
2. Observations
After the identification of SN 2023ixf as a nearby Type II supernova, we requested a Director's Discretionary Time (DDT) target of opportunity (ToO) observation using the Nuclear Spectroscopic Telescope Array (NuSTAR; Harrison et al. 2013). NuSTAR began observing at 2023-05-22T17:56:09 (≈3.9 days) with a total exposure time of 46 ks, representing just over 1 day of elapsed time. A second epoch of DDT time was requested (starting at ≈10.5 days) following the first NuSTAR detection. Details of the NuSTAR observations are given in Table 1.
Table 1. NuSTAR Observations
| Sequence ID | Obs Start | Obs End | Exposure (ks) | δt a (days) |
|---|---|---|---|---|
| 90302004002 | 2023-05-22T17:56:09 | 2023-05-23T16:11:09 | 42 | 3.9–4.8 |
| 90302004004 | 2023-05-29T08:56:09 | 2023-05-30T07:06:09 | 42 | 10.5–11.4 |
Note.
a Age is given with respect to the onset time of 2023-05-18T20:30:00 UTC.Download table as: ASCIITypeset image
We produced high-level science products (spectra and response files) using the standard nustardas analysis tools with an extraction region of radius of 60''. A nearby region (Figure 1) was used to estimate the local backgrounds. Two X-ray sources, NGC 5457 X-19 and NGC 5457 X-20, are within the NuSTAR extraction region; however, upon examining these two sources using the latest archival Chandra observation of the galaxy (observation 19304 taken in 2017), they are both soft and contribute <1 × 10⁻¹⁴ erg cm−2 s−1 in the 3–10 keV energy band, so we do not expect them to make a significant contribution to the NuSTAR spectrum.

Figure 1. Left: Digitized Sky Survey image of M101, with the NuSTAR field of view indicated with a black dashed line, the NuSTAR contours indicated in magenta, and the optical measured position of SN 2023ixf indicated with a blue cross. Right: the NuSTAR image, with the source extraction region marked with a solid purple circle, and the nearby background region marked with a dotted–dashed circle.
Download figure:
Standard image High-resolution imageThe Neil Gehrels Swift Observatory (Gehrels et al. 2004) also observed the SN 25 times from 2023-05-20T06:24:57 to 2023-05-25T15:03:54 (sequence IDs 00016038001–12, 00016043001–2, and 00032481002–17). We used the online tool provided by the University of Leicester 4 (Evans et al. 2007, 2009) to carry out source detection and generate images, the lightcurve, and the spectrum. We do not allow centroiding of the data since this is known to fail for faint sources such as this.
3. Results
3.1. NuSTAR Spectroscopy
In both NuSTAR telescopes, a point source is clearly detected up to ≈30 keV in both epochs. This is the only source easily identified in M101 (Figure 1). The two coaligned telescopes detect the source and report offsets of 6'' and 3'' from the optical position of the supernova explosion (14:03:38.562, +54:18:41.94; Itagaki 2023). This is consistent with the SN location given the systematic errors in the NuSTAR absolute astrometry.
There is a strong evolution of the source between Epoch I and Epoch II, demonstrating that the NuSTAR emission is clearly dominated by the SN. We simultaneously fit the unbinned data from both telescopes using the W-statistic. Data are rebinned for plotting purposes below.
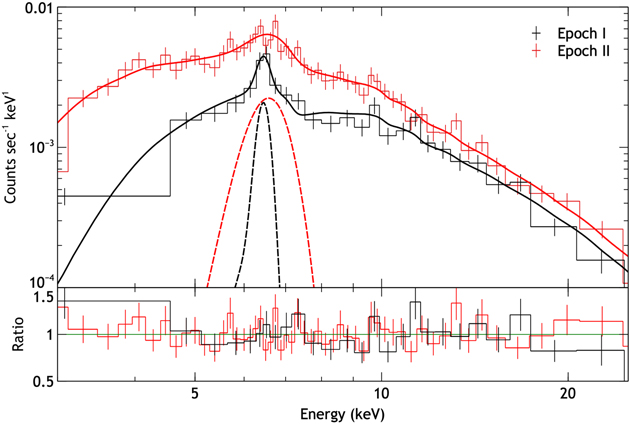
In Epoch I, the spectra for both telescopes show a clear turnover to low energies (e.g., a high absorption column) as well as a significant excess near the Fe line region around 6.4 keV. The width of the line in Epoch I is consistent with the energy resolution of the NuSTAR detectors, so we can only report an upper limit on the line width. In Epoch II, the overall source flux has increased below 10 keV, and the Fe line features have become slightly broader and shifted to higher energies (Figure 2). The change in the Fe line centroid and width may also be a blending of emission from various lines at higher ionization energies that are not resolved by NuSTAR.
Figure 2. (Top) The background-subtracted spectrum for Epoch I (δt ≈ 4 days, black) and Epoch II (δt ≈ 11 days, red) showing the best-fit model (solid lines) and the Gaussian component (dotted lines) demonstrating the spectral evolution of the source. (Bottom) Residuals to the best-fit model.
Download figure:
Standard image High-resolution image
In both epochs we adopt a spectral model that consists of an underlying bremsstrahlung spectrum with neutral absorption along the line of sight. We include an additive line component to account for reprocessing of the high-energy emission in the absorbing material and/or the presence of ionized lines in the data. For all models we use the solar abundances of Anders & Grevesse (1989).
In XSPEC, our model is tbabs(nlapec+Gauss). Here the tbabs component accounts for both Galactic absorption along this line of sight and intrinsic absorption in the source. The Galactic component is low enough 5 (8 × 1020 cm−2) that we neglect it in the discussion below. Below we adopt NHint to refer to the intrinsic absorbing material in the SN. The nlapec model is a "no-line," or continuum-only, emission from a collisionally ionized gas. We use this to approximate the bremsstrahlung continuum emission.
To estimate the uncertainties on the fit parameters we use the Markov Chain Monte Carlo (MCMC) method (emcee; Foreman-Mackey et al. 2013) as implemented in XSPEC to estimate 90% confidence intervals for all parameters. Table 2 provides the best-fit parameters and their confidence intervals.
Table 2. Spectral Fits for tbabs(nlapec+Gauss)
| Epoch | NHint a | kT (keV) | Norm b | Line (keV) | Width (keV) | Norm c | Wstat/dof |
|---|---|---|---|---|---|---|---|
| Epoch I | 26
| >25 | 1.06 ± 0.13 | 6.45 ± 0.08 | <0.2 | 6.6 ± 2 | 888/843 |
| Epoch II | 5.6 ± 2.7 |

| 1.3
| 6.57 ± 0.17 | 0.45 ± 0.2 | 14 ± 5 | 892/842 |
Note. Uncertainties indicate the 90% confidence intervals based on the MCMC run.
a 1022 atoms cm−2. b nlapec normalization [10−3]. c 10−6 ph cm−2 s−1; frozen since the line is narrower than the energy resolution of the NuSTAR detectors.Download table as: ASCIITypeset image
3.2. Swift/XRT Observations
For the Swift data, while the supernova is not detected in the full 0.3–10 keV band in a stack of the first 25 observations that span 6 days with a total exposure time of 36.6 ks, it is detected in the 2–10 keV band with a count rate of  counts s−1. We fit the stacked spectrum with our fiducial model fixing all parameters to the NuSTAR Epoch I values, using a multiplicative constant to allow for flux variability. We find an observed 0.3–10 keV flux of
  erg cm−2 s−1, ≈9 × lower than measured by NuSTAR during Epoch I, implying some X-ray flux evolution. If we limit our analysis to the six observations that occurred during the NuSTAR Epoch I observation, the observed 0.3–10 keV flux is
  erg cm−2 s−1, which is consistent with the NuSTAR Epoch I flux extrapolated into this band. Unfortunately there were no Swift/X-ray Telescope (XRT) observations that took place during NuSTAR Epoch II so we cannot repeat our analysis for that observation.
No source is listed at the position of the supernova in the Chandra Source Catalog (CSC2; Evans et al. 2010), and the sensitivity of the Chandra observations at the position of the supernova is listed by CSC2 as 8 × 10⁻¹⁶ erg cm−2 s−1 in the 0.5–8 keV band and 1.2 × 10⁻¹⁵ erg cm−2 s−1 in the 2–8 keV band, well below the NuSTAR and Swift/XRT fluxes. We examined the deepest archival Chandra image of the region, observation 934 taken in 2000 for an exposure of 98 ks, and found the background flux within 20'' of the supernova location to be ∼1.5 × 10⁻¹⁴ erg cm−2 s−1 in the 0.3–10 keV energy range. We are therefore confident that the supernova emission dominates the Swift/XRT flux during these observations.
4. Discussion
4.1. Evolution of the Supernova Emission
The early-time X-ray flux from SN 2023ixf is typical of other Type II supernovae. However, the large absorption column in Epoch I makes it difficult to compare with other supernovae that are relatively unabsorbed. To account for this, we compute an unabsorbed flux by changing the model definition to tbabs (cflux ∗ nlapec + Gauss). The cflux component measures the intrinsic flux in the underlying continuum. Table 3 provides the resulting flux in the 0.3–10 and 10–79 keV bands. For a distance of 6.9 Mpc, this results in a large intrinsic 0.3–79 keV luminosity of ∼1040 erg s−1 in both epochs.
Table 3. Computed Values
| Epoch | EM | Flux 0.3–10 keV | Lum 0.3–10 keV | Flux 10–79 keV | Lum 10–79 keV |
|---|---|---|---|---|---|
| (cm−3) | (erg cm−2 s−1) | (erg s−1) | (erg cm−2 s−1) | (erg s−1) | |
| Epoch I | 6.0 ± 0.7 × 1062 | 5.9 ± 0.3 × 10⁻¹³ | 0.34 ± 0.02 × 1040 | 3.4
| 1.9
|
| Epoch I a | ⋯ | 1.7
| 1.0
| 3.5
| 2.0
|
| Epoch II | 7.5
| 1.44 ± 0.08 ×10⁻¹² | 0.82 ± 0.05 × 1040 | 3.5 ± 0.9 × 10⁻¹² | 2 ± 0.5 × 1040 |
| Epoch II a | ⋯ | 2.5 ± 0.3 × 10⁻¹² | 1.4 ± 0.2 × 1040 | 3.5 ± 0.9 × 10⁻¹² | 2 ± 0.5 × 1040 |
Notes. Uncertainties indicate the 90% confidence intervals based on the MCMC run. Distance is assumed to be 6.9 Mpc.
a Deabsorbed values.Download table as: ASCIITypeset image
The primary difference between the two NuSTAR epochs is the dramatic reduction in the absorbing column. The intrinsic spectrum does not appear to vary much between Epoch I and Epoch II, with the luminosity in the hard (10–79 keV) band staying effectively constant. The large uncertainties in the soft band luminosity due to the poorly constrained NHint are consistent with the X-ray source emerging from behind absorbing material.
4.2. Forward Shock Velocity and Plasma Temperature
We assume that the material producing the X-rays has been heated by the shock from the supernova explosion. The temperature of the emission can be used to infer the velocity of the shock. Using the formalism of Fransson et al. (1996) as in Brethauer et al. (2022),

where μ is the mean molecular weight of the shocked medium (here assumed to be 0.61 for solar-like, ionized material with equipartition between electrons and ions). For Epoch I, the NuSTAR spectra can only place a lower limit on the electron temperature due to the limited signal to noise at high energies. In Epoch II, the NuSTAR spectra can constrain the temperature to be ≈35 keV, which corresponds to a velocity of ∼5400 km s−1. We take this as an order of magnitude estimate for the actual shock velocity, consistent with other supernova shocks.
However, we have explicitly assumed that the electrons and ions reach equipartition, which may not be correct. We measure the electron temperature Te from the spectra. The timescale for energy transfer from ions to electrons is as follows (from Equation (26) of Chevalier & Fransson 2006):

where η = 1 for H and η = 4/Z for heavier elements of charge Z;  is the Coulomb logarithm, and we have normalized the equation to the values that apply to our first NuSTAR epoch.
Based on this result, complete electron–ion (e–i) equipartition is unlikely even at the time of our first NuSTAR epoch, as te−i is comparable to the time of our first NuSTAR epoch. For the second NuSTAR epoch at δ t ≈ 11 days the density is lower and we derive te−i ≈ 8 days: complete e–i equipartition is questionable. We can reverse this argument and calculate the minimum electron temperature at a particular time and density and compare this value to our constraint. Doing so we obtain a minimum electron temperature of ≈60 keV (35 keV) at the time of our first (second) NuSTAR epoch. Our high electron temperatures are therefore consistent with typical supernova shock velocities of ∼104 km s−1 (Fransson et al. 1996).
4.3. Origin of the Early Fe Emission and the Density of the CSM
In the first epoch, the Fe line is consistent with neutral Fe Kα emission that is not broadened. This line therefore appears to be related to neutral (cold) Fe emission, rather than from shock-heated plasma. This is consistent with reprocessing of the X-ray emission in cold, circumstellar material responsible for the high absorption column. This is similar to the early neutral Fe lines observed in SN 2010jl (Chandra et al. 2012), which was associated with a clumpy circumstellar material.
To test this, we adopt a model with a power-law representation of the intrinsic spectrum absorbed by a neutral, spherically distributed medium. This model (Brightman & Nandra 2011) includes the reemission of the neutral lines self-consistently as well as the effects of Compton scattering in the surrounding medium. We find that the first epoch spectrum can be reasonably fit with the same NHint as in the baseline model.
We can use these measurements of the absorbing material to estimate the pre-supernova mass-loss rate for the star. Assuming a shock velocity of 15,000 km s−1 places the forward shock at R1 ∼ 5.7 × 1014 cm 4.4 days after the explosion and at R2 ≈ 1.4 × 1015 cm at 11 days. The fast disappearance of the the flash ionization spectral features (Stritzinger et al. 2023; Yamanaka et al. 2023) supports a dense, but confined, CSM (e.g., Yaron et al. 2017). All of the absorbing material is assumed to be local to the SN environment, an assumption supported by the rapid decrease in NHint between the two NuSTAR epochs. If all of the material is local to the SN explosion, then the measured NHint at δt ≈ 4.4 days implies  M⊙ yr−1 for an assumed vw
=50 km s−1, hydrogen-dominated chemical composition, and a wind-like density profile with
M⊙ yr−1 for an assumed vw
=50 km s−1, hydrogen-dominated chemical composition, and a wind-like density profile with  and
and .
.
An alternative estimate of the mass local to the SN environment comes from the observed decrease of neutral hydrogen absorption (ΔNH) between the two NuSTAR epochs at 4.4 and 11.0 days. This assumes that the measured ΔNH is largely a consequence of the shock plowing through the medium and emerging from the dense circumstellar material or that newly ionized material was mostly located between R1 and R2. The inferred mass-loss rate (for H-dominated composition and vw
= 50 km s)−1 is  M⊙ yr−1. For these parameters, the amount of circumstellar mass sampled by the shock during the first ∼11 d is MCSM ≈ 1.7 × 10⁻³
M⊙. The inferred particle density at R1 is ∼6 × 108 cm−3, decreasing to ∼3 × 107 cm−3 at R2.
M⊙ yr−1. For these parameters, the amount of circumstellar mass sampled by the shock during the first ∼11 d is MCSM ≈ 1.7 × 10⁻³
M⊙. The inferred particle density at R1 is ∼6 × 108 cm−3, decreasing to ∼3 × 107 cm−3 at R2.
We can also estimate of the density of the emitting region from the emission measure (EM) ≡ ∫ne ni dV, where the integral is over the X-ray emitting region, and the derived density is that of shock compressed material. For a strong shock applicable here we expect this density to be 4 times the unshocked CSM density (which is what we measured from the ΔNH above). From our broadband X-ray modeling we infer EM (4.4 days) ≈ 5.7 × 1062 cm−3 and EM (11.0 days) ≈ 7.6 × 1062 cm−3. Assuming a hydrogen composition, complete ionization (consistent with the large T measured), constant particle density in the X-ray emitting region, spherical shell-like geometry with ΔR ≈ 0.1R, the inferred preshock particle density at R1 is ∼4 × 108 cm−3, decreasing to ∼108 cm−3 at R2. This density estimate is consistent with the inferences from the ΔNH to within a factor of a few and thus supports the conclusion that the emitting region is the shocked CSM.
Kilpatrick et al. (2023) identified the stellar progenitor of SN 2023ixf as a red supergiant star (RSG) enshrouded in a dusty shell. Comparing the mass-loss rate of  M⊙ yr−1 for an assumed vw
= 50 km s−1 inferred above with those of RSGs in the Galaxy and in nearby galaxies we find that the RSG progenitor of SN 2023ixf lies in the upper end of the distribution (see, e.g., Massey et al. 2023, their Figure 1 with a compilation of data from Mauron & Josselin 2011; Beasor & Davies 2018; Beasor et al. 2020). A comparison to mass-loss rates inferred for other Type IIP SNe leads to a similar conclusion that the progenitor of SN 2023ixf experienced a large mass-loss rate in the final years before explosion (e.g., Smith 2014, their Table 1). We speculate that this might be related to the preexplosion progenitor variability reported by Kilpatrick et al. (2023). We end by noting that the inferred mass-loss rate implies an optical depth to electron scattering τes < 1 even at early times, which is not consistent with the presence of pronounced Lorentzian "wings" of the optical lines reported by Jacobson-Galan et al. (2023) if the physical origin of the wings is connected with repeated electron scattering events (e.g., Huang & Chevalier 2018; see Neustadt et al. 2023 for the alternative scenario of radiative acceleration applied to SN 2023ixf). A possible explanation for this disagreement is the deviation from spherical symmetry that can be tested with future observations of SN 2023ixf. Hints of the asymmetry in the CSM are already present in early optical spectroscopy (Smith et al. 2023).
M⊙ yr−1 for an assumed vw
= 50 km s−1 inferred above with those of RSGs in the Galaxy and in nearby galaxies we find that the RSG progenitor of SN 2023ixf lies in the upper end of the distribution (see, e.g., Massey et al. 2023, their Figure 1 with a compilation of data from Mauron & Josselin 2011; Beasor & Davies 2018; Beasor et al. 2020). A comparison to mass-loss rates inferred for other Type IIP SNe leads to a similar conclusion that the progenitor of SN 2023ixf experienced a large mass-loss rate in the final years before explosion (e.g., Smith 2014, their Table 1). We speculate that this might be related to the preexplosion progenitor variability reported by Kilpatrick et al. (2023). We end by noting that the inferred mass-loss rate implies an optical depth to electron scattering τes < 1 even at early times, which is not consistent with the presence of pronounced Lorentzian "wings" of the optical lines reported by Jacobson-Galan et al. (2023) if the physical origin of the wings is connected with repeated electron scattering events (e.g., Huang & Chevalier 2018; see Neustadt et al. 2023 for the alternative scenario of radiative acceleration applied to SN 2023ixf). A possible explanation for this disagreement is the deviation from spherical symmetry that can be tested with future observations of SN 2023ixf. Hints of the asymmetry in the CSM are already present in early optical spectroscopy (Smith et al. 2023).
4.4. Fe Emission at δ t ≈ 11 days
By the time of the second epoch, the Fe emission no longer appears to be narrow and associated with neutral Fe. However, constraining the Fe line emission is difficult with NuSTAR alone as the continuum flux has increased (while the relative flux of the Fe line has not). The fact that the Fe line flux has dropped while the overall hard X-ray flux has remained constant is further evidence that the early narrow Fe emission is due to cold material local to the SNe explosion reprocessing the high-energy photons. At late times, the amount of material along the line of sight has decreased, resulting in a comparable decrease in the equivalent width of the Fe line.
We attempted to fit the spectrum with a standard apec model (which self-consistently includes the line emission), but still saw significant residuals near the Fe line. We conclude that this is likely due to contributions both from residual narrow Fe emission from whatever residual CSM material is still present external to the forward shock as well as from line emission from ionized species in the forward shock itself.
4.5. Consistency with Early Radio Nondetections
Radio nondetections of SN 2023ixf have been reported by Berger et al. (2023), Matthews et al. (2023), and Chandra et al. (2023). The flux limits reported are as follows: Submillimeter Array (SMA): Fν < 1.5 mJy (3 rms), ν = 230 GHz, δ t ≈ 3 days (2023 May 21.17 UT; Berger et al. 2023). GMRT: Fν < 75 μJy (3 rms), ν = 1.255 GHz, δ t ≈ 4 days (2023 May 22.74 UT; Chandra et al. 2023). Very Large Array (VLA): Fν < 33 μJy (5 rms), ν = 10 GHz, δ t ≈ 4 days (2023 May 23 beginning on-source at 00:24:09 UT; Matthews et al. 2023).
If we assume the densities derived from the ΔNH above, the (external) free–free optical depth  , decreasing to below 1 at ∼20 days; τ10 GHz(4 days) ≈ 7 × 10⁴ decreasing to 1 at 150 days. Here the temperature Te
is the temperature of the electrons in the unshocked region (while the X-ray emitting electrons are in the shocked region and at a higher temperature). The 230 GHz SMA nondetection and the 10 GHz VLA nondetection are thus not surprising (e.g., Terreran et al. 2022) and consistent with the densities inferred from the X-ray modeling.
, decreasing to below 1 at ∼20 days; τ10 GHz(4 days) ≈ 7 × 10⁴ decreasing to 1 at 150 days. Here the temperature Te
is the temperature of the electrons in the unshocked region (while the X-ray emitting electrons are in the shocked region and at a higher temperature). The 230 GHz SMA nondetection and the 10 GHz VLA nondetection are thus not surprising (e.g., Terreran et al. 2022) and consistent with the densities inferred from the X-ray modeling.
5. Conclusions
We report on the first hard X-ray detections of SN 2023ixf, obtained by NuSTAR at roughly 4 and 11 days after the onset of the supernova explosion. The early X-ray spectrum is highly absorbed with neutral Fe line emission produced through reprocessing of high-energy photons in the circumstellar material. The absorbing column dropped substantially between the two NuSTAR epochs, indicating that the absorbing material is local to the supernova explosion. We infer that the CSM is confined to near the SN through the rapid disappearance of "flash ionization" optical spectral features by ≈10 days combined with the rapid decrease in the NHint between the NuSTAR epochs.
We conclude that the X-ray emission originates from the forward shock region as it interacts with the CSM. We estimate the mass-loss rate and density of the CSM to be a few 10−4 M⊙ yr−1; for typical forward shock and wind velocities, we note that at these early times the forward shock is interacting with the CSM that is only a few to 10 yr old. The densities inferred for the above mass loss imply optical depths high enough to suppress the radio emission at these early times, which is consistent with the current nondetection of the supernova in the radio. If the density profile that we infer at small radii extends to larger radii, then this SN may become radio-millimeter bright in the next few weeks to months, while a truncated density profile would lead to an earlier emergence of the radio-millimeter signal.
Acknowledgments
We thank the anonymous referee for comments and helping to clarify the results in this Letter. This work makes use of data from the NuSTAR mission, a project led by the California Institute of Technology, managed by the Jet Propulsion Laboratory, and funded by the National Aeronautics and Space Administration. We thank the NuSTAR Operations, Software and Calibration teams for support with the execution and analysis of these observations. This research has made use of the NuSTAR Data Analysis Software (NuSTARDAS) jointly developed by the ASI Science Data Center (ASDC, Italy) and the California Institute of Technology (USA). This research has made use of data and/or software provided by the High Energy Astrophysics Science Archive Research Center (HEASARC), which is a service of the Astrophysics Science Division at NASA/GSFC.
B.G., M.B., H.E., and F.H. acknowledge support under NASA Contract No. NNG08FD60C. R.M. acknowledges support by the National Science Foundation under Award Nos. AST-2221789 and AST-2224255.
Facilities: NuSTAR - The NuSTAR (Nuclear Spectroscopic Telescope Array) mission, Swift(XRT) - Swift Gamma-Ray Burst Mission.
Software: astropy (Astropy Collaboration et al. 2013, 2018,2022).
Footnotes
- 4
- 5