


Abstract
We present the 3 mm wavelength spectra of 28 local galaxy merger remnants obtained with the Large Millimeter Telescope. Sixteen molecular lines from 14 different molecular species and isotopologues were identified, and 21 out of 28 sources were detected in one or more molecular lines. On average, the line ratios of the dense gas tracers, such as HCN (1–0) and HCO+(1–0), to 13CO (1–0) are 3–4 times higher in ultra/luminous infrared galaxies (U/LIRGs) than in non-LIRGs in our sample. These high line ratios could be explained by the deficiency of 13CO and high dense gas fractions suggested by high HCN (1–0)/12CO (1–0) ratios. We calculate the IR-to-HCN (1–0) luminosity ratio as a proxy of the dense gas star formation efficiency. There is no correlation between the IR/HCN ratio and the IR luminosity, while the IR/HCN ratio varies from source to source ((1.1–6.5) × 103 L☉/(K km s−1 pc2)). Compared with the control sample, we find that the average IR/HCN ratio of the merger remnants is higher by a factor of 2–3 than those of the early/mid-stage mergers and nonmerging LIRGs, and it is comparable to that of the late-stage mergers. The IR-to-12CO (1–0) ratios show a similar trend to the IR/HCN ratios. These results suggest that star formation efficiency is enhanced by the merging process and maintained at high levels even after the final coalescence. The dynamical interactions and mergers could change the star formation mode and continue to impact the star formation properties of the gas in the postmerger phase.
Export citation and abstract BibTeX RIS
1. Introduction
Dynamical interactions and mergers between gas-rich galaxies can trigger dust-obscured starbursts, resulting in galaxies bright in infrared (IR) luminosity (U/LIRGs; 1011 L☉ ≤ LIR < 1013 L☉; Sanders & Mirabel 1996). Simulations predict that the merger-driven starburst peaks at the final coalescence and that an active galactic nucleus (AGN) is triggered in some cases (e.g., Mihos & Hernquist 1996; Hopkins et al. 2008). An increasing number of observational studies utilizing surveys have investigated how the star formation activity varies across different stages of mergers (e.g., Ellison et al. 2008; Li et al. 2008; Michiyama et al. 2016; Violino et al. 2018). By studying a sample of 58 galaxy pairs, Pan et al. (2018) found that the star formation rate (SFR) increases with decreasing separation of galaxies in pairs. In addition, by using a sample of >10,000 galaxies identified in the Sloan Digital Sky Survey, Ellison et al. (2013) revealed that the fraction of starburst galaxies peaks in the postmerger phase, where the two nuclei of the interacting galaxies have merged.
Active star formation occurs in dense regions within molecular clouds. Simulations predict that the amount of dense gas significantly increases during the merger, leading to a high fraction of dense gas (Juneau et al. 2009; Moreno et al. 2019). This is considered to be one of the main factors responsible for merger-driven starbursts. The simulated probability distribution function of gas density in a starbursting major merger strongly evolves toward high densities during the merging process due to the rapidly increased turbulence and numerous local shocks compressing the gas (Bournaud 2011). This excess should have signatures in observable molecular line ratios (e.g., HCN (1–0)/12CO (1–0)). While 12CO (1–0) (hereafter CO (1–0)) is the best tracer of diffuse molecular gas because of its low critical density (ncrit ∼ 102.5 cm−3) and relatively high abundance, other less abundant molecular species, such as HCN, HCO+ and HNC, can be the dense gas tracers. Since these molecules have larger dipole moments than CO, they require higher densities for collisional excitation. Thus, the emission from these molecules traces dense molecular gas most directly linked to star formation. This is supported by the tight linear correlation between the HCN (1–0) luminosity and the IR luminosity (e.g., Gao & Solomon 2004a; Wu et al. 2005; Shimajiri et al. 2017).
Another factor for merger-driven starbursts is an increase in the efficiency of converting gas into stars. This efficiency (star formation efficiency = SFE) of galaxies has been discussed using the ratio between SFR and the molecular gas mass ( ) or the dense molecular gas mass (Mdense). The tight correlation between the HCN and IR luminosities (Gao & Solomon 2004a) indicates that the dense gas star formation efficiency (SFEdense = SFR/Mdense) would be approximately constant for all galaxies. However, García-Burillo et al. (2012) found that the SFEdense of U/LIRGs is a few times higher than the SFEdense of normal galaxies. As their sample of U/LIRGs includes merging galaxies, the SFEdense of mergers is likely enhanced. On the other hand, Violino et al. (2018) found that the depletion time (tdep = 1/SFE) of galaxy pairs is consistent with tdep of nonmergers with similarly elevated SFRs, suggesting that galaxy interactions and mergers do not enhance the SFE. Pan et al. (2018) obtained a similar result that the SFE does not increase with decreasing separation of pair galaxies, but they also found a signature for the SFE enhancement in close pairs (separation <20 kpc) and equal-mass systems. Furthermore, the SFE and SFEdense seem to vary within a galaxy. Bemis & Wilson (2019) found that the total IR luminosity to the HCN luminosity ratio varies by up to a factor of ∼10 across different regions of the mid-stage merger NGC 4038/9. A conclusion has not been reached about how SFE and SFEdense change throughout the merging process.
We thus carried out dense gas observations toward 28 merger remnants using the Large Millimeter Telescope (LMT; Hughes et al. 2010) to characterize the properties of dense molecular gas using the line ratios and investigate the star formation properties of the gas in the final stages of mergers. Merger remnants are completely merged galaxies that still have tidal tails, shells, and loops, which indicate past dynamical interactions. In this study, we measure the HCN (1–0)/CO (1–0), IR-to-CO (1–0), and IR-to-HCN (1–0) luminosity ratios as proxies for the dense gas fraction, SFR per unit molecular gas mass, and SFR per unit dense gas mass (SFEdense), respectively. In addition, we investigate the local environments of the gas using the line ratios between the dense gas tracers (HCN/HCO+ and HNC/HCN). The HCN/HCO+ ratio is suggested as a diagnostic for cosmic rays (Meijerink et al. 2011), X-ray-dominated regions (XDRs; Meijerink & Spaans 2005), photon-dominated regions (PDR; Kazandjian et al. 2012), and mechanical heating (Loenen et al. 2008). High HCN/HCO+ line ratios can be a tracer of AGN-dominated systems (Kohno et al. 2001; Imanishi et al. 2007) because the high line ratios could be explained by an enhanced HCN abundance in XDRs surrounding an AGN. The isomer abundance ratio between HNC and HCN might serve as an indicator of a PDR and XDR (Baan et al. 2008), although this line ratio could be increased by IR radiation pumping (Aalto et al. 2007).
This paper is organized as follows. We present our sample, observational details, and data reduction process in Section 2. Then we show new results in Section 3. In Section 4, we investigate the average properties of molecular gas in the merger remnants. We discuss the line ratios between dense gas tracers, dense gas fraction, and star formation efficiency while comparing the control samples in Sections 5 and 6. We summarize this paper in Section 7. All values of our sample sources are calculated based on a ΛCDM model with H0 = 73 km s−1 Mpc−1, ΩM = 0.3, and ΩΛ = 0.7, which are the same values used in the first paper of this series (Ueda et al.2014).
2. Observations and Ancillary Data
2.1. Sample Sources
The sample used in this study is a subset of the CO imaging data of merger remnants (Ueda et al. 2014). Our sample is originally drawn from 51 optically selected merger remnants in the local (<200 Mpc) universe (Rothberg & Joseph 2004). The merger remnants were selected solely based on optical morphology that suggests an advanced merger stage, regardless of the strength of the starburst or AGN activities. Near-IR imaging shows single nuclei in all of the sample sources (Rothberg & Joseph 2004); however, radio continuum maps of NGC 3256 (Norris & Forbes 1995) reveal a double nucleus, which suggests an ongoing merger. In this study, we regard NGC 3256 as a merger remnant. The basic properties of our sample are summarized in Table 1. The exact fraction of these sources that result from a major merger as opposed to a minor merger is unknown because it is difficult to reverse the chronology and disentangle the exact mass and morphology of the progenitors. We estimated the far-IR (FIR) and IR luminosities of our sample using the Infrared Astronomical Satellite (IRAS) catalogs and the equation in Table 1 of Sanders & Mirabel (1996). The IR luminosities including the upper limits range from 1.4 × 10⁹ L☉ to 3.3 × 10¹² L☉. Two galaxies are classified as ULIRGs (1012 L☉ ≤ LIR < 1013 L☉), and 11 galaxies are classified as LIRGs (1011 L☉ ≤ LIR <1011 L☉) (see Table 1).
Table 1. Merger Remnant Subsample
| Source | R.A. | Decl. | DL | Scale | Vsys | log LFIR | log LIR | RCO | Rratio | Classification |
|---|---|---|---|---|---|---|---|---|---|---|
| (J2000) | (J2000) | (Mpc) | (pc/1'') | (km s−1) | (L☉) | (L☉) | (arcsec) | |||
| (1) | (2) | (3) | (4) | (5) | (6) | (7) | (8) | (9) | (10) | (11) |
| UGC 6 | 00 03 09 | 21 57 37 | 91.5 | 425 | 6582 | 10.91 | 11.05 | 2.94 | 1.1 ± 0.4 | LIRG |
| NGC 34 | 00 11 06 | −12 06 26 | 82.6 | 385 | 5931 | 11.41 | 11.47 | 8.06 | 4.5 ± 0.9 | LIRG |
| Arp 230 | 00 46 24 | −13 26 32 | 23.9 | 115 | 1742 | 9.57 | 9.64 | 27.7 | 2.6 ± 0.2 | ⋯ |
| NGC 828 | 02 10 09 | 39 11 25 | 74.6 | 349 | 5374 | 11.29 | 11.34 | 22.6 | 1.3 ± 0.1 | LIRG |
| UGC 2238 | 02 46 17 | 13 05 44 | 89.8 | 417 | 6436 | 11.28 | 11.32 | 20.5 | 1.2 ± 0.2 | LIRG |
| NGC 1614 | 04 33 59 | −08 34 44 | 66.1 | 311 | 4778 | 11.51 | 11.64 | 14.9 | 0.40 ± 0.08 | LIRG |
| Arp 187 | 05 04 53 | −10 14 51 | 173.8 | 778 | 12291 | 10.80 | 10.88 | 11.9 | 0.50 ± 0.05 | ⋯ |
| AM 0612-373 | 06 13 47 | −37 40 37 | 136.5 | 621 | 9734 | <10.25 | <10.74 | 8.08 | 0.19 ± 0.04 | ⋯ |
| NGC 2623 | 08 38 24 | 25 45 17 | 77.1 | 360 | 5535 | 11.53 | 11.54 | 3.03 | 0.18 ± 0.04 | LIRG |
| NGC 2782 | 09 14 05 | 40 06 49 | 35.1 | 168 | 2562 | 10.44 | 10.54 | 13.8 | 0.18 ± 0.01 | ⋯ |
| UGC 5101 | 09 35 51 | 61 21 11 | 166.8 | 749 | 11809 | 11.95 | 11.97 | 4.05 | 4.0 ± 0.8 | LIRG |
| AM 0956-282 | 09 58 46 | −28 37 19 | 13.6 | 65 | 980 | <9.12 | <9.23 | 24.9 | 0.18 ± 0.03 | ⋯ |
| NGC 3256 | 10 27 51 | −43 54 13 | 37.6 | 179 | 2738 | 11.51 | 11.59 | 36.9 | 1.7 ± 0.2 | LIRG |
| NGC 3597 | 11 14 42 | −23 43 40 | 48.5 | 230 | 3504 | 10.88 | 10.97 | 9.86 | 1.2 ± 0.1 | ⋯ |
| AM 1158-333 | 12 01 20 | −33 52 36 | 41.8 | 199 | 3027 | 9.96 | 10.04 | 5.25 | 0.48 ± 0.04 | ⋯ |
| NGC 4194 | 12 14 09 | 54 31 37 | 34.7 | 166 | 2506 | 10.81 | 10.91 | 13.1 | ⋯ | ⋯ |
| NGC 4441 | 12 27 20 | 64 48 05 | 36.8 | 175 | 2674 | 9.96 | 10.05 | 12.5 | 0.24 ± 0.03 | ⋯ |
| UGC 8058 | 12 56 14 | 56 52 25 | 178.6 | 797 | 12642 | 12.37 | 12.52 | 1.85 | 16 ± 3 | ULIRG |
| AM 1255-430 | 12 58 08 | −43 19 47 | 126.6 | 578 | 9026 | <10.18 | <10.67 | 6.48 | 0.66 ± 0.07 | ⋯ |
| AM 1300-233 | 13 02 52 | −23 55 18 | 89.8 | 417 | 6446 | 11.41 | 11.41 | 5.78 | 0.08 ± 0.01 | LIRG |
| Arp 193 | 13 20 35 | 34 08 22 | 97.5 | 451 | 7000 | 11.59 | 11.61 | 5.78 | 0.40 ± 0.08 | LIRG |
| UGC 9829 | 15 23 01 | −01 20 50 | 118.8 | 545 | 8492 | 10.39 | 10.47 | 9.35 | ⋯ | ⋯ |
| NGC 6052 | 16 05 13 | 20 32 32 | 65.3 | 307 | 4716 | 10.88 | 10.94 | 12.4 | ⋯ | ⋯ |
| UGC 10675 | 17 03 15 | 31 27 29 | 142.5 | 646 | 10134 | 11.03 | 11.11 | 4.10 | 3 ± 1 | LIRG |
| AM 2038-382 | 20 41 13 | −38 11 36 | 84.3 | 393 | 6057 | 10.37 | 10.52 | 5.53 | 1.2 ± 0.1 | ⋯ |
| AM 2055-425 | 20 58 26 | −42 39 00 | 181.7 | 810 | 12840 | 11.95 | 12.02 | 4.50 | 0.57 ± 0.08 | ULIRG |
| NGC 7135 | 21 49 46 | −34 52 35 | 36.4 | 173 | 2640 | 9.05 | 9.13 | 2.47 | 0.01 ± 0.01 | ⋯ |
| NGC 7252 | 22 20 44 | −24 40 42 | 64.9 | 305 | 4688 | 10.66 | 10.73 | 8.51 | 0.60 ± 0.05 | ⋯ |
Note. Column 1: source name. Columns 2 and 3: R.A. and decl. Column 4: luminosity distance. Column 5: spatial scale. Column 6: systemic velocity (Rothberg & Joseph 2004). Columns 7 and 8: FIR and IR luminosities estimated using the IRAS catalogs, but the IR luminosities of Arp 187, AM 1158-333, UGC 9829, UGC 10675, and NGC 7135 are estimated using LIR = 1.2 × LFIR. This is based on the average LIR/LFIR (1.2 ± 0.1) of our sample except for two AGN host galaxies. Column 9: radius enclosing the maximum extent of the CO distribution (Ueda et al. 2014). Column 10: extent of molecular gas relative to the stellar component (Ueda et al. 2014). See the details in the text. Column 11: classification by the IR luminosity.
A machine-readable version of the table is available.
Download table as: DataTypeset image
2.2. Observations with LMT
Multiline observations toward 28 merger remnants were carried out using the LMT between 2014 October and 2015 May in its early science phase. In this early phase, the LMT operated with a 32 m active surface. The Redshift Search Receiver (RSR; Erickson et al. 2007) consists of two dual-polarization front-end receivers that are chopped between the ON and OFF source positions separated by 76'' in Azimuth, always integrating on-source. The back-end spectrometer covered the frequency range 73–111 GHz simultaneously. The spectral resolution is 31.25 MHz, which corresponds to 100 km s−1 at 93 GHz. The primary beam size is 20'' at 110 GHz and 28'' at 75 GHz.
Data reduction was carried out using DREAMPY (Data REduction and Analysis Methods in PYthon), which is the pipeline software for the RSR data reduction written by G. Narayanan. After flagging scans affected by hardware or software problems, a linear baseline is removed from each spectrum. The rms noise level of the spectra at frequencies below 80 GHz is much higher than that for higher frequencies. There are no strong molecular lines in this frequency range. We thus excluded this frequency range and estimated the rms noise level of each spectrum using line-fee channels between νobs = 80 and 111 GHz. The rms noise levels in the frequency resolution of 31.25 GHz range between 0.14 and 0.40 mK (Avg. = 0.29 ± 0.01 mK) in the antenna temperature ( ) unit.
We used the IDL GAUSSFIT function to identify molecular lines. We consider molecular lines whose peak intensity can be identified with a signal-to-noise ratio of >3 as "detected lines." Molecular lines detected with 2 < signal-to-noise ratio < 3 are considered to be "tentatively detected lines" if their velocities and line widths agree with those of other detected lines in the same sources. The Gaussian line fitting failed for C2H (1–0) as this feature is a blend of two transitions, each with hyperfine structure. Therefore, for C2H (1–0) we consider the line to be detected if at least two spectral channels at the correct frequency are above 3σ.
2.3. Ancillary Data: Atacama Large Millimeter/submillimeter Array CO Maps
We used the CO (1–0) data of six sources (Arp 187, AM 0956-282, NGC 3597, AM 1300-233, AM 2055-425, and NGC 7252) obtained with the Atacama Large Millimeter/submillimeter Array (ALMA) 12 m array and the Atacama Compact Array (ACA: 7 m array + Total Power (TP) array) as part of 2011.0.00099.S, 2016.2.00006.S, and 2017.1.01003.S. In these projects, one spectral window was set to cover the redshifted CO (1–0) line. The bandwidth of the spectral window is 1.875 GHz and the frequency resolution is 488 kHz. In addition, we used the CO (1–0) data of NGC 3256 obtained with the ALMA 12 m (TM2) array and the ACA 7 m array as part of 2016.2.00042.S, 2016.2.00094.S, and 2018.1.00223.S. The data were obtained using single pointing. The full width at half maximum of the primary beam is ∼51'' at the observing frequency for a 12 m antenna. We adopt the typical systematic errors on the absolute flux calibration of 5% for the Band 3 data (e.g., Vilaro 2011; Andreani 2016).
We first restored the calibrated measurement set using the observatory-provided reduction script and the appropriate versions of the Common Astronomy Software Applications (CASA) package. Flux rescaling was applied to the ACA 7 m array data of Arp 187, NGC 3597, and AM 1300-233 because the more appropriate catalog values of the amplitude calibrators are available in the ALMA Calibrator Source Catalogue. After the continuum subtraction, we combined the 12 m array data and the 7 m array data and created the 12 m+7 m images by adopting Briggs weighting of the visibilities (robust = 0.5). For 6/7 sources, we also made the TP images and combined them with the 12 m+7 m images using the CASA feather task. The data of NGC 3256 were not corrected with the zero-spacing information because the TP array data are not available. The maximum recoverable angular scale calculated from the minimum baseline of the 7 m array (∼9 m) is ∼35 8 at the observing frequency. We compared the flux density measured in the 12 m+7 m image of NGC 3256 with the literature single-dish measurement (Casoli et al. 1992a). The recovered flux is 90% in the central 44'' region. The image rms per channel and the synthesized beam size are summarized in Table 2.
Table 2. ALMA CO (1–0) Maps
| Source | Array | Velocity Res. | Rms | Beam Size |
|---|---|---|---|---|
| (km s−1) | (mJy beam−1) | (arcsec) | ||
| (1) | (2) | (3) | (4) | (5) |
| Arp 187 | 12M+7M+TP | 20 | 2.04 | 2.98 × 1.79 |
| AM 0956-282 | 12M+7M+TP | 5 | 4.36 | 4.86 × 3.22 |
| NGC 3256 | 12M+7M | 2.5 | 1.95 | 2.22 × 2.22 |
| NGC 3597 | 12M+7M+TP | 20 | 3.57 | 1.99 × 1.39 |
| AM 1300-233 | 12M+7M+TP | 20 | 1.86 | 2.35 × 1.20 |
| AM 2055-425 | 12M+7M+TP | 20 | 2.15 | 1.53 × 1.21 |
| NGC 7252 | 12M+7M+TP | 20 | 2.83 | 2.57 × 1.66 |
Note. Column 1: source name. Column 2: array name (12M =12 m array, 7M = 7 m array, TP = total power array). Column 3: velocity resolution of the channel map. Column 4: noise level per channel. Column 5: synthesized beam size.
Download table as: ASCIITypeset image
3. Results
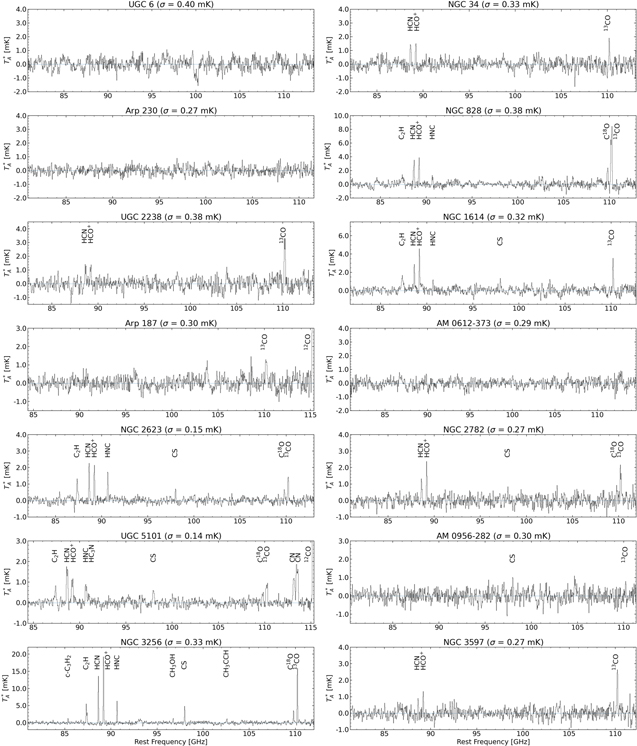
Twenty-one of 28 merger remnants were detected with signal-to-noise ratios of > 3 in one or more molecular lines. The detection rate does not depend on the distances to galaxies. The spectra of the merger remnants are presented in Figure 1. The molecular lines in NGC 3256 are roughly five times brighter than the galaxy with second brightest lines. Of the 21 galaxies detected in one or more molecular lines, all but UGC 10675 were detected in the 13CO (1–0) line. Seventeen sources were detected in either the HCN (1–0) or HCO+(1–0) lines, and 15 were detected in both lines. While UGC 10675 was detected with a signal-to-noise ratio of ∼ 5 in the HCN line, it was not detected in the HCO+ line. On the other hand, NGC 6052 was detected with a signal-to-noise ratios > 6 in the HCO+ line, but it was not detected in the HCN line. Seven out of 15 sources have the HCN luminosity higher than the HCO+ luminosity. The HC3N lines were detected in UGC 5101 and UGC 8058, both of which host X-ray-detected AGNs (e.g., Iwasawa et al. 2011). Three molecular species (c-C3H2, CH3OH, and CH3CCH) were only detected in NGC 3256, and N2H+ was only detected in UGC 8058. The peak intensities of these species are weaker compared to major species such as 13CO, HCN, and HCO+. In addition, the C2H (1–0), HNC (1–0), C18O (1–0), and CS (2–1) lines were identified in several sources. There are two transitions of C2H (N = 1–0 J = 3/2–1/2 and N = 1–0 J = 1/2–1/2) in the frequency range, but these transitions cannot be resolved due to a limited frequency resolution. For relatively distant sources (DL ≥ 90 Mpc), redshifted CN (N = 1–0, J = 1/2–1/2), CN (N = 1–0, J = 3/2–1/2), and CO (1–0) lines fell into the bandwidth. The CN lines were detected in six sources, and the CO line was detected in two sources. The hyperfine lines of CN cannot be resolved due to the limited frequency resolution. In summary, 16 molecular lines from 14 different molecular species and isotopologues were identified within the frequency range.
Download figure:
Standard image High-resolution image
Figure 1. Spectra of the merger remnants. The intensity scale is in the antenna temperature ( ). The frequency resolution is ∼31 MHz.
Download figure:
Standard image High-resolution imageThe properties of molecular lines identified, including the integrated line intensity, are summarized in Table 3. We estimated the integrated line intensity by summing consecutive channels (Nch) whose values are above 1.5σ around the central channel identified by the Gaussian fitting. We did not use the results of the Gaussian fitting to estimate the integrated line intensities because some of the molecular lines show double horn line profiles even if they can be fitted with Gaussian profiles. In the case of nondetection in six major species (HCN, HCO+, HNC, CS, C18O, and 13CO), we estimated the 3σ upper limit of the integrated line intensity by using the following equation,

where rms is the 1σ noise level of the spectrum, Δ Vch is the velocity width of a channel at the observing frequency, and Nch is the number of channels integrated. We used Nch of 13CO to estimate the upper limit of C18O and the average Nch of detected lines among HCN, HCO+, HNC, and CS to estimate the upper limits of the other lines. When none of these four lines were detected, we used the number of channels to cover the line width (Δ V × Nch) of 13CO to estimate the upper limits of the four lines. For UGC 10675, we estimated the upper limits of HCO+, HNC, CS, C18O, and C13O using the number of channels to cover the line width of HCN. For seven galaxies that were not detected in any molecular lines, the 3σ upper limit of the integrated line intensity was estimated, assuming that the line width is similar to that of the 12CO (1–0) emission (Ueda et al. 2014). We use a Kelvin-to-Jansky gain factor of 7 Jy K−1 (in  unit) to convert the units of line intensity to Jansky, assuming that the source is smaller than the beam. Then, we calculated the luminosities of HCN, HCO+, and HNC in units of K km s−1 pc2 using Equation (3) in Solomon & Vanden Bout (2005):

where  is the luminosity in the unit of K km s−1 pc2, SlineΔ v is the integrated flux density in Jy km s−1, νobs is the observing frequency in GHz, DL is the luminosity distance in Mpc, and z is the redshift. The derived luminosities are summarized in Table 4. We note that the data of UGC 5101 have been published in Cruz-González et al. (2020), but they combined additional data obtained in 2017. Ten molecular lines were identified in the spectrum of UGC 5101. The derived integrated intensities of 8/10 molecular lines are consistent with the values reported by the previous study within the errors. The integrated intensities of C2H (1–0) and CN (1–0; 3/2–1/2) are 73% and 89% of the previous measurements (Cruz-González et al. 2020). These lines are blended with the hyperfine lines and broadened, but our analysis may miss the faint hyperfine lines whose peaks are below 1.5σ.
Table 3. Properties of Molecular Lines
| Source | Line | VLSR |

| Nch | Nch × Δ Vch | I | SΔV |
|---|---|---|---|---|---|---|---|
| (km s−1) | (mK) | (km s−1) | (K( ) km s−1) ) km s−1) | (Jy km s−1) | |||
| (1) | (2) | (3) | (4) | (5) | (6) | (7) | (8) |
| UGC 6 | HCN (1–0) | ⋯ | <1.20 | 4 | 423 | <0.25 | <1.8 |
| (σ = 0.40 mK) | HCO+(1–0) | ⋯ | <1.20 | 4 | 420 | <0.25 | <1.8 |
| HNC (1–0) | ⋯ | <1.20 | 4 | 413 | <0.25 | <1.7 | |
| CS (2–1) | ⋯ | <1.20 | 5 | 478 | <0.26 | <1.8 | |
| C18O (1–0) | ⋯ | <1.20 | 5 | 427 | <0.23 | <1.6 | |
| 13CO (1–0) | ⋯ | <1.20 | 5 | 425 | <0.23 | <1.6 | |
| NGC 34 | HCN (1–0) | 5747 ± 32 | 1.43 ± 0.33 | 5 | 529 | 0.62 ± 0.08 | 4.3 ± 0.5 |
| (σ = 0.33 mK) | HCO+(1–0) | 5716 ± 26 | 1.50 ± 0.33 | 4 | 420 | 0.54 ± 0.07 | 3.8 ± 0.5 |
| HNC (1–0) | ⋯ | <0.99 | 5 | 517 | <0.23 | <1.6 | |
| CS (2–1) | ⋯ | <0.99 | 5 | 478 | <0.21 | <1.5 | |
| C18O (1–0) | ⋯ | <0.99 | 4 | 341 | <0.17 | <1.2 | |
| 13CO (1–0) | 5768 ± 21 | 1.90 ± 0.33 | 4 | 340 | 0.43 ± 0.06 | 3.0 ± 0.4 | |
| Arp 230 | HCN (1–0) | ⋯ | <0.81 | 3 | 317 | <0.15 | <1.0 |
| (σ = 0.27 mK) | HCO+(1–0) | ⋯ | <0.81 | 3 | 315 | <0.15 | <1.0 |
| HNC (1–0) | ⋯ | <0.81 | 3 | 310 | <0.14 | <1.0 | |
| CS (2–1) | ⋯ | <0.81 | 3 | 287 | <0.13 | <0.94 | |
| C18O (1–0) | ⋯ | <0.81 | 3 | 256 | <0.12 | <0.84 | |
| 13CO (1–0) | ⋯ | <0.81 | 3 | 255 | <0.12 | <0.83 | |
| NGC 828 | C2H (1–0) | ⋯ | 1.41 ± 0.28 | 7 | 750 | 0.69 ± 0.11 | 4.9 ± 0.8 |
| (σ = 0.38 mK) | HCN (1–0) | 5209 ± 18 | 3.52 ± 0.38 | 6 | 634 | 1.32 ± 0.10 | 9.2 ± 0.7 |
| HCO+(1–0) | 5195 ± 16 | 3.87 ± 0.38 | 5 | 525 | 1.25 ± 0.09 | 8.7 ± 0.6 | |
| HNC (1–0) | 5236 ± 43 | 1.31 ± 0.38 | 4 | 413 | 0.40 ± 0.08 | 2.8 ± 0.5 | |
| CS (2–1) | ⋯ | <1.14 | 5 | 478 | <0.24 | <1.7 | |
| C18O (1–0) | 5192 ± 18 | 2.38 ± 0.38 | 5 | 427 | 0.86 ± 0.07 | 6.1 ± 0.5 | |
| 13CO (1–0) | 5211 ± 8 | 8.44 ± 0.38 | 7 | 595 | 3.38 ± 0.09 | 23.7 ± 0.6 | |
| UGC 2238 | HCN (1–0) | 6323 ± 60 | 1.42 ± 0.38 | 5 | 529 | 0.56 ± 0.09 | 3.9 ± 0.6 |
| (σ = 0.38 mK) | HCO+(1–0) | 6347 ± 56 | 1.38 ± 0.38 | 4 | 420 | 0.48 ± 0.08 | 3.3 ± 0.6 |
| HNC (1–0) | ⋯ | <1.14 | 5 | 517 | <0.26 | <1.8 | |
| CS (2–1) | ⋯ | <1.14 | 5 | 478 | <0.24 | <1.7 | |
| C18O (1–0) | ⋯ | <1.14 | 6 | 512 | <0.24 | <1.7 | |
| 13CO (1–0) | 6361 ± 14 | 3.30 ± 0.38 | 6 | 510 | 1.28 ± 0.08 | 8.9 ± 0.6 | |
| NGC 1614 | C2H (1–0) | ⋯ | 1.68 ± 0.32 | 10 | 1072 | 1.13 ± 0.11 | 7.9 ± 0.8 |
| (σ = 0.32 mK) | HCN (1–0) | 4690 ± 16 | 2.87 ± 0.32 | 4 | 423 | 0.86 ± 0.07 | 6.0 ± 0.5 |
| HCO+(1–0) | 4688 ± 11 | 4.58 ± 0.32 | 5 | 525 | 1.32 ± 0.08 | 9.3 ± 0.5 | |
| HNC (1–0) | 4673 ± 35 | 1.19 ± 0.32 | 3 | 310 | 0.31 ± 0.06 | 2.2 ± 0.4 | |
| CS (2–1) | 4690 ± 36 | 1.35 ± 0.32 | 3 | 287 | 0.30 ± 0.05 | 2.1 ± 0.4 | |
| C18O (1–0) | ⋯ | <0.96 | 5 | 427 | <0.18 | <1.3 | |
| 13CO (1–0) | 4707 ± 11 | 3.54 ± 0.32 | 5 | 425 | 0.86 ± 0.06 | 6.0 ± 0.4 | |
| Arp 187 | HCN (1–0) | ⋯ | <0.90 | 6 | 634 | <0.23 | <1.6 |
| (σ = 0.30 mK) | HCO+(1–0) | ⋯ | <0.90 | 6 | 630 | <0.23 | <1.6 |
| HNC (1–0) | ⋯ | <0.90 | 6 | 620 | <0.23 | <1.6 | |
| CS (2–1) | ⋯ | <0.90 | 7 | 669 | <0.23 | <1.6 | |
| C18O (1–0) | ⋯ | <0.90 | 7 | 597 | <0.20 | <1.4 | |
| 13CO (1–0) | 11467 ± 32 | 1.29 ± 0.30 | 7 | 595 | 0.62 ± 0.07 | 4.3 ± 0.5 | |
| AM 0612-373 | HCN (1–0) | ⋯ | <0.87 | 7 | 740 | <0.24 | <1.7 |
| (σ = 0.29 mK) | HCO+(1–0) | ⋯ | <0.87 | 7 | 735 | <0.24 | <1.7 |
| HNC (1–0) | ⋯ | <0.87 | 7 | 723 | <0.24 | <1.7 | |
| CS (2–1) | ⋯ | <0.87 | 8 | 765 | <0.24 | <1.6 | |
| C18O (1–0) | ⋯ | <0.87 | 9 | 768 | <0.22 | <1.6 | |
| 13CO (1–0) | ⋯ | <0.87 | 9 | 765 | <0.22 | <1.6 | |
| NGC 2623 | C2H (1–0) | ⋯ | 1.32 ± 0.15 | 8 | 858 | 0.62 ± 0.05 | 4.3 ± 0.3 |
| (σ = 0.15 mK) | HCN (1–0) | 5420 ± 12 | 2.26 ± 0.15 | 5 | 529 | 0.77 ± 0.04 | 5.4 ± 0.2 |
| HCO+(1–0) | 5412 ± 13 | 2.14 ± 0.15 | 5 | 525 | 0.72 ± 0.04 | 5.0 ± 0.2 | |
| HNC (1–0) | 5435 ± 12 | 1.72 ± 0.15 | 5 | 517 | 0.56 ± 0.03 | 3.9 ± 0.2 | |
| CS (2–1) | 5371 ± 26 | 0.70 ± 0.15 | 3 | 287 | 0.18 ± 0.02 | 1.3 ± 0.2 | |
| C18O (1–0) | 5399 ± 22 | 0.66 ± 0.15 | 4 | 341 | 0.18 ± 0.03 | 1.3 ± 0.2 | |
| 13CO (1–0) | 5434 ± 12 | 1.43 ± 0.15 | 5 | 425 | 0.47 ± 0.03 | 3.3 ± 0.2 | |
| NGC 2782 | HCN (1–0) | 2583 ± 36 | 1.32 ± 0.27 | 5 | 529 | 0.45 ± 0.06 | 3.2 ± 0.4 |
| (σ = 0.27 mK) | HCO+(1–0) | 2570 ± 18 | 2.37 ± 0.27 | 4 | 420 | 0.65 ± 0.06 | 4.6 ± 0.4 |
| HNC (1–0) | ⋯ | <0.81 | 4 | 413 | <0.17 | <1.2 | |
| CS (2–1) | 2524 ± 45 | 0.83 ± 0.27 | 3 | 287 | 0.18 ± 0.04 | 1.3 ± 0.3 | |
| C18O (1–0) | 2488 ± 40 | 0.93 ± 0.27 | 5 | 427 | 0.25 ± 0.05 | 1.8 ± 0.4 | |
| 13CO (1–0) | 2515 ± 19 | 2.16 ± 0.27 | 6 | 510 | 0.75 ± 0.06 | 5.2 ± 0.4 | |
| UGC 5101 | C2H (1–0) | ⋯ | 0.83 ± 0.14 | 9 | 965 | 0.44 ± 0.05 | 3.1 ± 0.3 |
| (σ = 0.14 mK) | HCN (1–0) | 11346 ± 23 | 1.75 ± 0.14 | 7 | 740 | 0.98 ± 0.04 | 6.8 ± 0.3 |
| HCO+(1–0) | 11332 ± 32 | 1.17 ± 0.14 | 9 | 945 | 0.75 ± 0.04 | 5.3 ± 0.3 | |
| HNC (1–0) | 11321 ± 32 | 0.89 ± 0.14 | 7 | 723 | 0.51 ± 0.04 | 3.6 ± 0.3 | |
| HC3N (10–9) | 11328 ± 69 | 0.45 ± 0.14 | 6 | 618 | 0.19 ± 0.04 | 1.3 ± 0.2 | |
| CS (2–1) | 11388 ± 36 | 0.60 ± 0.14 | 7 | 669 | 0.32 ± 0.04 | 2.2 ± 0.2 | |
| C18O (1–0) | 11350 ± 41 | 0.51 ± 0.14 | 6 | 512 | 0.20 ± 0.03 | 1.4 ± 0.2 | |
| 13CO (1–0) | 11312 ± 24 | 0.95 ± 0.14 | 7 | 595 | 0.47 ± 0.03 | 3.3 ± 0.2 | |
| CN (1–0; 1/2–1/2) | 11367 ± 25 | 1.19 ± 0.14 | 9 | 745 | 0.68 ± 0.03 | 4.8 ± 0.2 | |
| CN (1–0; 3/2–1/2) | 11340 ± 21 | 1.86 ± 0.14 | 10 | 825 | 1.11 ± 0.04 | 7.8 ± 0.3 | |
| AM 0956-282 | HCN (1–0) | ⋯ | <0.90 | 4 | 423 | <0.19 | <1.3 |
| (σ = 0.30 mK) | HCO+(1–0) | ⋯ | <0.90 | 4 | 420 | <0.19 | <1.3 |
| HNC (1–0) | ⋯ | <0.90 | 4 | 413 | <0.19 | <1.3 | |
| CS (2–1) | 1020 ± 29 | 1.01 ± 0.30 | 4 | 382 | 0.28 ± 0.06 | 1.9 ± 0.4 | |
| C18O (1–0) | ⋯ | <0.90 | 3 | 256 | <0.13 | <0.93 | |
| 13CO (1–0) | 1051 ± 31 | ∼0.79 a | 3 | 255 | 0.18 ± 0.04 | 1.2 ± 0.3 | |
| NGC 3256 | c-C3H2 (21,2 –11,0) | 2785 ± 22 | 1.26 ± 0.33 | 2 | 220 | 0.77 ± 0.05 | 1.9 ± 0.4 |
| (σ = 0.33 mK) | C2H (1–0) | ⋯ | 5.51 ± 0.33 | 6 | 644 | 1.83 ± 0.09 | 12.8 ± 0.6 |
| HCN (1–0) | 2793 ± 4 | 13.59 ± 0.33 | 4 | 423 | 2.91 ± 0.07 | 20.4 ± 0.5 | |
| HCO+(1–0) | 2794 ± 5 | 19.21 ± 0.33 | 5 | 525 | 4.74 ± 0.08 | 33.2 ± 0.5 | |
| HNC (1–0) | 2797 ± 8 | 6.33 ± 0.33 | 3 | 310 | 1.23 ± 0.06 | 8.6 ± 0.4 | |
| CH3OH (2k –1k ) | 2820 ±28 | 1.31 ± 0.33 | 3 | 322 | 0.32 ± 0.06 | 2.2 ± 0.4 | |
| CS (2–1) | 2780 ± 8 | 4.83 ± 0.33 | 4 | 382 | 1.04 ± 0.06 | 7.3 ± 0.4 | |
| CH3CCH (6k –5k ) | 2766 ± 31 | 1.17 ± 0.33 | 2 | 183 | 0.20 ± 0.04 | 1.4 ± 0.3 | |
| C18O (1–0) | 2780 ± 8 | 3.54 ± 0.33 | 4 | 341 | 0.74 ± 0.06 | 5.2 ± 0.4 | |
| 13CO (1–0) | 2792 ± 4 | 15.88 ± 0.33 | 4 | 340 | 3.29 ± 0.06 | 23.0 ± 0.4 | |
| NGC 3597 | HCN (1–0) | 3469 ± 28 | 0.90 ± 0.27 | 3 | 317 | 0.23 ± 0.05 | 1.6 ± 0.3 |
| (σ = 0.27 mK) | HCO+(1–0) | 3491 ± 22 | 1.32 ± 0.27 | 3 | 315 | 0.32 ± 0.05 | 2.2 ± 0.3 |
| HNC (1–0) | ⋯ | <0.81 | 3 | 310 | <0.14 | <1.0 | |
| CS (2–1) | ⋯ | <0.81 | 3 | 287 | <0.13 | <0.94 | |
| C18O (1–0) | ⋯ | <0.81 | 4 | 341 | <0.14 | <0.97 | |
| 13CO (1–0) | 3464 ± 11 | 2.63 ± 0.27 | 4 | 340 | 0.76 ± 0.05 | 5.3 ± 0.3 | |
| AM 1158-333 | HCN (1–0) | ⋯ | <1.05 | 2 | 211 | <0.16 | <1.1 |
| (σ = 0.35 mK) | HCO+(1–0) | ⋯ | <1.05 | 2 | 210 | <0.16 | <1.1 |
| HNC (1–0) | ⋯ | <1.05 | 2 | 207 | <0.15 | <1.1 | |
| CS (2–1) | ⋯ | <1.05 | 2 | 191 | <0.14 | <0.99 | |
| C18O (1–0) | ⋯ | <1.05 | 3 | 256 | <0.16 | <1.1 | |
| 13CO (1–0) | ⋯ | <1.05 | 3 | 255 | <0.15 | <1.1 | |
| NGC 4194 | HCN (1–0) | 2521 ± 30 | 1.62 ± 0.36 | 3 | 317 | 0.36 ± 0.07 | 2.6 ± 0.5 |
| (σ = 0.36mK) | HCO+(1–0) | 2542 ± 11 | 3.31 ± 0.36 | 3 | 315 | 0.70 ± 0.07 | 4.9 ± 0.5 |
| HNC (1–0) | ⋯ | <1.08 | 3 | 310 | <0.19 | <1.4 | |
| CS (2–1) | ⋯ | <1.08 | 3 | 287 | <0.18 | <1.3 | |
| C18O (1–0) | ⋯ | <1.08 | 3 | 256 | <0.16 | <1.1 | |
| 13CO (1–0) | 2517 ± 12 | 2.87 ± 0.36 | 3 | 255 | 0.56 ± 0.05 | 4.0 ± 0.4 | |
| NGC 4441 | HCN (1–0) | ⋯ | <0.93 | 3 | 317 | <0.17 | <1.2 |
| (σ = 0.31 mK) | HCO+(1–0) | ⋯ | <0.93 | 3 | 315 | <0.17 | <1.2 |
| HNC (1–0) | ⋯ | <0.93 | 3 | 310 | <0.17 | <1.2 | |
| CS (2–1) | ⋯ | <0.93 | 3 | 287 | <0.15 | <1.1 | |
| C18O (1–0) | ⋯ | <0.93 | 3 | 256 | <0.14 | <0.96 | |
| 13CO (1–0) | 2691 ± 28 | 1.29 ± 0.31 | 3 | 255 | 0.27 ± 0.05 | 1.9 ± 0.3 | |
| UGC 8058 | C2H (1–0) | ⋯ | 0.99 ± 0.23 | 6 | 643 | 0.41 ± 0.06 | 2.9 ± 0.4 |
| (σ = 0.23 mK) | HCN (1–0) | 12123 ± 12 | 4.18 ± 0.23 | 9 | 951 | 1.67 ± 0.07 | 11.7 ± 0.5 |
| HCO+(1–0) | 12125 ± 10 | 3.56 ± 0.23 | 11 | 1155 | 1.56 ± 0.08 | 10.9 ± 0.6 | |
| HNC (1–0) | 12134 ± 12 | 2.41 ± 0.23 | 4 | 413 | 0.59 ± 0.05 | 4.1 ± 0.3 | |
| HC3N (10–9) | 12147 ± 28 | 0.89 ± 0.23 | 2 | 206 | 0.16 ± 0.03 | 1.1 ± 0.2 | |
| N2H+(1–0) | 12163 ± 34 | 0.69 ± 0.23 | 2 | 201 | 0.12 ± 0.03 | 0.8 ± 0.2 | |
| CS (2–1) | 12113 ± 23 | 1.00 ± 0.23 | 2 | 191 | 0.17 ± 0.03 | 1.2 ± 0.2 | |
| HC3N (12–11) | 12205 ± 24 | 1.47 ± 0.23 | 5 | 429 | 0.40 ± 0.04 | 2.8 ± 0.3 | |
| C18O (1–0) | ⋯ | <0.69 | 2 | 171 | <0.08 | <0.58 | |
| 13CO (1–0) | 12139 ± 28 | 0.84 ± 0.23 | 2 | 170 | 0.13 ± 0.03 | 0.9 ± 0.2 | |
| CN (1–0; 1/2–1/2) | 12122 ± 15 | 1.96 ± 0.23 | 5 | 414 | 0.63 ± 0.04 | 4.4 ± 0.3 | |
| CN (1–0; 3/2–1/2) | 12127 ± 9 | 4.45 ± 0.23 | 5 | 413 | 1.05 ± 0.04 | 7.3 ± 0.3 | |
| 12CO (1–0) | 12138 ± 1 | 36.35 ± 0.23 | 17 | 1382 | 9.61 ± 0.08 | 67.2 ± 0.5 | |
| AM 1255-430 | HCN (1–0) | ⋯ | <0.87 | 5 | 529 | <0.21 | <1.4 |
| (σ = 0.29 mK) | HCO+(1–0) | ⋯ | <0.87 | 5 | 525 | <0.20 | <1.4 |
| HNC (1–0) | ⋯ | <0.87 | 5 | 517 | <0.20 | <1.4 | |
| CS (2–1) | ⋯ | <0.87 | 5 | 478 | <0.19 | <1.3 | |
| C18O (1–0) | ⋯ | <0.87 | 6 | 512 | <0.18 | <1.3 | |
| 13CO (1–0) | ⋯ | <0.87 | 6 | 510 | <0.18 | <1.3 | |
| AM 1300-233 | HCN (1–0) | 6308 ± 58 | 0.84 ± 0.24 | 7 | 740 | 0.40 ± 0.07 | 2.8 ± 0.5 |
| (σ = 0.24 mK) | HCO+(1–0) | 6313 ± 29 | 1.72 ± 0.24 | 6 | 630 | 0.76 ± 0.06 | 5.3 ± 0.4 |
| HNC (1–0) | ⋯ | <0.72 | 6 | 620 | <0.18 | <1.3 | |
| CS (2–1) | 6290 ± 59 | ∼0.68 a | 6 | 574 | 0.30 ± 0.06 | 2.1 ± 0.4 | |
| C18O (1–0) | ⋯ | <0.72 | 6 | 512 | <0.15 | <1.1 | |
| 13CO (1–0) | 6269 ± 37 | 1.33 ± 0.24 | 6 | 510 | 0.41 ± 0.05 | 2.8 ± 0.3 | |
| CN (1–0; 1/2–1/2) | 6299 ± 49 | 0.85 ± 0.24 | 6 | 497 | 0.29 ± 0.05 | 2.1 ± 0.3 | |
| Arp 193 | C2H (1–0) | 6762 ± 39 | 1.49 ± 0.29 | 9 | 965 | 0.75 ± 0.09 | 5.2 ± 0.7 |
| (σ = 0.29 mK) | HCN (1–0) | 6763 ± 18 | 2.50 ± 0.29 | 5 | 529 | 0.84 ± 0.07 | 5.9 ± 0.5 |
| HCO+(1–0) | 6800 ± 15 | 3.42 ± 0.29 | 5 | 525 | 1.29 ± 0.07 | 9.1 ± 0.5 | |
| HNC (1–0) | 6809 ± 52 | 0.92 ± 0.29 | 5 | 517 | 0.41 ± 0.07 | 2.9 ± 0.5 | |
| CS (2–1) | 6765 ± 40 | 1.20 ± 0.29 | 5 | 478 | 0.38 ± 0.06 | 2.7 ± 0.4 | |
| C18O (1–0) | ⋯ | <0.87 | 5 | 427 | <0.17 | <1.2 | |
| 13CO (1–0) | 6826 ± 19 | 2.38 ± 0.29 | 5 | 425 | 0.78 ± 0.06 | 5.4 ± 0.4 | |
| CN (1–0; 1/2–1/2) | 6858 ± 28 | 1.67 ± 0.29 | 7 | 579 | 0.56 ± 0.06 | 3.9 ± 0.4 | |
| UGC 9829 | HCN (1–0) | ⋯ | <0.75 | 5 | 529 | <0.18 | <1.2 |
| (σ = 0.25 mK) | HCO+(1–0) | ⋯ | <0.75 | 5 | 525 | <0.18 | <1.2 |
| HNC (1–0) | ⋯ | <0.75 | 5 | 517 | <0.17 | <1.2 | |
| CS (2–1) | ⋯ | <0.75 | 5 | 478 | <0.16 | <1.1 | |
| C18O (1–0) | ⋯ | <0.75 | 5 | 427 | <0.14 | <1.0 | |
| 13CO (1–0) | 8290 ± 22 | 1.63 ± 0.25 | 5 | 425 | 0.43 ± 0.05 | 3.0 ± 0.3 | |
| NGC 6052 | C2H (1–0) | 4659 ± 25 | 1.18 ± 0.31 | 2 | 215 | 0.23 ± 0.05 | 1.6 ± 0.3 |
| (σ = 0.31 mK) | HCN (1–0) | ⋯ | <0.93 | 3 | 317 | <0.17 | <1.2 |
| HCO+(1–0) | 4636 ± 17 | 1.96 ± 0.31 | 3 | 315 | 0.37 ± 0.06 | 2.6 ± 0.4 | |
| HNC (1–0) | ⋯ | <0.93 | 3 | 310 | <0.17 | <1.2 | |
| CS (2–1) | ⋯ | <0.93 | 3 | 287 | <0.15 | <1.1 | |
| C18O (1–0) | ⋯ | <0.93 | 3 | 256 | <0.14 | <0.96 | |
| 13CO (1–0) | 4617 ± 13 | 2.05 ± 0.31 | 3 | 255 | 0.34 ± 0.05 | 2.4 ± 0.3 | |
| UGC 10675 | HCN (1–0) | 9808 ± 24 | 1.34 ± 0.27 | 3 | 317 | 0.19 ± 0.05 | 1.3 ± 0.3 |
| (σ = 0.27 mK) | HCO+(1–0) | ⋯ | <0.81 | 3 | 315 | <0.15 | <1.0 |
| HNC (1–0) | ⋯ | <0.81 | 3 | 310 | <0.14 | <1.0 | |
| CS (2–1) | ⋯ | <0.81 | 3 | 287 | <0.13 | <0.94 | |
| C18O (1–0) | ⋯ | <0.81 | 4 | 341 | <0.14 | <0.97 | |
| 13CO (1–0) | ⋯ | <0.81 | 4 | 340 | <0.14 | <0.96 | |
| CN (1–0; 1/2–1/2) | 9817 ± 26 | 0.92 ± 0.27 | 2 | 166 | 0.11 ± 0.03 | 0.8 ± 0.2 | |
| CN (1–0; 3/2–1/2) | 9895 ± 43 | 0.96 ± 0.27 | 6 | 495 | 0.34 ± 0.05 | 2.4 ± 0.4 | |
| AM 2038-382 | HCN (1–0) | ⋯ | <0.93 | 5 | 529 | <0.22 | <1.5 |
| (σ = 0.31 mK) | HCO+(1–0) | ⋯ | <0.93 | 5 | 525 | <0.22 | <1.5 |
| HNC (1–0) | ⋯ | <0.93 | 5 | 517 | <0.21 | <1.5 | |
| CS (2–1) | ⋯ | <0.93 | 5 | 478 | <0.20 | <1.4 | |
| C18O (1–0) | ⋯ | <0.93 | 6 | 512 | <0.19 | <1.4 | |
| 13CO (1–0) | ⋯ | <0.93 | 6 | 510 | <0.19 | <1.4 | |
| AM 2055-425 | HCN (1–0) | 12343 ± 23 | 0.86 ± 0.19 | 2 | 211 | 0.18 ± 0.03 | 1.2 ± 0.2 |
| (σ = 0.19 mK) | HCO+(1–0) | 12324 ± 12 | 1.60 ± 0.19 | 3 | 315 | 0.39 ± 0.03 | 2.7 ± 0.2 |
| HNC (1–0) | ⋯ | <0.57 | 3 | 310 | <0.10 | <0.71 | |
| CS (2–1) | ⋯ | <0.57 | 3 | 287 | <0.09 | <0.66 | |
| C18O (1–0) | ⋯ | <0.57 | 5 | 427 | <0.11 | <0.76 | |
| 13CO (1–0) | 12335 ± 19 | 1.01 ± 0.19 | 5 | 425 | 0.27 ± 0.04 | 1.9 ± 0.3 | |
| CN (1–0; 3/2–1/2) | 12299 ± 37 | 0.62 ± 0.19 | 4 | 330 | 0.16 ± 0.03 | 1.1 ± 0.2 | |
| 12CO (1–0) | 12328 ± 1 | 31.22 ± 0.19 | 7 | 569 | 6.87 ± 0.04 | 48.1 ± 0.3 | |
| NGC 7135 | HCN (1–0) | ⋯ | <0.78 | 3 | 317 | <0.14 | <1.0 |
| (σ = 0.26 mK) | HCO+(1–0) | ⋯ | <0.78 | 3 | 315 | <0.14 | <0.99 |
| HNC (1–0) | ⋯ | <0.78 | 3 | 310 | <0.14 | <0.98 | |
| CS (2–1) | ⋯ | <0.78 | 3 | 287 | <0.13 | <0.90 | |
| C18O (1–0) | ⋯ | <0.78 | 4 | 341 | <0.13 | <0.93 | |
| 13CO (1–0) | ⋯ | <0.78 | 4 | 340 | <0.13 | <0.93 | |
| NGC 7252 | HCN (1–0) | 4671 ± 17 | 1.57 ± 0.26 | 3 | 317 | 0.33 ± 0.05 | 2.3 ± 0.3 |
| (σ = 0.26 mK) | HCO+(1–0) | 4616 ± 30 | 1.02 ± 0.26 | 3 | 315 | 0.25 ± 0.05 | 1.8 ± 0.3 |
| HNC (1–0) | ⋯ | <0.78 | 3 | 310 | <0.14 | <0.98 | |
| CS (2–1) | ⋯ | <0.78 | 3 | 287 | <0.13 | <0.90 | |
| C18O (1–0) | 4667 ± 42 | ∼0.74 a | 4 | 341 | 0.20 ± 0.04 | 1.4 ± 0.3 | |
| 13CO (1–0) | 4664 ± 8 | 3.02 ± 0.26 | 4 | 340 | 0.71 ± 0.04 | 5.0 ± 0.3 | |
Notes. Column 1: source name and rms noise level of its spectrum in the antenna temperature unit. Column 2: molecular line. Column 3: central velocity of the molecular line based on the fitting result for the line identification. Column 4: peak antenna temperature. Column 5: number of channels whose values are above 1.5σ. Column 6: line width; Δ Vch is the velocity width of a channel. Column 7: integrated line intensity or its upper limit in unit of K km s−1. The errors are estimated from  . Column 8: integrated flux density or its upper limit in unit of Jy km s-1. This is calculated from the integrated line intensity using a Kelvin-to-Jansky conversion factor of 7 Jy K(
 )−1.
)−1.
A machine-readable version of the table is available.
Table 4. Molecular Line Luminosities
| Source |

|

|

|

| References |
|---|---|---|---|---|---|
| (K km s−1 pc2) | (K km s−1 pc2) | (K km s−1 pc2) | (K km s−1 pc2) | ||
| (1) | (2) | (3) | (4) | (5) | (6) |
| NGC 34 | (1.2 ± 0.3) × 108 | (1.0 ± 0.2) × 108 | <4.2 × 10⁷ | (2.1 ± 0.1) × 109 | 2 |
| NGC 828 | (2.1 ± 0.4) × 108 | (2.0 ± 0.4) × 108 | (6.1±1.7) × 107 | (4.8 ± 0.0) × 109 | 3 |
| UGC 2238 | (1.3 ± 0.3) × 108 | (1.1 ± 0.3) × 108 | <5.7 × 10⁷ | <3.8 × 10⁹ | 11 |
| NGC 1614 | (1.1 ± 0.2) × 108 | (1.6 ± 0.3) × 108 | (3.7±1.0) × 107 | (2.3 ± 0.0) × 109 | 4 |
| Arp 187 | <2.0 × 10⁸ | < 1.9 × 10⁸ | <1.8 × 10⁸ | (3.8 ± 0.2) × 109 | 1 |
| NGC 2623 | (1.3 ± 0.3) × 108 | (1.2 ± 0.2) × 108 | (9.0±1.9) × 107 | (1.8 ± 0.0) × 109 | 5 |
| NGC 2782 | (1.6 ± 0.4) × 107 | (2.3 ± 0.5) × 107 | <5.7 × 10⁶ | >2.9 × 10⁸ | 1 |
| UGC 5101 | (7.6±1.5) × 108 | (5.8±1.2) × 108 | (3.8 ± 0.8) × 108 | (6.6 ± 0.1) × 109 | 4 |
| AM 0956-282 | <1.0 × 10⁶ | <1.0 × 10⁶ | <9.5 × 10⁵ | (1.1 ± 0.1) × 107 | 1 |
| NGC 3256 | (1.2 ± 0.2) × 108 | (1.9 ± 0.4) × 108 | (4.8±1.0) × 107 | (3.9 ± 0.4) × 109 | 1 |
| NGC 3597 | (1.5 ± 0.5) × 107 | (2.1 ± 0.5) × 107 | <9.3 × 10⁶ | (9.0 ± 0.5) × 108 | 1 |
| NGC 4194 | (1.3 ± 0.3) × 107 | (2.4 ± 0.5) × 107 | <6.4 × 10⁶ | (5.6 ± 0.0) × 108 | 4 |
| NGC4441 | <6.6 × 10⁶ | <6.5 × 10⁶ | <6.2 × 10⁶ | (1.3 ± 0.4) × 108 | 6 |
| UGC 8058 | (1.5 ± 0.3) × 109 | (1.4 ± 0.3) × 109 | (5.0±1.1) × 108 | (4.7 ± 0.5) × 109 | 7 |
| AM 1300-233 | (9.2±2.4) × 107 | (1.7 ± 0.4) × 108 | <4.0 × 10⁷ | (2.3 ± 0.1) × 109 | 1 |
| Arp 193 | (2.3 ± 0.5) × 108 | (3.4 ± 0.7) × 108 | (1.1 ± 0.3) × 108 | (4.1 ± 0.8) × 109 | 8 |
| UGC 9829 | <7.1 × 10⁷ | <6.9 × 10⁷ | <6.6 × 10⁷ | ⋯ | ⋯ |
| NGC 6052 | <2.1 × 10⁷ | (4.4±1.1) × 107 | <1.9 × 10⁷ | (1.1 ± 0.0) × 109 | 9 |
| UGC 10675 | (1.1 ± 0.4) × 108 | <8.3 × 10⁷ | <7.9 × 10⁷ | (9.7 ± 0.5) × 108 | 10 |
| AM 2055-425 | (1.6 ± 0.4) × 108 | (3.5 ± 0.8) × 108 | <8.9 × 10⁷ | (6.5 ± 0.3) × 109 | 1 |
| NGC 7252 | (4.0±1.0) × 107 | (3.0 ± 0.8) × 107 | <1.6 × 10⁷ | (1.1 ± 0.1) × 109 | 1 |
Notes. Column 1: source name. Column 2–4: molecular line luminosities. The errors are estimated by taking into account the rms noise and calibration uncertainties (20%). Column 5: CO luminosity estimated from the integrated intensity measured within 24'' (Reference = 1) and literature values of the CO luminosity measured with the Institut de Radioastronomie Millimétrique (IRAM) 30 m telescope (Reference = 2–10) or the the National Radio Astronomy Observatory (NRAO) 12 m telescope (Reference = 11). Column 6: reference of the CO data.
References. (1) This work; (2) Herrero-Illana et al. (2019); (3) Bertram et al. (2006); (4) Costagliola et al. (2011); (5) García-Burillo et al. (2012); (6) Jütte et al. (2010); (7) Aladro et al. (2015); (8) Solomon et al. (1997); (9) Garland et al. (2005); (10) Zhu et al. (1999); (11) Sanders et al. (1991).
A machine-readable version of the table is available.
Download table as: DataTypeset image
4. Line Ratios of Dense Gas Tracers to 13CO
4.1. Dependence on the IR Luminosity
We calculate the intensity ratios of the dense gas tracers (HCN (1–0), HCO+(1–0), and HNC (1–0)) to 13CO (1–0) of 20 merger remnants detected in 13CO (1–0). The intensity ratios are shown as a function of the IR luminosity in Figure 2. Eleven out of 20 sources are U/LIRGs (LIR ≥ 1011 L☉), and the remaining nine sources are non-LIRGs (LIR < 1011 L☉). While the HCN/13CO and HCO+/13CO intensity ratios are higher than the unity for most of the U/LIRGs, they are lower than the unity for the non-LIRGs. On average, the HCN/13CO and HCO+/13CO intensity ratios of the U/LIRGs are 4.2 and 2.8 times higher than the non-LIRGs, respectively, suggesting different interstellar medium (ISM) environments. The HCN/13CO and HCO+/13CO intensity ratios of one ULIRG (UGC 8058) are higher than 10, which is 1 order of magnitude higher than those of the other U/LIRGs. Even when we exclude UGC 8058, the average HCN/13CO and HCO+/13CO ratios of the remaining ten U/LIRGs are 2.1 and 1.7 times higher than those of the non-LIRGs, respectively. Since all the HNC/13CO intensity ratios of the non-LIRGs are upper limits, it is difficult to investigate its dependency on the IR luminosity.

Figure 2. Plot of the HCN (1–0)/13CO (1–0), HCO+(1–0)/13CO (1–0), and HNC (1–0)/13CO (1–0) intensity ratios as a function of the IR luminosity.
Download figure:
Standard image High-resolution imageOne possibility for the elevated HCN/13CO and HCO+/13CO intensity ratios is a high dense gas fraction. Since the critical densities of HCN (1–0) and HCO+(1–0) are 2–3 orders of magnitude higher than that of 13CO (1–0) (Tielens 2005), the HCN (1–0) and HCO+ emission can trace the dense molecular gas. These elevated line ratios imply high dense gas fractions in the U/LIRGs, which are also suggested by high HCN (1–0)/12CO (1–0) ratios that we derive in Section 6.1. Another possibility is IR radiative pumping. HCN can be vibrationally excited to v2 = 1 by absorbing mid-IR (14 μm) photons (Carroll & Goldsmith 1981). Then, HCN can decay back to the vibrational-ground level (v = 0). The subsequent cascade from the J = 2 state can enhance the intensity of the HCN (1–0) emission compared to the case when the excitation is caused only by collisions (Sakamoto et al. 2010; Rangwala et al. 2011). However, several studies have concluded that the IR pumping is not the main mechanism to explain high HCN luminosities (e.g., Gao & Solomon 2004b; Imanishi et al. 2016). HCO+ has a similar vibrational bending state at 12 μm, but the excitation of HCO+ through IR radiative pumping is less than that of HCN (Imanishi et al. 2016). In this study, both HCO+/13CO and HCN/13CO ratios are enhanced in the U/LIRGs. The elevated line ratios can be partially but not fully explained by only IR pumping. A deficiency of 13CO is another possibility for the elevated line ratios in the U/LIRGs. It is known that the 13CO emission is unusually weak relative to 12CO in U/LIRGs. The 12CO/13CO line ratios exceed 20 and reach 50 for some sources (Aalto et al. 1991; Sliwa et al. 2017), which are much higher than the 12CO/13CO line ratio of disk galaxies (∼10; Paglione et al. 2001). Several scenarios can explain high 12CO/13CO ratios, including optical depth effects and abundance variations (e.g., Casoli et al. 1992b; Henkel & Mauersberger 1993).
4.2. Dependence on the CO Extent
We check the relationship between the spatial extent of molecular gas obtained from previous high-resolution CO imaging and the intensity ratios calculated in Section 4.1. Ueda et al. (2014) found that about half of the merger remnants have extended disks of molecular gas traced by the CO and suggest that those extended gas disks can rebuild stellar disks and form disk-dominated late-type galaxies (LTGs). On the other hand, the merger remnants with compact gas disks are candidates that could become early-type galaxies (ETGs).
In Figure 3, we plot the intensity ratios of 17 sources as a function of the size of the molecular gas disk relative to the stellar component (Rratio = R80/Reff in Table 1). R80 is the radius from the galactic center, which contains 80% of the CO flux, and Reff is the radius of the isophote containing half of the total K-band luminosity. Seven out of the 17 merger remnants with CO maps have molecular gas disks with Rratio > 1, and 10 sources have molecular gas disks with Rratio < 1. In general, the HCN/13CO, HCO+/13CO, and HNC/13CO ratios do not depend on Rratio. One galaxy (UGC 8058) stands out as having both exceptionally large Rratio and molecular line ratios and is the most IR luminous galaxy in our sample. When we exclude UGC 8058, the average HCN/13CO ratio of sources with Rratio > 1 (0.92 ± 0.29) is comparable to that of sources with Rratio < 1 (0.92 ± 0.15). Thus, the HCN/13CO intensity ratios are not likely to be affected by the different evolutionary pathways predicted by the CO spatial extent. This is suggested from the comparison of the HCN/13CO between ETGs and LTGs. The HCN/13CO intensity ratios of ETGs range from 0.18 to 0.58 (Krips et al. 2010; Crocker et al. 2012). They are consistent with the HCN/13CO intensity ratios of spiral galaxies and dwarf galaxies with normal SFRs (e.g., Krips et al. 2010; Matsushita et al. 2010; Watanabe et al. 2014). No significant difference between the different morphological types of galaxies (i.e., ETG and LTG) has been found.

Figure 3. The same as Figure 2, but the x-axis is the size of the molecular gas disk relative to the stellar component (Rratio; see the text for details).
Download figure:
Standard image High-resolution image5. Line Ratios Between Dense Gas Tracers
In the following sections, we use literature data of local U/LIRGs in the subsample of the Great Observatories All-sky LIRG Survey (GOALS) (Armus et al. 2009; Privon et al. 2015; Herrero-Illana et al. 2019) in order to compare the dense gas properties among different merger stages. The local U/LIRGs are classified into early-stage mergers, mid-stage mergers, late-stage mergers, and nonmerging LIRGs by visual inspection of the IRAC 3.6 μm images (Stierwalt et al. 2013). The late-stage merges may include postmergers (i.e., merger remnants). They are also classified into three groups (AGN-dominated systems, composite, and starburst (SB)-dominated systems) based on the equivalent width of the 6.2 μm polycyclic aromatic hydrocarbon (Privon et al. 2015). While there are no AGN-dominated systems in 13 early/mid-stage mergers and 19 nonmerging LIRGs, four out of 12 late-stage mergers are AGN-dominated systems. We also use literature data of LTGs in the sample of Gao & Solomon (2004a) as the control sample.
5.1. HCN (1–0)/HCO+(1–0) Ratio
It is proposed that a high HCN/HCO+ line ratio can be a tracer of AGN-dominated systems (Kohno et al. 2001; Imanishi et al. 2007), although the line ratio changes depending on the observed angular scale. For instance, the HCN (1–0)/HCO+(1–0) luminosity ratio of NGC 1068 is estimated to be 1.64 ± 0.03 from single-dish measurements (ΩPB ∼ 24''; Aladro et al. 2015). Meanwhile, it is ∼2.0 at the AGN position and its surrounding regions using interferometric measurements (θbeam ∼ 6''; Viti et al. 2014). Since the large beam of a single-dish covers various regions such as the nucleus, circumnuclear disk, and starburst ring of NGC 1068, the line ratio is affected by contaminations from those regions with different chemical compositions.
The HCN (1–0)/HCO+(1–0) luminosity ratios of the merger remnants are presented in Figure 4 (left). The mean  of the merger remnants is 0.88 ± 0.08. The line ratios of two merger remnants that host X-ray-detected AGNs are presented by the black open circles in Figure 4 (left). Although they are higher than the mean ratio, they are similar to other merger remnants within the errors. This result is consistent with the previous study by Privon et al. (2015). While they found that the HCN (1–0) emission is enhanced in AGN-dominated systems, some composite and SB-dominated systems have HCN/HCO+ line ratios, which are comparable to those of AGN-dominated systems. Therefore, the global low-J HCN/HCO+ line ratio should be treated with caution when it is used as an indicator of an AGN.
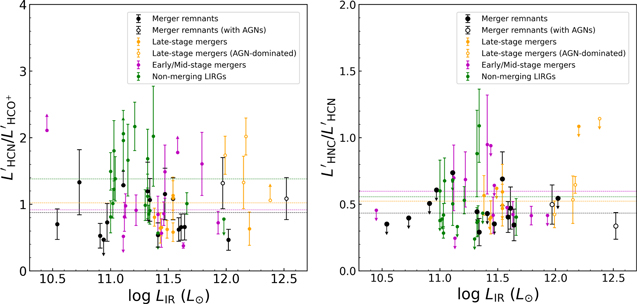
Figure 4. (left) Plot of the HCN (1–0)/HCO+(1–0) luminosity ratios as a function of the IR luminosity. The black circles show the merger remnants. The orange, magenta, and green circles show the late-stage mergers, early/mid-stage mergers, and nonmerging LIRGs, respectively, in the subsample of the GOALS (Privon et al. 2015). The open black circles and open orange circles show sources that host AGNs or AGN-dominated sources. Each dotted line presents the mean HCN/HCO+ luminosity ratio in each sample. (right) Plot of the HNC (1–0)/HCN (1–0) luminosity ratios as a function of the IR luminosity. The symbols and dotted lines are the same as those in the left figure.
Download figure:
Standard image High-resolution imageFor comparison, we plot the HCN/HCO+ luminosity ratios of 44 local U/LIRGs in the subsample of the GOALS (Privon et al. 2015) in Figure 4 (left). The mean  of the late-stage mergers and early/mid-stage mergers are 1.02 ± 0.15 and 0.92 ± 0.12, respectively (Table 5). The mean ratio of the late-stage mergers decreases to 0.77 ± 0.08 when the AGN-dominated systems are excluded. These mean ratios are consistent with that of the merger remnants. There is no significant difference among the different merger stages at kpc scales.
Table 5. Mean Luminosity Ratios of the Dense Gas Tracers
| Samples |

|

| References |
|---|---|---|---|
| Merger remnants | 0.88 ± 0.08 | 0.43 ± 0.05 | 1 |
| Late-stage mergers | 1.02 ± 0.15 | 0.52 ± 0.03 | 2 |
| Early/Mid-stage mergers | 0.92 ± 0.12 | 0.60 ± 0.09 | 2 |
| Nonmerging LIRGs | 1.38 ± 0.11 | 0.56 ± 0.07 | 2 |
References. (1) This work; (2) Privon et al. (2015).
Download table as: ASCIITypeset image
5.2. HNC (1–0)/HCN (1–0) Ratio
The HNC (1–0)/HCN (1–0) luminosity ratios of the merger remnants are presented in Figure 4 (right). The HNC/HCN luminosity ratios of seven merger remnants detected in both molecular lines range from 0.29 to 0.69, and the mean line ratio is 0.43 ± 0.05. The upper limits of  of nine merger remnants are below 0.74. These results are consistent with the previous measurements of local IR-bright galaxies (Cicone et al. 2020) and spiral galaxies (Jiménez-Donaire et al. 2019), and suggest PDR-dominated sources (Baan et al. 2008). We plot the HNC/HCN luminosity ratios of 44 local U/LIRGs (Privon et al. 2015) in Figure 4 (right). The HNC/HCN luminosity ratios of all the U/LIRGs except for one galaxy are lower than unity. The mean
  of the late-stage mergers and early/mid-stage mergers are 0.52 ± 0.03 and 0.60 ± 0.09, respectively (Table 5). These are consistent with the mean
  of the merger remnants within the errors. Both HNC/HCN and HCN/HCO+ line ratios do not show differences among the different merger stages in kpc scales.
The HNC/HCN line ratio has been proposed as a tool for probing the gas kinematic temperature (Tkin), based on observations toward the Galactic sources. The HNC/HCN abundance ratios are close to unity in dark cloud cores at lower temperatures (Hirota et al. 1998), whereas they are as low as ∼0.013 in the vicinity of the Orion KL hot cores (Schilke et al. 1992). The HNC/HCN abundance ratio seems to decrease with increasing temperature. This is supported by the chemical models that predict that HNC tends to be selectively destroyed by neutral–neutral reactions at higher temperatures (Graninger et al. 2014). According to the empirical calibration derived by Hacar et al. (2020), the HNC/HCN luminosity ratios of 0.31–0.70 correspond to Tkin = 14–32 K, which are lower than the typical Tkin of star-forming galaxies estimated from ammonia observations (Mangum et al. 2013). Moreover, the HNC/HCN luminosity ratio of one nonmerging LIRG exceeds unity, which corresponds to Tkin < 10 K. Such low kinetic temperatures are unusual for IR-bright galaxies (Tkin ≥ 40 K; Aalto et al. 2007). High HNC/HCN line ratios (>1) have been found in local U/LIRGs and could be explained by IR radiative pumping or by XDRs (Aalto et al. 2007). From these observational results, we conclude that it is unlikely that the HNC/HCN line ratio averaged across an extragalactic source can be used as a tracer of the gas kinetic temperature.
6. Dense Gas Fraction and Star Formation Efficiency
6.1. HCN (1–0)/CO (1–0) Ratio
The HCN (1–0)/CO (1–0) line ratio has been used as a proxy for the dense gas fraction (Gao & Solomon 2004b; Juneau et al. 2009). We calculate the HCN (1–0)/CO (1–0) luminosity ratios ( ) of 20 merger remnants when at least either HCN or CO luminosity was determined. We used literature values of
  measured with the IRAM 30 m telescope for 11/20 sources (Solomon et al. 1997; Zhu et al. 1999; Garland et al. 2005; Bertram et al. 2006; Jütte et al. 2010; Costagliola et al. 2011; García-Burillo et al. 2012; Aladro et al. 2015; Herrero-Illana et al. 2019). The beam of the IRAM 30 m telescope at ∼115 GHz (ΩPB ∼ 22'') is ∼2'' smaller than the LMT beam at ∼88 GHz (ΩPB ∼ 24''). To account for the unmatched beam sizes, we added an additional 20% uncertainty to the CO luminosity when calculating the HCN/CO luminosity ratio. We made the same correction to the CO luminosity for the control samples. We used literature
  of UGC 2238 measured with the National Radio Astronomy Observatory (NRAO) 12 m telescope (Sanders et al. 1991). The beam of the NRAO 12 m telescope (ΩPB ∼ 55'') is much larger than the LMT beam, and the past CO imaging study reveals that the CO emission is distributed inside and outside the LMT beam (RCO = 205; Ueda et al. 2014). Hence, we consider
  of UGC 2238 as a lower limit. We calculated
  of seven sources using the ALMA CO (1–0) maps. We measured the CO integrated intensity within 24'', which is the same as the LMT beam at ∼88 GHz. We added an additional 10% uncertainty to
  of NGC 3256 to account for the missing flux. Since the data of the remaining six sources were corrected with the zero-spacing information, we have not made any additional correction. Similarly, we measured
  of NGC 2782 using the PdBI CO (1–0) map (Hunt et al. 2008). Ueda et al. (2014) have found that the data suffer from missing flux. The recovered flux is 54%. We thus use
  of NGC 2782 as the lower limit. The literature and derived CO luminosities are summarized in Table 4.
The HCN/CO luminosity ratios of the 20 merger remnants are shown as a function of the IR luminosity in Figure 5. There is a positive correlation between  and LIR. In our sample, the average
  of the U/LIRGs is 3 times higher than that of the non-LIRGs. This suggests that the U/LIRGs have a higher dense gas fraction when compared to the non-LIRGs. The median
  of the merger remnants is 0.045 (Table 6). Adapting the standard luminosity-to-mass conversion factors (αCO = 4.35 M☉ (K km s−1 pc2)−1 and
  (K km s−1 pc2)−1; Gao & Solomon 2004b; Bolatto et al. 2013), the HCN/CO luminosity ratio of 0.045 corresponds to a dense gas fraction (Mdense/
 ) of ∼10%, where Mdense is the dense molecular gas mass and
  is the molecular gas mass. The largest HCN/CO luminosity ratios correspond to a dense gas fraction of order unity. It is known that the CO luminosity-to-mass conversion factor in U/LIRGs is lower than the standard value (e.g., αCO = 0.6–0.8; Downes & Solomon 1998; Papadopoulos et al. 2012). When a small αCO is adopted, the dense gas fraction increases.

Figure 5. Plot of the HCN (1–0)/CO (1–0) luminosity ratios as a function of the IR luminosity. The black circles show the merger remnants. The orange, magenta, and green circles show late-stage mergers, early/mid-stage mergers, and nonmerging LIRGs, respectively, in the GOALS sample. The blue circles show late-type galaxies. Each dotted line shows the median  of each sample. The numbers in the legend are references: (1) this work, (2) Privon et al. (2015), (3) Herrero-Illana et al. (2019), (4) Gao & Solomon (2004a).
Download figure:
Standard image High-resolution imageTable 6. Dense Gas Fraction, SFRdense, and SFE
| Samples |

|

|

| References | |||
|---|---|---|---|---|---|---|---|
| mean | median | mean | median | mean | median | ||
| Merger remnants | 0.070 ± 0.020 | 0.045 | (2.9 ± 0.5) × 103 | 2.4 × 10³ | 150±30 | 123 | 1 |
| Late-stage mergers | 0.093 ± 0.021 | 0.063 | (2.0 ± 0.3) × 103 | 2.1 × 10³ | 170±40 | 117 | 2,3 |
| Early/Mid-stage mergers | 0.093 ± 0.027 | 0.050 | (1.6 ± 0.5) × 103 | 1.3 × 10³ | 87±17 | 65 | 2,3 |
| Nonmerging LIRGs | 0.098 ± 0.012 | 0.078 | (8.5 ± 0.6) × 102 | 8.5 × 10² | 89±12 | 72 | 2,3 |
| Late-type galaxies | 0.061 ± 0.008 | 0.049 | (7.5±1.0) × 102 | 5.1 × 10² | 39±6 | 28 | 4 |
References. (1) This work; (2) Privon et al. (2015); (3) Herrero-Illana et al. (2019); (4) Gao & Solomon (2004).
Download table as: ASCIITypeset image
For comparison, we plot the HCN/CO luminosity ratios of the late-stage mergers, early/mid-stage mergers, and nonmerging galaxies (Privon et al. 2015; Herrero-Illana et al. 2019) and the LTGs (Gao & Solomon 2004b) in Figure 5. There appears to be little correlation between  and LIR for LIR < 1011
L☉, but
and LIR for LIR < 1011
L☉, but  is strongly correlated with LIR at higher LIR. The histogram of
  in each sample is shown in Figure 6 (left). We compute the Kolmogorov–Smirnov (K-S) statistic on the merger remnant sample and the control sample. The P-values from the K-S test are summarized in Table 7. The P-values for our sample and the samples in the different stages of mergers are large (≥0.38), suggesting that the populations are not significantly different. Numerical simulations predict that the dense gas fraction largely increases during the merging process, modifying the global gas density distribution of merging galaxies (e.g., Juneau et al. 2009; Bournaud 2011; Moreno et al. 2019). However, we do not find such a trend in this study, assuming that the same luminosity-to-mass conversion factors can be adopted for all the mergers regardless of the merger stages. The mean
  is consistent between the early/mid-stage and the late-stage (Table 6), and decreases in the postmerger stage. The HCN/CO luminosity ratios of the nonmerging LIRGs are relatively high (Figure 6), and the P-value for the merger remnants and the nonmerging LIRGs is small (≪0.05). This implies that a high dense gas fraction may play a crucial role in enhancing star formation in nonmerging galaxies, compared to merger remnants.

Figure 6. Histograms of the HCN (1–0)/CO (1–0) luminosity ratio (left), the IR-to-HCN (1–0) luminosity ratio (middle), and the IR-to-CO (1–0) luminosity ratio (right). The different colors show the different samples.
Download figure:
Standard image High-resolution imageTable 7. Kolmogorov–Smirnov Test P-value
| Samples |

|

|

|
|---|---|---|---|
| Merger remnants—Late-stage mergers | 0.38 | 0.53 | 0.95 |
| Merger remnants—Early/Mid-stage mergers | 0.81 | 0.03 | 0.04 |
| Merger remnants—Nonmerging LIRGs | ≪0.05 | ≪0.05 | 0.03 |
| Merger remnants—Late-type galaxies | 0.44 | ≪0.05 | ≪0.05 |
Download table as: ASCIITypeset image
6.2. IR-to-HCN (1–0) Luminosity Ratio
We calculate the IR-to-HCN (1–0) luminosity ratio, which is a proxy for the SFEdense (=SFR/Mdense). The IR/HCN luminosity ratios of the 21 merger remnants are shown as a function of the IR luminosity in Figure 7. While the luminosity ratios vary from source to source ((1.1–6.5) × 103
L☉/(K km s−1 pc2)), there is no dependency of  on LIR. The best-fit line for the merger remnants (the solid black line) is almost flat in Figure 7. This can be expected based on the well-known correlation between
  and LIR (Gao & Solomon 2004a). However, the mean
  of the merger remnants is about 4 times higher than the mean
  (∼776 L☉/(K km s−1 pc2)) derived using more than 800 data points of various sources, including resolved cores and giant molecular clouds (GMCs) in the Galaxy, resolved galaxy disks, and entire galaxies (Jiménez-Donaire et al. 2019).

Figure 7. Plot of the IR-to-HCN (1–0) luminosity ratios as a function of the IR luminosity. The symbols are the same as Figure 5. Each dotted line shows the mean  of each sample. The solid black line is the best-fit line for the merger remnant sample. The numbers in the legend are references: (1) this work, (2) Herrero-Illana et al. (2019), (3) Gao & Solomon (2004a).
Download figure:
Standard image High-resolution imageThe IR/HCN luminosity ratios of the control samples are also plotted in Figure 7. There appears to be a difference in  among the samples. The mean
  are (2.9 ± 0.5) × 103 for the 16 merger remnants with HCN detections, (2.0 ± 0.3) × 103 for the late-stage mergers, (1.6 ± 0.5) × 103 for the early/mid-stage mergers, (8.5 ± 0.6) × 102 for the nonmerging LIRGs, and (7.5 ± 1.0) × 102 for the LTGs in the unit of L☉/(K km s−1 pc2). We find that the mean ratio increases from the early-stage mergers to the late-stage mergers and the merger remnants (Table 6). The mean
  of the merger remnants is more than 3 times higher than those of the nonmerging LIRGs and the LTEs. The histogram of
  in each sample is shown in Figure 6 (middle). The K-S test gave P-value = 0.53 for our sample and the sample of late-stage mergers (Table 7). In contrast, it gave P-values smaller than 0.05 for our sample and the other three control samples, suggesting that the populations are different. According to García-Burillo et al. (2012), the SFEdense averaged across the entire galaxy varies for different galaxy types. They assembled a sample of ∼100 normal galaxies and U/LIRGs and found that
  is on average a few times higher in the U/LIRGs (∼1400 ± 100) compared to the normal galaxies (∼600 ± 70). However, in the merger remnant sample, not only U/LIRGs but also non-LIRGs show high
  . Along with our new finding that the IR/HCN luminosity ratio increases along the merger sequence, these results suggest that the SFEdense is enhanced during dynamical interactions and mergers.
6.3. IR-to-CO (1–0) Luminosity Ratio
We calculate the IR-to-CO (1–0) luminosity ratio, which is also a proxy for the SFE. The IR/CO luminosity ratios of the merger remnants and the control samples are plotted in Figure 8. The luminosity ratios are distributed over 2 orders of magnitudes and increase with the IR luminosity, suggesting that the SFE is enhanced in active star-forming galaxies. The mean  of the 18 merger remnants with CO detections is (1.5 ± 0.3) × 102
L☉/(K km s−1 pc2). This is comparable to the late-stage mergers ((1.7 ± 0.4) × 102
L☉/(K km s−1 pc2)) and about 2 times higher than those of the early/mid-stage mergers and the nonmerging LIRGs. These similarities and differences are also shown by the histograms of
of the 18 merger remnants with CO detections is (1.5 ± 0.3) × 102
L☉/(K km s−1 pc2). This is comparable to the late-stage mergers ((1.7 ± 0.4) × 102
L☉/(K km s−1 pc2)) and about 2 times higher than those of the early/mid-stage mergers and the nonmerging LIRGs. These similarities and differences are also shown by the histograms of  (Figure 6 (right)) and the results of the K-S test (Table 7). Overall, these results agree with the previous studies utilizing large samples of optically selected galaxies. As Violino et al. (2018) found using the depletion time (=1/SFE), the depletion time of the early-stage mergers, which are observed as galaxy pairs, are consistent with those of nonmerging LIRGs. Pan et al. (2018) found that the SFE is enhanced in closer pairs of equal-mass galaxies. We also find a similar trend that the SFE is enhanced in the merger remnants and the late-stage mergers, although the exact fraction of these samples that result from a major merger is unknown since it is difficult to reverse the chronology and disentangle the exact mass and morphology of the progenitors.

Figure 8. Plot of the IR-to-CO (1–0) luminosity ratios as a function of the IR luminosity. The symbols are the same as Figure 5. Each dotted line shows the median  of each sample. The numbers in the legend are references: (1) this work, (2) Privon et al. (2015), (3) Gao & Solomon (2004a).
Download figure:
Standard image High-resolution image6.4. High Star Formation Efficiency of Merger Remnants
We find that, on average, the IR/HCN and IR/CO luminosity ratios of the merger remnants are comparable to those of the late-stage mergers and higher compared to the early/mid-stage mergers, the nonmerging LIRGs, and the LTGs. This result suggests that not only the SFE but also the SFEdense are increased by dynamical interactions and mergers. In addition, the SFEs do not change significantly between pre- and post-coalescence. A high efficiency of converting gas into stars has been commonly proposed as a possibility for intense star formation in galaxy mergers. Recently observational studies have been conducted to check this enhancement (e.g., Michiyama et al. 2016; Pan et al. 2018; Violino et al. 2018). As seen in the previous sections, we investigate the SFEdense and SFE of galaxies at different stages of mergers, finding enhanced SFEdense in the merger remnants. The SFE enhancement in galaxy pairs and mergers has been predicted by simulations (e.g., Di Matteo et al. 2007; Moreno et al. 2020). The parsec-resolution simulation shows that the compressive turbulence generates an excess of dense gas along the merging process, leading to an enhanced SFE (Renaud et al. 2014). By using zoom-in simulations of major mergers identified in the cosmological simulation, Sparre & Springel (2016) find that the SFR enhancement is driven by the increase in the molecular gas reservoir during the galaxy-pair period, leading to an increased SFE close to the final coalescence. When the gas is compressed by dynamical interactions and reaches high densities, the star formation timescale is shorter than the cloud evaporation timescale, implying that a large fraction of the gas is converted into stars before the cold clouds are evaporated by thermal conduction. Therefore, stars form much more efficiently than normal star-forming gas. This zoom-in simulation also shows that the gas is turned into stars with high efficiency even after the final coalescence (Sparre & Springel 2016). Our result is consistent with this theoretical prediction, indicating that the merging process affects the star formation properties of the gas in the postmerger phase.
We recompare  between the merger remnants and the nonmerging LIRGs by matching the range of their LIR. We select sources with 1011(L⊙) ≤ LIR < 1012(L⊙) (i.e., LIRGs) from the merger remnant sample and plot
  as a function of
  in Figure 9. We find that these two samples occupy two different regions in the plot. The merger remnants show higher SFEdense and lower dense gas fraction, whereas the nonmerging LIRGs show lower SFEdense and higher dense gas fraction. This suggests that the different modes of star formation may be taking place in these samples. Merger remnants have a high SFEdense due to the ISM turbulence (Krumholz & McKee 2005), which could help compress the diffuse gas reservoirs, hence efficiently boosting star formation. On the other hand, star formation could be enhanced in nonmerging galaxies by increasing the dense gas. An enrichment of the molecular gas reservoir has also been proposed as a possibility for intense star formation.

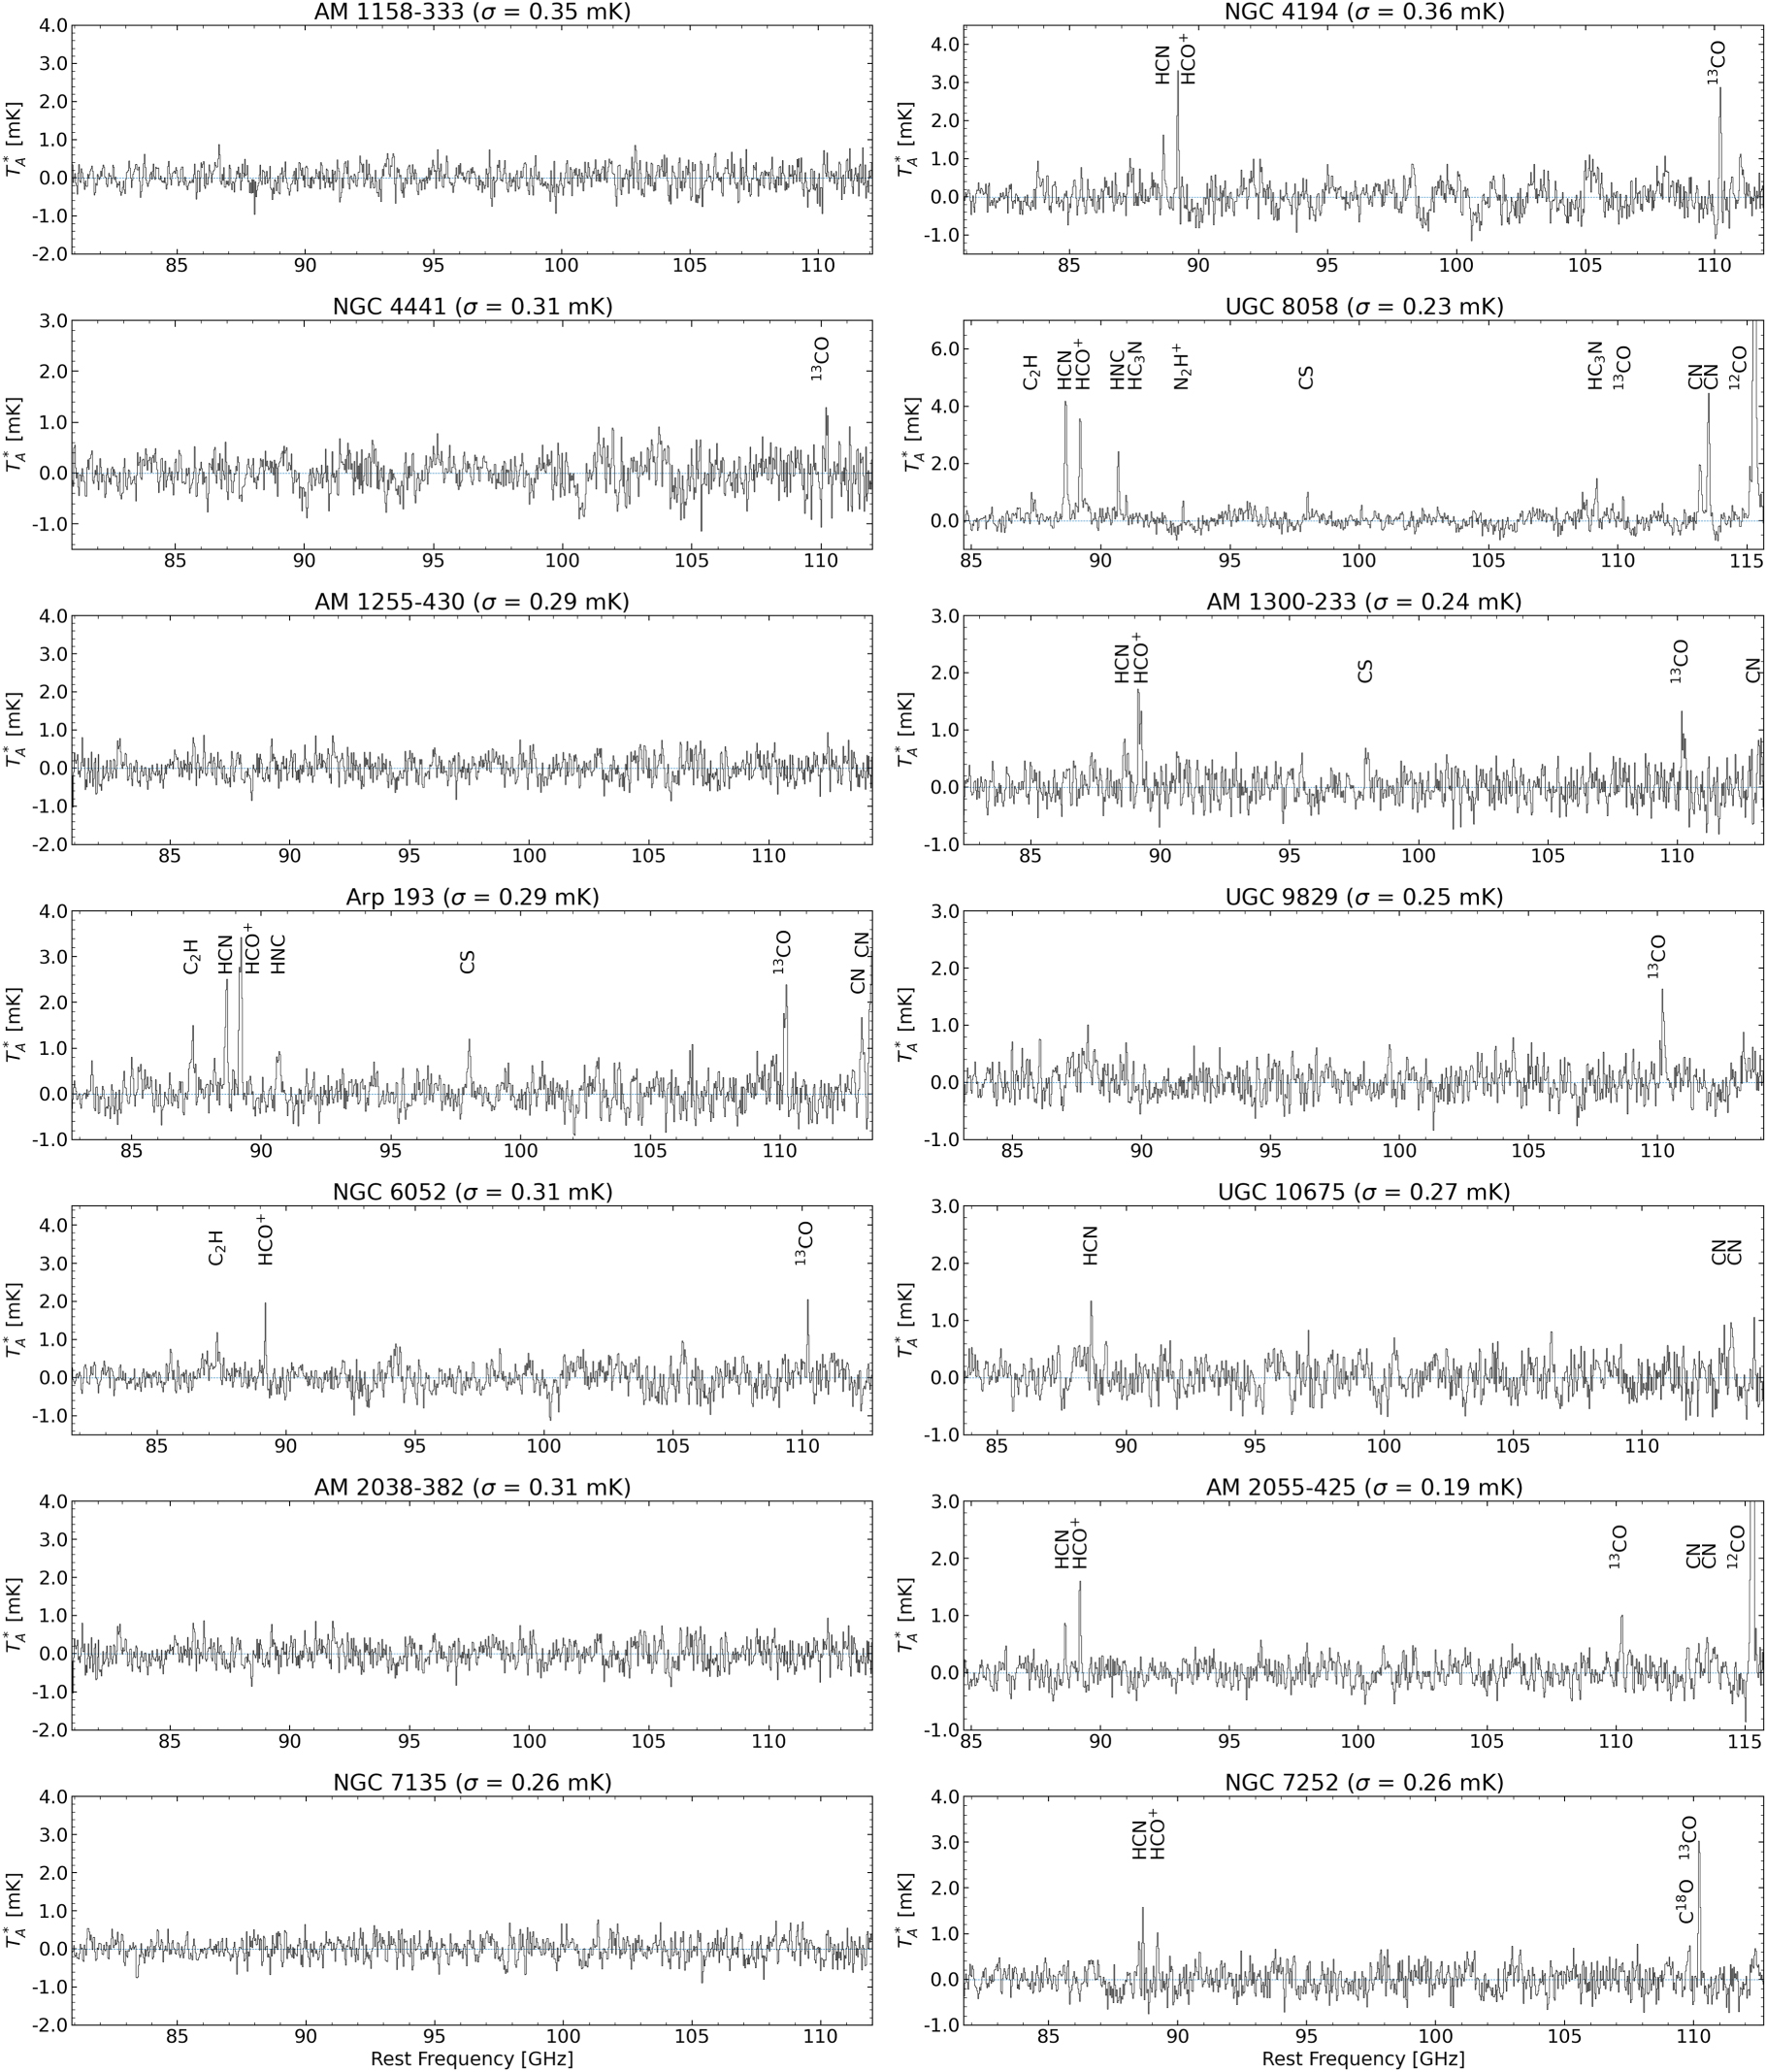
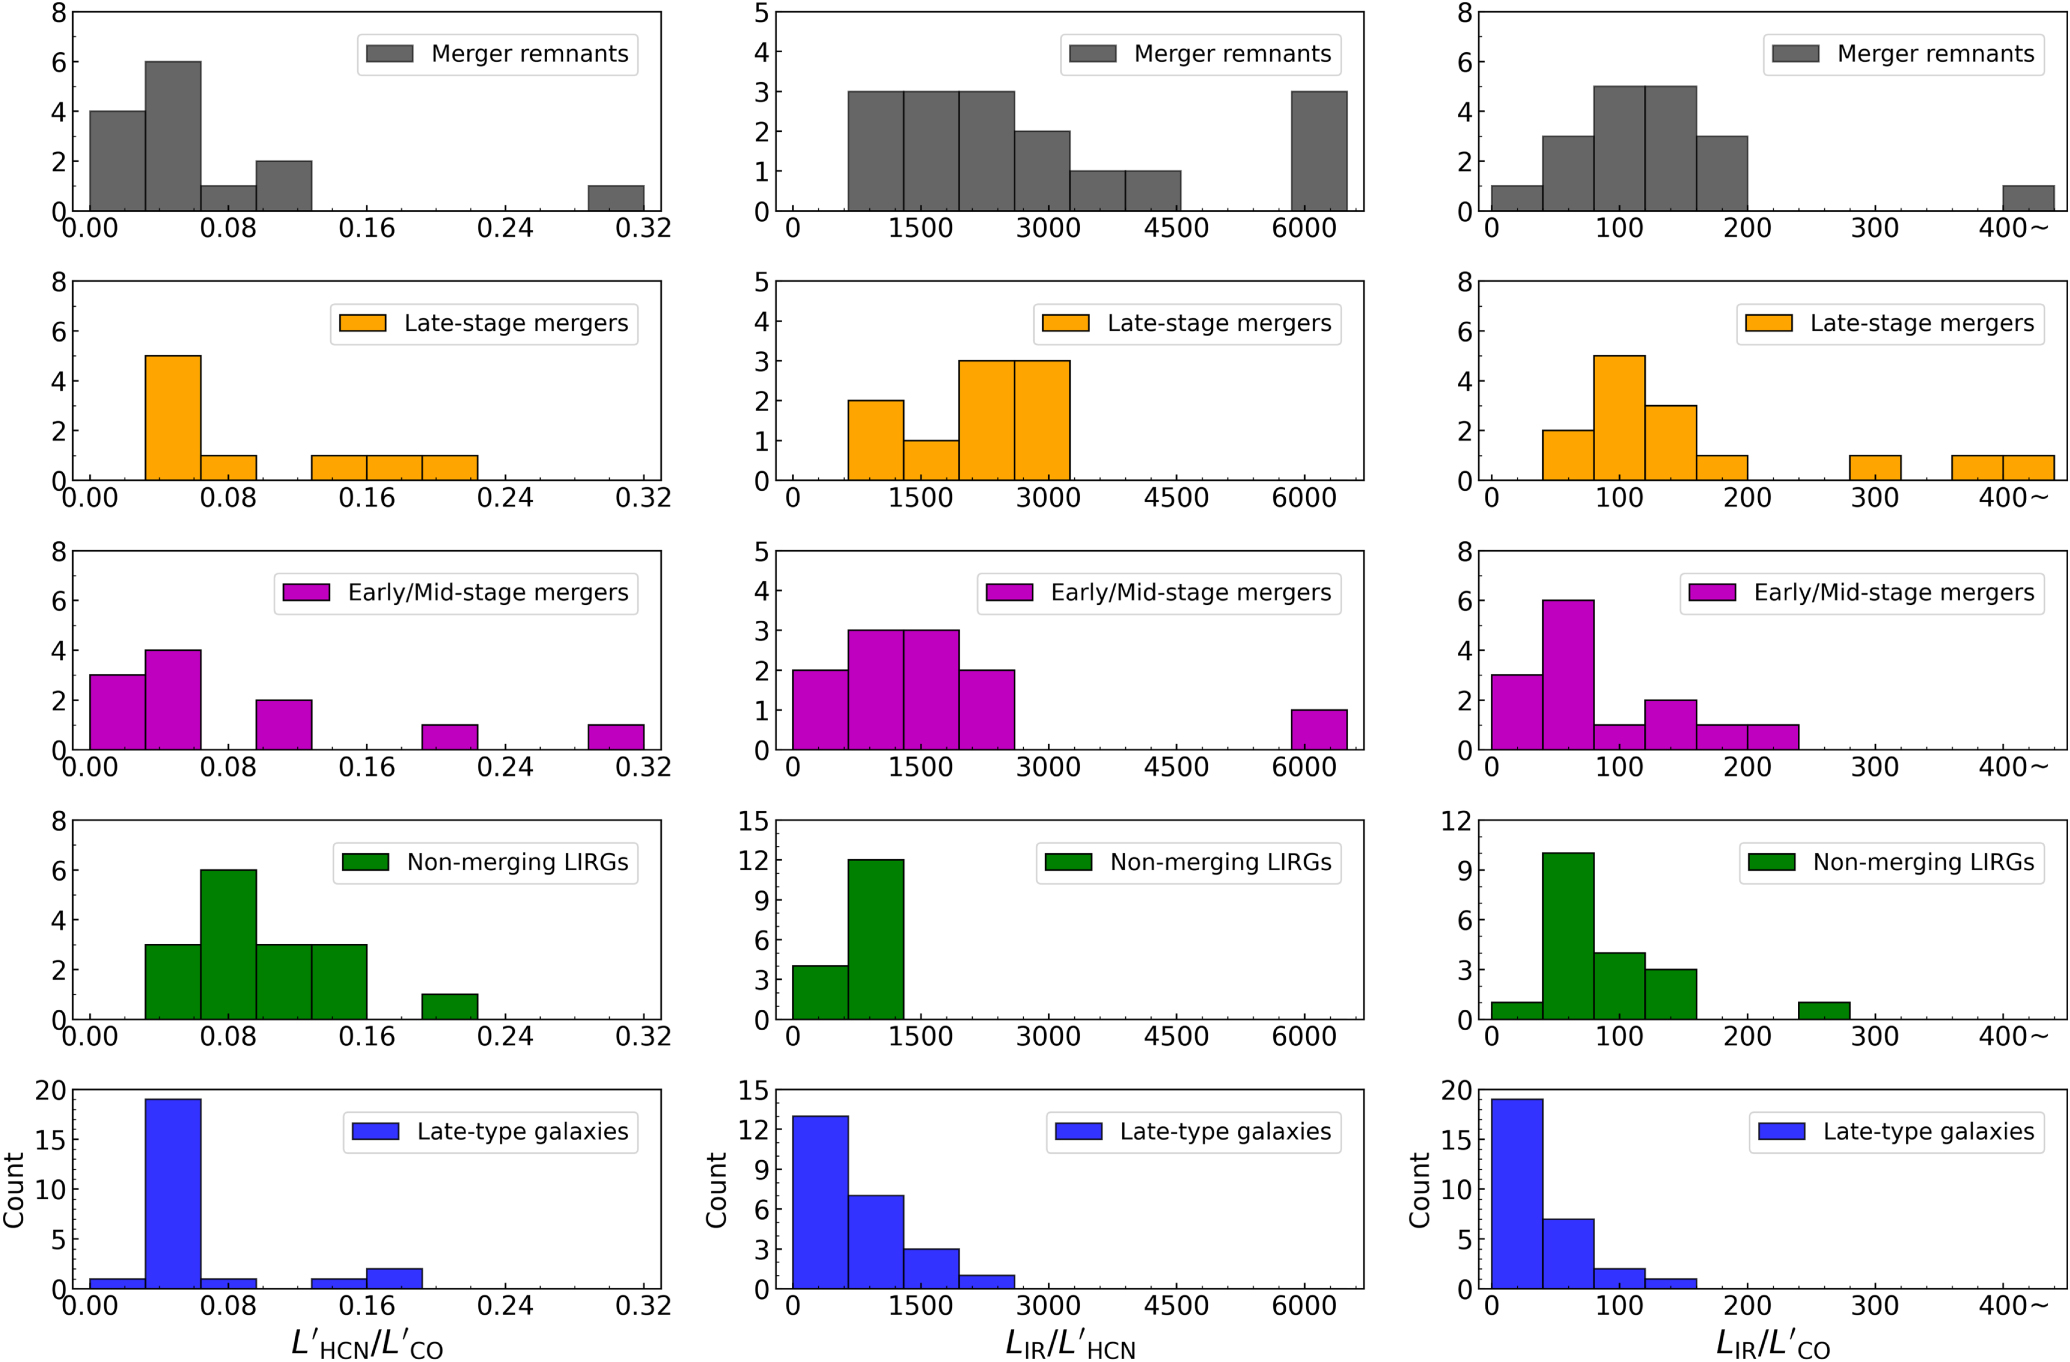
Figure 9. Plot of the IR-to-HCN (1–0) luminosity ratios as a function of the HCN (1–0)/CO (1–0) luminosity ratio. The black circles are the merger remnants, which are classified as LIRGs, and the green circles are the nonmerging LIRGs. The numbers in the legend are references: (1) this work, (2) Privon et al. (2015), (3) Herrero-Illana et al. (2019).
Download figure:
Standard image High-resolution image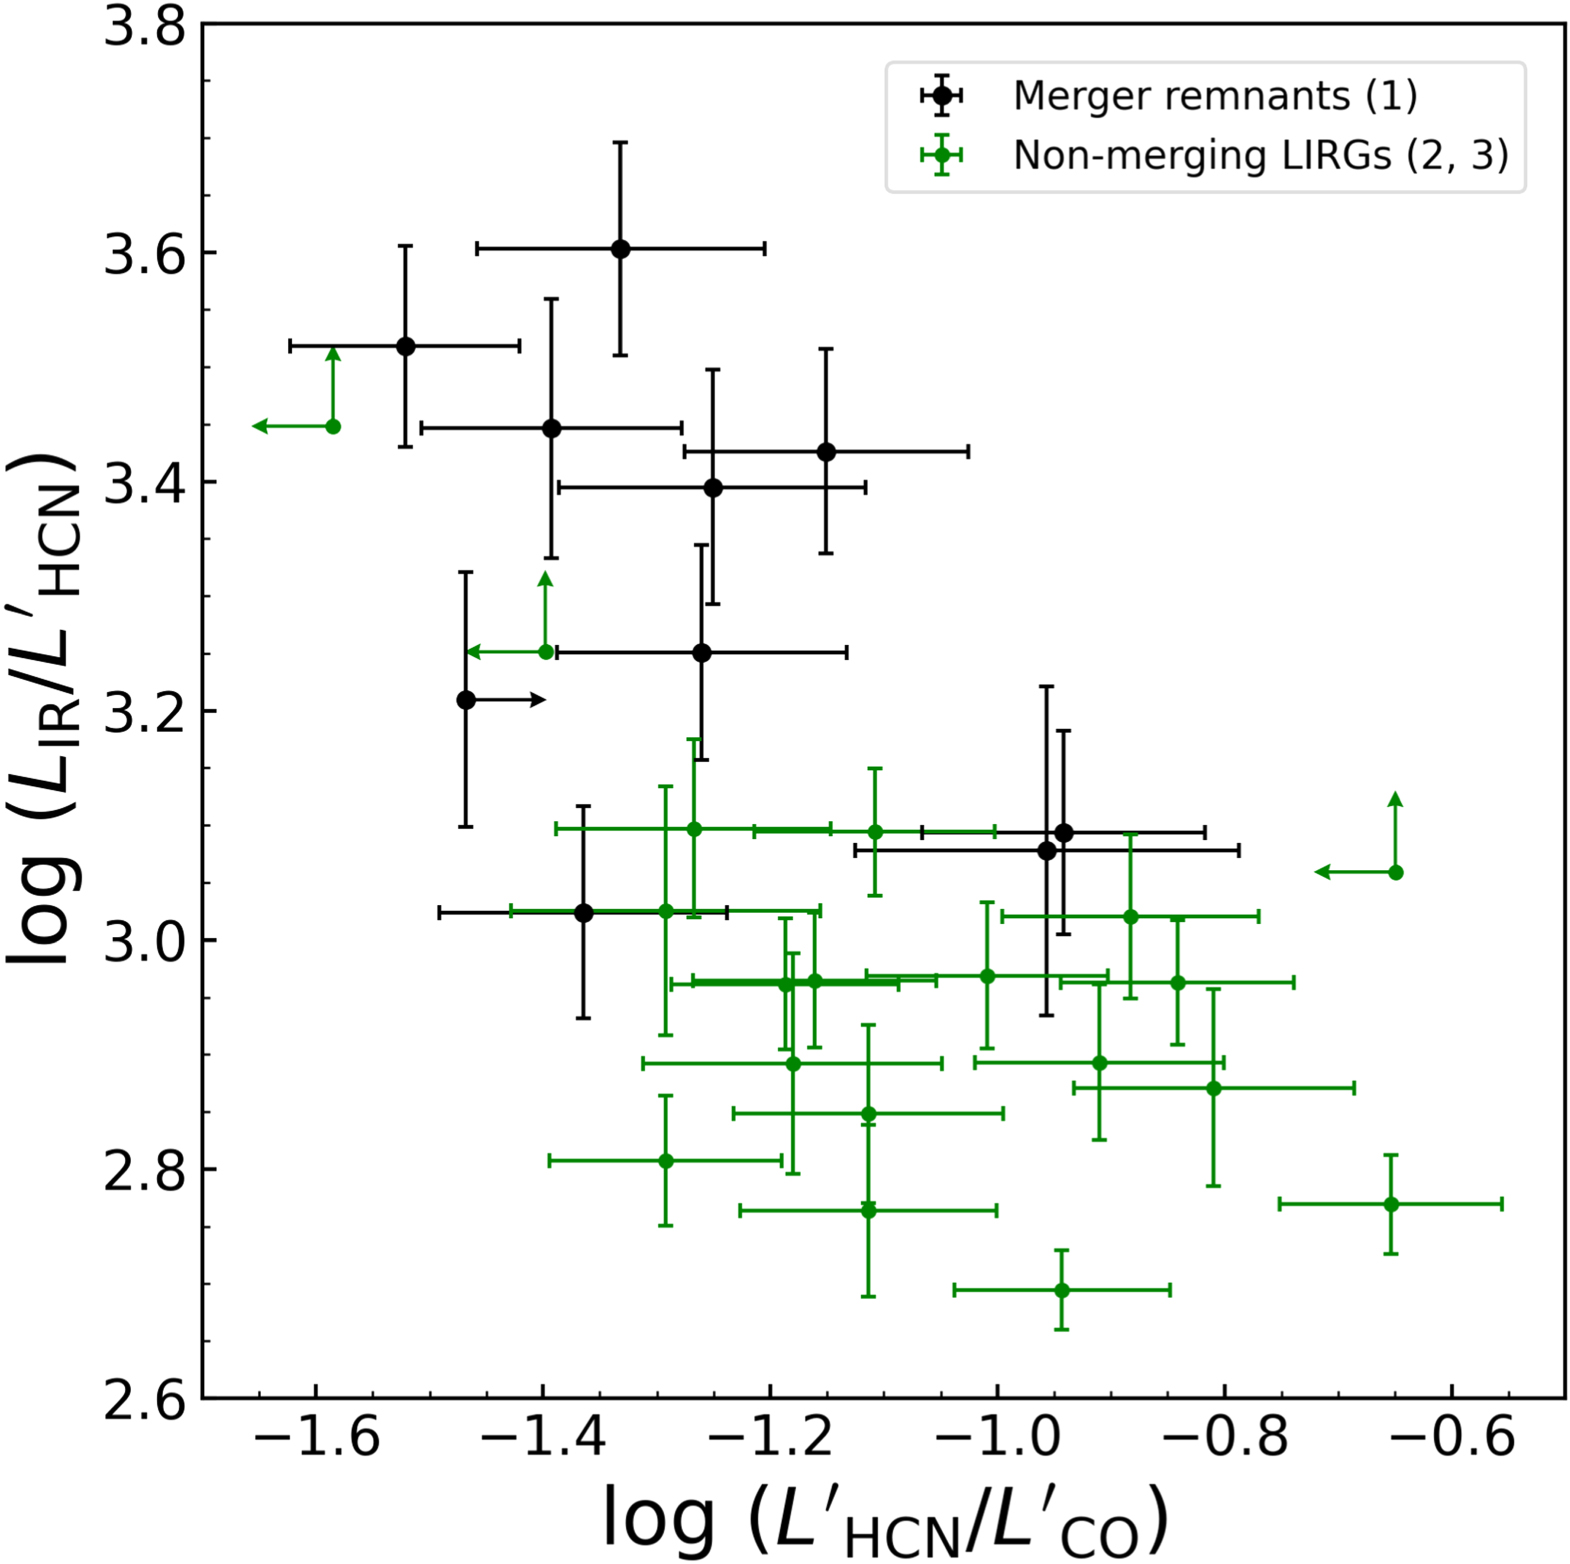
Another possibility for the different distributions presented in Figure 9 is that the conversion factor from the HCN luminosity into the dense gas mass ( ) is not the same between the merger remnants and the nonmerging LIRGs. If
  for the merger remnants is higher by a factor of ∼3 than
  for the nonmerging LIRGs, the data points of the merger remnants would shift toward the bottom right in Figure 9 and overlap with the distribution of the nonmerging LIRGs. The dense gas conversion factor derived by Gao & Solomon (2004b) has been widely used for all extragalactic environments. This conversion factor is derived under the assumption that the HCN (1–0) emission originates from a virialized cloud core with an average density of 3 × 104 cm−3 and a brightness temperature of 35 K. However, the dense gas conversion factor depends on various factors, such as the density and the excitation condition. If the brightness temperature of the HCN emitting clumps is larger than 35 K, or if their averaged density is less than 3 × 104 cm−3, the conversion factor can become smaller (Shimajiri et al. 2017). Several observational studies and simulations have investigated variations in
  (e.g., Krumholz & Tan 2007; Wu et al. 2010; Mills & Battersby 2017; Vollmer et al. 2017). Shimajiri et al. (2017) compare the HCN (1–0) luminosity in the Galactic GMCs with the dense molecular gas mass estimated from Herschel column density maps and suggest that variations in
  could be related to the far-ultraviolet field, that is, to gas excitation and/or chemistry variations. Onus et al. (2018) found that the dense gas conversion factor is
  M☉ (K km s−1 pc2)−1 using hydrodynamical simulations, but the uncertainty is a factor of ∼2 mainly due to variations in the HCN abundance. The dense gas conversion factor can vary from source to source, and the variation at a factor of ∼3 level could be plausible.
Another possibility is that the dense gas is rapidly depleted in the merger remnants, resulting in an apparent high SFEdense and a lower dense gas fraction. Di Matteo et al. (2007) found that an increase in the SFR is correlated with an increase in the SFE in modeled galaxy pairs and mergers, but the SFE peak is slightly delayed in time compared to the SFR peak for the most intense starbursts. The gas is more rapidly depleted by the merger-induced intense star formation, and then the amount of gas content decreases in merged galaxies. This condition can make an apparent high SFE as the SFEdense is computed by SFR/Mdense.
7. Summary
We have conducted multiline observations toward 28 merger remnants using the LMT. Twenty-one out of 28 sources were detected in at least one molecular line. Seventeen sources were detected in either the HCN (1–0) or the HCO+(1–0) lines, and 20 sources were detected in the 13CO (1–0) line.
First, we calculated the intensity ratios of the dense gas tracers (HCN (1–0), HCO+(1–0), and HNC (1–0)) to 13CO (1–0). Then we divided our sample into two groups categorized by their IR luminosities (U/LIRGs and non-LIRGs) and compared the line ratios between the two groups. There are significant differences in the line ratios. In particular, the HCN (1–0)/13CO (1–0) ratios are different between the U/LIRG and non-LIRG groups. This difference is likely caused by the deficiency of 13CO, the IR radiative pumping, and high dense gas fractions in the U/LIRGs.
On the other hand, we do not find any significant differences in the line ratios between the dense gas tracers between the U/LIRGs and the non-LIRGs in our sample. The HNC (1–0)/HCN (1–0) luminosity ratios of the merger remnants are all below 0.70, suggesting PDR-dominated sources. The HCN (1–0)/HCO+(1–0) luminosity ratios of two merger remnants that host X-ray-detected AGNs are consistent with other merger remnants within the errors. As demonstrated by previous studies, the global HCN/HCO+ line ratio is a less effective indicator of an AGN because of contaminations from the surrounding regions.
We calculate the HCN (1–0)/CO (1–0), IR-to-CO (1–0), and IR-to-HCN (1–0) luminosity ratios of the merger remnants and compare them with those of the control samples, including mergers in the different stages of mergers, nonmerging LIRGs, and LTEs. There is a positive correlation between  /LCO and LIR, suggesting that IR-bright galaxies have high dense gas fractions compared to normal galaxies. Contrary to the theoretical prediction, the measured
  /LCO, which is a proxy of the dense gas fraction, does not show an enhancement along the merger stages. We find that, on average, the IR/HCN and IR/CO luminosity ratios of the merger remnants are comparable to those of the late-stage mergers and a few times higher than those of the early/mid-stage mergers and the nonmerging LIRGs. This result suggests that (1) not only the SFE but also the SFEdense are increased by the mechanisms related to the dynamical interactions and mergers, such as the ISM turbulence, and that (2) these SFEs are enhanced even after the final coalescence, indicating that the merging process affects the star formation properties of the gas in the postmerger phase. Furthermore, the comparison between the merger remnants and the nonmerging LIRGs suggests that high dense gas fraction may play a crucial role in enhancing the star formation in nonmerging galaxies, while the SFEs are enhanced by the dynamical interactions in mergers, hence efficiently boosting star formation
We thank G. C. Privon for kindly providing the data of the IR luminosity of their sample.
We also thank the LMT staff members from the National Institute of Astrophysics, Optics and Electronics and the University of Massachusetts Amherst for making these observations possible.
This work was supported by JSPS KAKENHI grant No. JP19K14769. D.I. is supported by JSPS KAKENHI grant No. JP18H03725.
This paper makes use of the following ALMA data: ADS/JAO.ALMA#2011.0.00099.S, ADS/JAO.ALMA#2016.2.00006.S, ADS/JAO.ALMA#2016.2.00042.S, ADS/JAO.ALMA#2016.2.00094.S, ADS/JAO.ALMA#2017.1.01003.S, ADS/JAO.ALMA#2018.1.00223.S. ALMA is a partnership of ESO (representing its member states), NSF (USA) and NINS (Japan), together with NRC (Canada), MOST and ASIAA (Taiwan), and KASI (Republic of Korea), in cooperation with the Republic of Chile. The Joint ALMA Observatory is operated by ESO, AUI/NRAO and NAOJ.
This research has made use of the NASA/IPAC Extragalactic Database (NED), which is operated by the Jet Propulsion Laboratory, California Institute of Technology, under contract with the National Aeronautics and Space Administration.
Facilities: LMT - , ALMA. -
Software: astropy (Astropy Collaboration et al. 2013), CASA (McMullin et al. 2007), linmix (Kelly 2007).