


Abstract
We present the results of a systematic, broadband X-ray spectral analysis of nearby active galactic nuclei (AGNs) with the X-ray clumpy torus model (XCLUMPY). By adding 16 AGNs newly analyzed in this paper, we study a total of 28 AGNs, including unabsorbed and absorbed AGNs taken from Ichikawa et al. and García-Bernete et al. This is the largest sample whose X-ray and infrared spectra are analyzed by the clumpy torus models XCLUMPY and CLUMPY, respectively. The relation between the Eddington ratio and the torus covering factor determined from the X-ray torus parameters of each object follows the trend found by Ricci et al. based on a statistical analysis. We confirm the results by Tanimoto et al. that (1) the torus angular widths determined by the infrared data are larger than those by the X-ray data and (2) the ratios of hydrogen column density to V-band extinction (NH/AV) along the line of sight in obscured AGNs are similar to the Galactic value, on average. Unobscured AGNs show apparently smaller line-of-sight NH/AV ratios than the Galactic one. Our findings can be well explained by an updated unified picture of AGN structure including a dusty torus, dusty polar outflows, and dust-free gas, where the inclination determines the X-ray and optical classifications and observed torus properties in the X-ray and infrared bands.
Export citation and abstract BibTeX RIS
1. Introduction
Revealing the structure of an active galactic nucleus (AGN) "torus" that surrounds the accreting supermassive black hole (SMBH) is indispensable to understanding AGN feedback and feeding processes and thereby the origin of galaxy–SMBH coevolution (see, e.g., Ramos Almeida & Ricci 2017 for a recent review). The torus consists of dusty gas that absorbs radiation from the nucleus and produces reprocessed emission. Comparison of the X-ray and infrared spectra of an AGN gives us an important insight into the nature of the torus (e.g., Ricci et al. 2014; Baloković et al. 2018). In X-rays, the torus produces a reflection component accompanied by narrow fluorescence lines such as Fe Kα at 6.4 keV. The X-rays trace all material, including gas and dust, over a wide range of temperatures and hence are useful to probe the overall matter distribution around the SMBH. In contrast, the infrared data carry information on the properties of dust, which mainly emits blackbody radiation with a temperature of <1500 K. Thus, by combining the X-ray and infrared spectra, we can investigate both gas and dust properties. In such studies, it is desirable to apply self-consistent models to both X-ray and infrared data in terms of the torus geometry.
Many studies indicate that an AGN torus is not smooth but rather has a clumpy structure (see Tanimoto et al. 2019; Laha et al. 2020). To analyze the X-ray spectra of AGNs, Tanimoto et al. (2019) developed XCLUMPY, an X-ray spectral model from a clumpy torus based on the Monte Carlo simulation for Astrophysics and Cosmology (MONACO; Odaka et al. 2016) framework (see also Buchner et al. 2019 for similar work; they assume a torus geometry like that of Tanimoto et al. 2019). The definition of clump distribution in XCLUMPY is the same as that in the CLUMPY (Nenkova et al. 2008a, 2008b) model, which has been intensively used to analyze the infrared spectra of AGNs (Alonso-Herrero et al. 2011; Ichikawa et al. 2015; García-Bernete et al. 2019; Miyaji et al. 2019); clumps are distributed according to power-law and normal profiles in the radial and angular directions, respectively. This enables us to directly compare the results obtained from X-ray data with XCLUMPY and those from infrared data with CLUMPY and hence constrain the geometry of gas and dust distributions. In these models, the number density function d(r, θ, ϕ) in units of pc−3, where r is the radius, θ is the polar angle, and ϕ is the azimuth, is represented in the spherical coordinate system as

where N is the normalization, rin is the inner radius of the torus, and σ is the torus angular width. In XCLUMPY, the inner and outer radii of the torus, the radius of each clump, the number of clumps along the equatorial plane, and the index of the radial density profile are fixed at 0.05 pc, 1.00 pc, 0.002 pc, 10.0, and 0.50, respectively (Tanimoto et al. 2019). It has three variable torus parameters: hydrogen column density along the equatorial plane ( ), torus angular width (σX), and inclination angle (iX).
Utilizing XCLUMPY, several authors analyzed broadband X-ray spectra of nearby AGNs: Ogawa et al. (2019) for IC 4329A and NGC 7469 (unobscured AGNs), Tanimoto et al. (2019) for the Circinus galaxy (obscured AGN), Yamada et al. (2020) for UGC 2608 and NGC 5135 (obscured AGNs in luminous infrared galaxies), and Tanimoto et al. (2020) for 10 obscured AGNs (IC 5063, NGC 2110, NGC 3227, NGC 3281, NGC 5506, NGC 5643, NGC 5728, NGC 7172, NGC 7582, and NGC 7674). All of these objects except UGC 2608 are selected from Ichikawa et al. (2015), who studied their infrared spectra with the CLUMPY code. Ogawa et al. (2019) reported that the AGN tori in IC 4329A and NGC 7469 were dust-rich compared with the Galactic interstellar medium (ISM) by estimating the ratios of the hydrogen column density (NH) to V-band extinction (AV). Comparing the X-ray and infrared results of 12 absorbed AGNs (including Circinus and NGC 5135), Tanimoto et al. (2020) found that the torus angular widths determined from the infrared spectra are systematically larger than those from the X-ray data and suggested that this may be explained by a contribution from dusty polar outflows (e.g., Hönig et al. 2012, 2013) to the observed infrared flux. They also confirmed that a significant fraction of AGNs have dust-rich circumnuclear environments. However, the samples used in the previous studies are still limited in size, in order to construct a unified view of AGN tori by interpreting the results self-consistently. In particular, including more unobscured (type 1) AGNs in the sample is critical, because unobscured AGNs are generally viewed at lower inclination angles than obscured (type 2) ones and hence could provide us with independent information on the torus structure.
In this paper, we newly analyze the broadband X-ray spectra of 16 AGNs with the XCLUMPY model in a systematic way. Combining them with the sample studied by Tanimoto et al. (2020), we make a sample of 28 AGNs taken from Ichikawa et al. (2015) and García-Bernete et al. (2019), including 12 unobscured and 16 obscured AGNs. This is the largest sample whose X-ray and infrared data are analyzed with XCLUMPY and CLUMPY, respectively. Our aim is to establish a unified picture of the surrounding matter (gas and dust) around SMBHs in AGNs on the basis of comparison between the X-ray and infrared results. This paper is organized as follows. Section 2 describes the sample selection. Sections 3 and 4 describe the data reduction and X-ray spectral analysis for the 16 AGNs newly analyzed in this paper. The torus properties of the combined sample (28 AGNs) are discussed in Section 5. In Section 6, we interpret our results with an updated unified picture of AGN structure. We adopt the cosmological parameters of (H0, Ωm, ΩΛ) = (70 km s−1 Mpc−1, 0.27, 0.73) and the solar abundances of Anders & Grevesse (1989) throughout the paper. Errors on spectral parameters correspond to 90% confidence limits for a single parameter of interest.
2. Sample Selection
Our sample finally consists of 28 AGNs taken from a combined sample of Ichikawa et al. (2015) and García-Bernete et al. (2019),3 who utilized the CLUMPY code to fit the nuclear infrared spectra and derived the torus parameters (e.g., V-band extinction along the equatorial plane, the torus angular width, and the inclination). Among the 28 objects, two unobscured AGNs and 12 obscured AGNs come from Ichikawa et al. (2015), and 10 unobscured and four obscured ones are from García-Bernete et al. (2019).4 In this paper, we newly analyze broadband X-ray spectra of 16 AGNs (12 unobscured and four obscured) that were not analyzed in previous works (Tanimoto et al. 2019; Tanimoto et al. 2020; Yamada et al. 2020). Although the results of IC 4329A and NGC 7469 were already reported in Ogawa et al. (2019), we reanalyze their X-ray spectra with a slightly different model to perform a systematic analysis of the whole sample in a uniform way. The sample is listed with basic information in Table 1.
Table 1. Properties of the Targets
| Object | R.A. | Decl. | Redshift | Opt. Class | Group | X-Ray Ref. | Infrared Ref. |
|---|---|---|---|---|---|---|---|
| (1) | (2) | (3) | (4) | (5) | (6) | (7) | (8) |
| NGC 2992 | 09h45m42 050 050 |
−14d19m3498 |
0.00771 | 1.9 | Unobscured | a | e |
| MCG−5–23–16 | 09h47m40156 |
−30d56m5544 |
0.00849 | 2 | Unobscured | a | e |
| NGC 3783 | 11h39m01762 |
−37d44m1921 |
0.00973 | 1.5 | Unobscured | a | e |
| UGC 6728 | 11h45m16022 |
+79d40m5342 |
0.00652 | 1.2 | Unobscured | a | e |
| NGC 4051 | 12h03m09614 |
+44d31m5280 |
0.00234 | 1 | Unobscured | a | e |
| NGC 4395 | 12h25m48862 |
+33d32m4894 |
0.00106 | 1.8 | Unobscured | a | e |
| MCG−6–30–15 | 13h35m53707 |
−34d17m4394 |
0.00775 | 1.2 | Unobscured | a | e |
| IC 4329A | 13h49m19266 |
−30d18m3397 |
0.01605 | 1.2 | Unobscured | a | f |
| NGC 6814 | 19h42m40644 |
−10d19m2457 |
0.00521 | 1.5 | Unobscured | a | e |
| NGC 7213 | 22h09m16310 |
−47d09m5980 |
0.00584 | 1.5 | Unobscured | a | e |
| NGC 7314 | 22h35m46191 |
−26d03m0168 |
0.00476 | 1.9 | Unobscured | a | e |
| NGC 7469 | 23h03m15623 |
+08d52m2639 |
0.01632 | 1.2 | Unobscured | a | f |
| NGC 2110 | 05h52m11381 |
−07d27m2236 |
0.00779 | 2 | Obscured | b | f |
| NGC 3081 | 09h59m29539 |
−22d49m3460 |
0.00798 | 2 | Obscured | a | e |
| NGC 3227 | 10h23m305790 |
+19d51m54180 |
0.00386 | 1.5 | Obscured | b | f |
| NGC 3281 | 10h31m5209 |
−34d51m133 |
0.01067 | 2 | Obscured | b | f |
| NGC 4388 | 12h25m46747 |
+12d39m4351 |
0.00842 | 2 | Obscured | a | e |
| Centaurus A | 13h25m276152 |
−43d01m08805 |
0.00183 | 2 | Obscured | a | e |
| NGC 5135 | 13h25m4406 |
−29d50m012 |
0.01369 | 2 | Obscured | c | f |
| Circinus Galaxy | 14h13m09950 |
−65d20m2120 |
0.00145 | 2 | Obscured | d | f |
| NGC 5506 | 14h13m14892 |
−03d12m2728 |
0.00618 | 1.9 | Obscured | b | f |
| NGC 5643 | 14h32m40743 |
−44d10m2786 |
0.00400 | 2 | Obscured | b | f |
| NGC 5728 | 14h42m23897 |
−17d15m1109 |
0.00935 | 2 | Obscured | b | f |
| NGC 6300 | 17h16m5947 |
−62d49m140 |
0.00370 | 2 | Obscured | a | e |
| IC 5063 | 20h52m0234 |
−57d04m076 |
0.01135 | 2 | Obscured | b | f |
| NGC 7172 | 22h02m01891 |
−31d52m1080 |
0.00868 | 2 | Obscured | b | f |
| NGC 7582 | 23h18m23500 |
−42d22m1400 |
0.00525 | 2 | Obscured | b | f |
| NGC 7674 | 23h27m56724 |
+08d46m4453 |
0.02892 | 2 | Obscured | b | f |
Note. The sample is divided into two subgroups of unobscured (top) and obscured (bottom) AGNs. Column (1): galaxy name. Columns (2) and (3): position (J2000) from the NASA/IPAC Extragalactic Database (NED). Column (4): redshift from the NED. Column (5): optical AGN classification from the NED. Column (6): subgroup of AGNs based on X-ray obscuration. Column (7): reference for the X-ray results delivered by the XCLUMPY model. Column (8): reference for the infrared results delivered by the CLUMPY code.
References. (a) This work; (b) Tanimoto et al. (2020); (c) Yamada et al. (2020); (d) Tanimoto et al. (2019); (e) García-Bernete et al. (2019); (f) Ichikawa et al. (2015).
Download table as: ASCIITypeset image
3. Observations and Data Reduction
We analyze the broadband X-ray spectra of 16 AGNs that cover the energy band from ∼0.3 to several tens of keV observed with Suzaku (Mitsuda et al. 2007), XMM-Newton (Jansen et al. 2001), and/or NuSTAR (Harrison et al. 2013). The data sets we utilize are chosen in the following way. As for unobscured AGNs with absorption column densities of NH ≲ 1022 cm−2, we only use broadband data that were observed simultaneously (within a few days) in the energy bands above and below 10 keV, considering their fast spectral variability (see, e.g., Iso et al. 2016). If NuSTAR data are available with simultaneous Suzaku or XMM-Newton observations, we analyze NuSTAR focal plane module (FPM) data plus Suzaku X-ray imaging spectrometer (XIS) or XMM-Newton European Photon Imaging Camera (EPIC) data; otherwise, we analyze Suzaku/XIS and hard X-ray detector (HXD) data. As for obscured AGNs, we do not require the broadband data to be simultaneously observed, and we analyze NuSTAR/FPM and Suzaku/XIS data. Since NGC 3081 has not been observed with NuSTAR, we utilize the Suzaku/XIS and HXD data. The observation log for the 16 AGNs analyzed in this paper is summarized in Table 2. Details of the data reduction are described below.
Table 2. Summary of X-Ray Observations
| Object | Satellite | ObsID | Start Date (UT) | End Date (UT) | Exposure (ks)a |
|---|---|---|---|---|---|
| Unobscured AGNs | |||||
| NGC 2992 | XMM-Newton | 0840920301 | 2019 May 9 21:17 | 2019 May 11 10:07 | 94 |
| NuSTAR | 90501623002 | 2019 May 10 00:51 | 2019 May 11 10:21 | 57 | |
| MCG−5–23–16 | Suzaku | 708021010 | 2013 Jun 1 22:06 | 2013 Jun 5 05:55 | 160 |
| NuSTAR | 60001046002 | 2013 Jun 3 08:21 | 2013 Jun 7 20:21 | 157 | |
| NGC 3783 | XMM-Newton | 0780861001 | 2016 Dec 21 08:59 | 2016 Dec 22 00:24 | 39 |
| NuSTAR | 80202006004 | 2016 Dec 21 10:41 | 2016 Dec 21 23:21 | 25 | |
| UGC 6728 | Suzaku | 704029010 | 2009 Jun 6 13:33 | 2009 Jun 7 12:18 | 49 |
| NGC 4051 | XMM-Newton | 0830430801 | 2018 Nov 9 09:48 | 2018 Nov 10 09:02 | 59 |
| NuSTAR | 60401009002 | 2018 Nov 4 12:56 | 2018 Nov 11 14:46 | 303 | |
| NGC 4395 | Suzaku | 702001010 | 2007 Jun 2 14:30 | 2007 Jun 5 07:09 | 102 |
| MCG−6–30–15 | XMM-Newton | 069378120 | 2013 Jan 29 12:14 | 2013 Jan 31 01:24 | 95 |
| NuSTAR | 60001047003 | 2013 Jan 30 00:11 | 2013 Feb 2 00:41 | 127 | |
| IC 4329A | Suzaku | 707025010 | 2012 Aug 13 02:13 | 2012 Aug 14 10:53 | 118 |
| NuSTAR | 60001045002 | 2012 Aug 12 16:06 | 2012 Aug 14 13:12 | 162 | |
| NGC 6814 | Suzaku | 706032010 | 2011 Nov 2 16:46 | 2011 Nov 3 15:18 | 42 |
| NGC 7213 | Suzaku | 701029010 | 2006 Oct 22 05:34 | 2006 Oct 24 06:37 | 91 |
| NGC 7314 | XMM-Newton | 0790650101 | 2016 May 14 13:06 | 2016 May 15 06:44 | 45 |
| NuSTAR | 60201031002 | 2016 May 13 12:21 | 2016 May 15 18:51 | 100 | |
| NGC 7469 | XMM-Newton | 0760350201 | 2015 Jun 12 13:36 | 2015 Jun 13 14:50 | 91 |
| NuSTAR | 60101001002 | 2015 Jun 12 18:41 | 2015 Jun 13 00:40 | 22 | |
| Obscured AGNs | |||||
| NGC 3081 | Suzaku | 703013010 | 2008 Jun 18 21:49 | 2008 Jun 19 19:33 | 44 |
| NGC 4388 | Suzaku | 800017010 | 2005 Dec 24 09:04 | 2005 Dec 27 06:00 | 122 |
| NuSTAR | 60061228002 | 2013 Dec 27 06:46 | 2013 Dec 27 17:26 | 21 | |
| Centaurus A | Suzaku | 708036010 | 2013 Aug 15 04:22 | 2013 Aug 15 10:14 | 11 |
| NuSTAR | 60001081002 | 2013 Aug 6 13:01 | 2013 Aug 7 16:06 | 51 | |
| NGC 6300 | Suzaku | 702049010 | 2007 Oct 17 12:20 | 2007 Oct 19 09:00 | 83 |
| NuSTAR | 60261001004 | 2016 Aug 24 08:31 | 2016 Aug 24 20:51 | 22 | |
Note.
aBased on the good time interval of XIS 0 for Suzaku, EPIC-pn for XMM-Newton, and FPMA for NuSTAR.Download table as: ASCIITypeset image
3.1. Suzaku
Suzaku carried four X-ray CCD cameras called the XIS, which covered an energy band below ≈10 keV. The XIS 0, XIS 2, and XIS 3 are front side–illuminated CCDs (XIS-FI), and XIS 1 is a backside-illuminated one (XIS-BI). Suzaku also carried a collimated-type instrument called the HXD, which was sensitive to photons above ≈10 keV. The HXD consisted of the PIN (10–70 keV) and GSO (40–600 keV) detectors. We did not analyze any GSO data in this paper, because most of our targets were too faint to be detected with the GSO.
We reduced Suzaku data in a standard way, utilizing HEAsoft version 6.26.1 and CALDB released on 2018 October 10 (XIS) and 2011 September 13 (HXD). We reprocessed the unfiltered XIS event data with the aepipeline script. The XIS source events were extracted from a circular region with a radius of 3'–4' (depending on the source flux) centered at the source position, and the background was taken from a source-free circular region with a radius of 2'–3'. For NGC 4388, we utilized the same background spectrum as used in Shirai et al. (2008), which was produced from the data of Arp 220 observed on 2006 January 7–9, because there was a largely extended emission around the nucleus of NGC 4388. We generated the response matrix file (RMF) with xisrmfgen and ancillary response file (ARF) with xissimarfgen (Ishisaki et al. 2007). The spectra of XIS-FIs were coadded in order to improve the statistics. We utilized only the data of XIS-FIs, whose effective area in the iron K band was larger than that of XIS-BI.
The unfiltered HXD-PIN data were also reprocessed by using aepipeline. We made the spectrum of the non-X-ray background (NXB) using the "tuned" background event files (Fukazawa et al. 2009).5 We added a simulated spectrum of the cosmic X-ray background to the spectrum of the NXB. In the spectral analysis, only the 16–40 keV range was utilized, where the source flux is sure to be brighter than 3% of the NXB level (the maximum systematic error in the 15–70 keV range; Fukazawa et al. 2009).
3.2. XMM-Newton
There are three X-ray CCD cameras on XMM-Newton: one EPIC/pn and two EPIC/MOS. We did not use the data of the MOS cameras, which have a much smaller effective area than the pn camera. We analyzed the pn data using the Science Analysis Software (SAS) version 17.0.0 and calibration file (CCF) released on 2018 June 22. We reprocessed the data with the epproc script. The source spectra were extracted from a circular region with a radius of 40'' centered on the source peak and the background from a source-free circular region with a 50'' radius in the same CCD chip. The RMF and ARF were generated with rmfgen and arfgen, respectively.
3.3. NuSTAR
NuSTAR carries two FPMs (FPMA and FPMB), which cover an energy range of 3–79 keV. The FPM data were analyzed with HEAsoft v6.26.1 and CALDB released on 2019 October 12. The spectra were extracted from a circular region with a 50''–75'' radius (depending on the source flux) centered at the source peak, and the background was taken from a nearby source-free circular region with a 60''–75'' radius. The source spectra, background spectra, RMF, and ARF of the two FPMs are combined with addascaspec.
4. X-Ray Spectral Analysis
We perform a simultaneous spectral fit to the Suzaku/XIS (0.5–10 keV), Suzaku/HXD-PIN (16–40 keV), XMM-Newton/EPIC-pn (0.3–10 keV), and/or NuSTAR/FPMs (3–70 keV) spectra. The combination of spectra we adopt depends on each target, as explained in Section 3. The spectra folded with the energy responses are plotted in the left panels of Figures 1 and 2 for unobscured and obscured AGNs, respectively. Different spectral models are adopted for unobscured and obscured AGNs. In both cases, we utilize the XCLUMPY model to represent the reflection component from the torus. The details of the models are described below.

Download figure:
Standard image High-resolution image
Download figure:
Standard image High-resolution image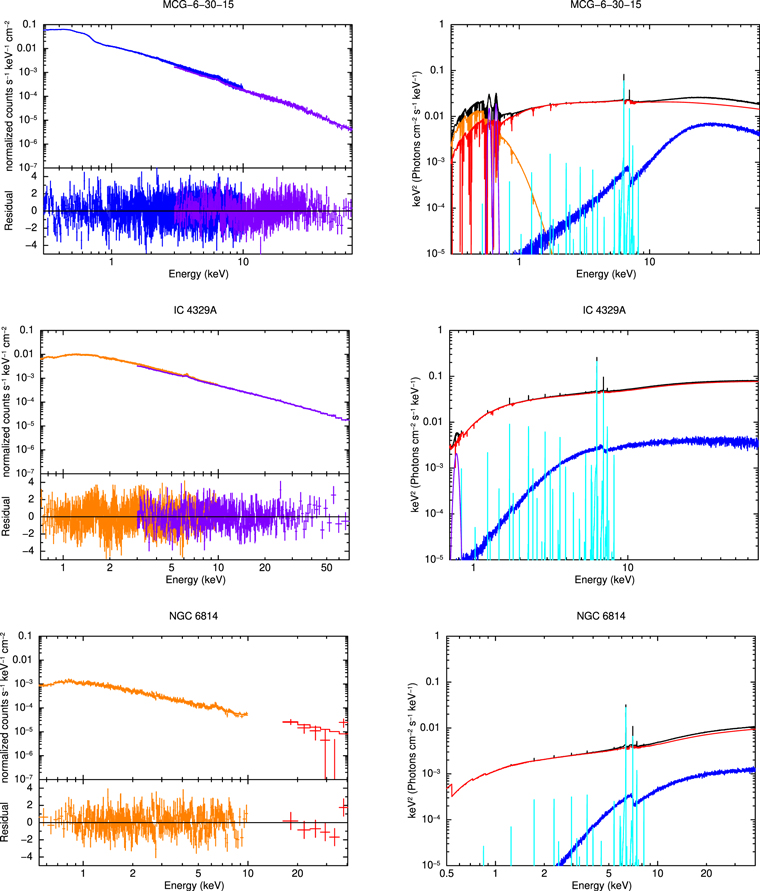
Download figure:
Standard image High-resolution image
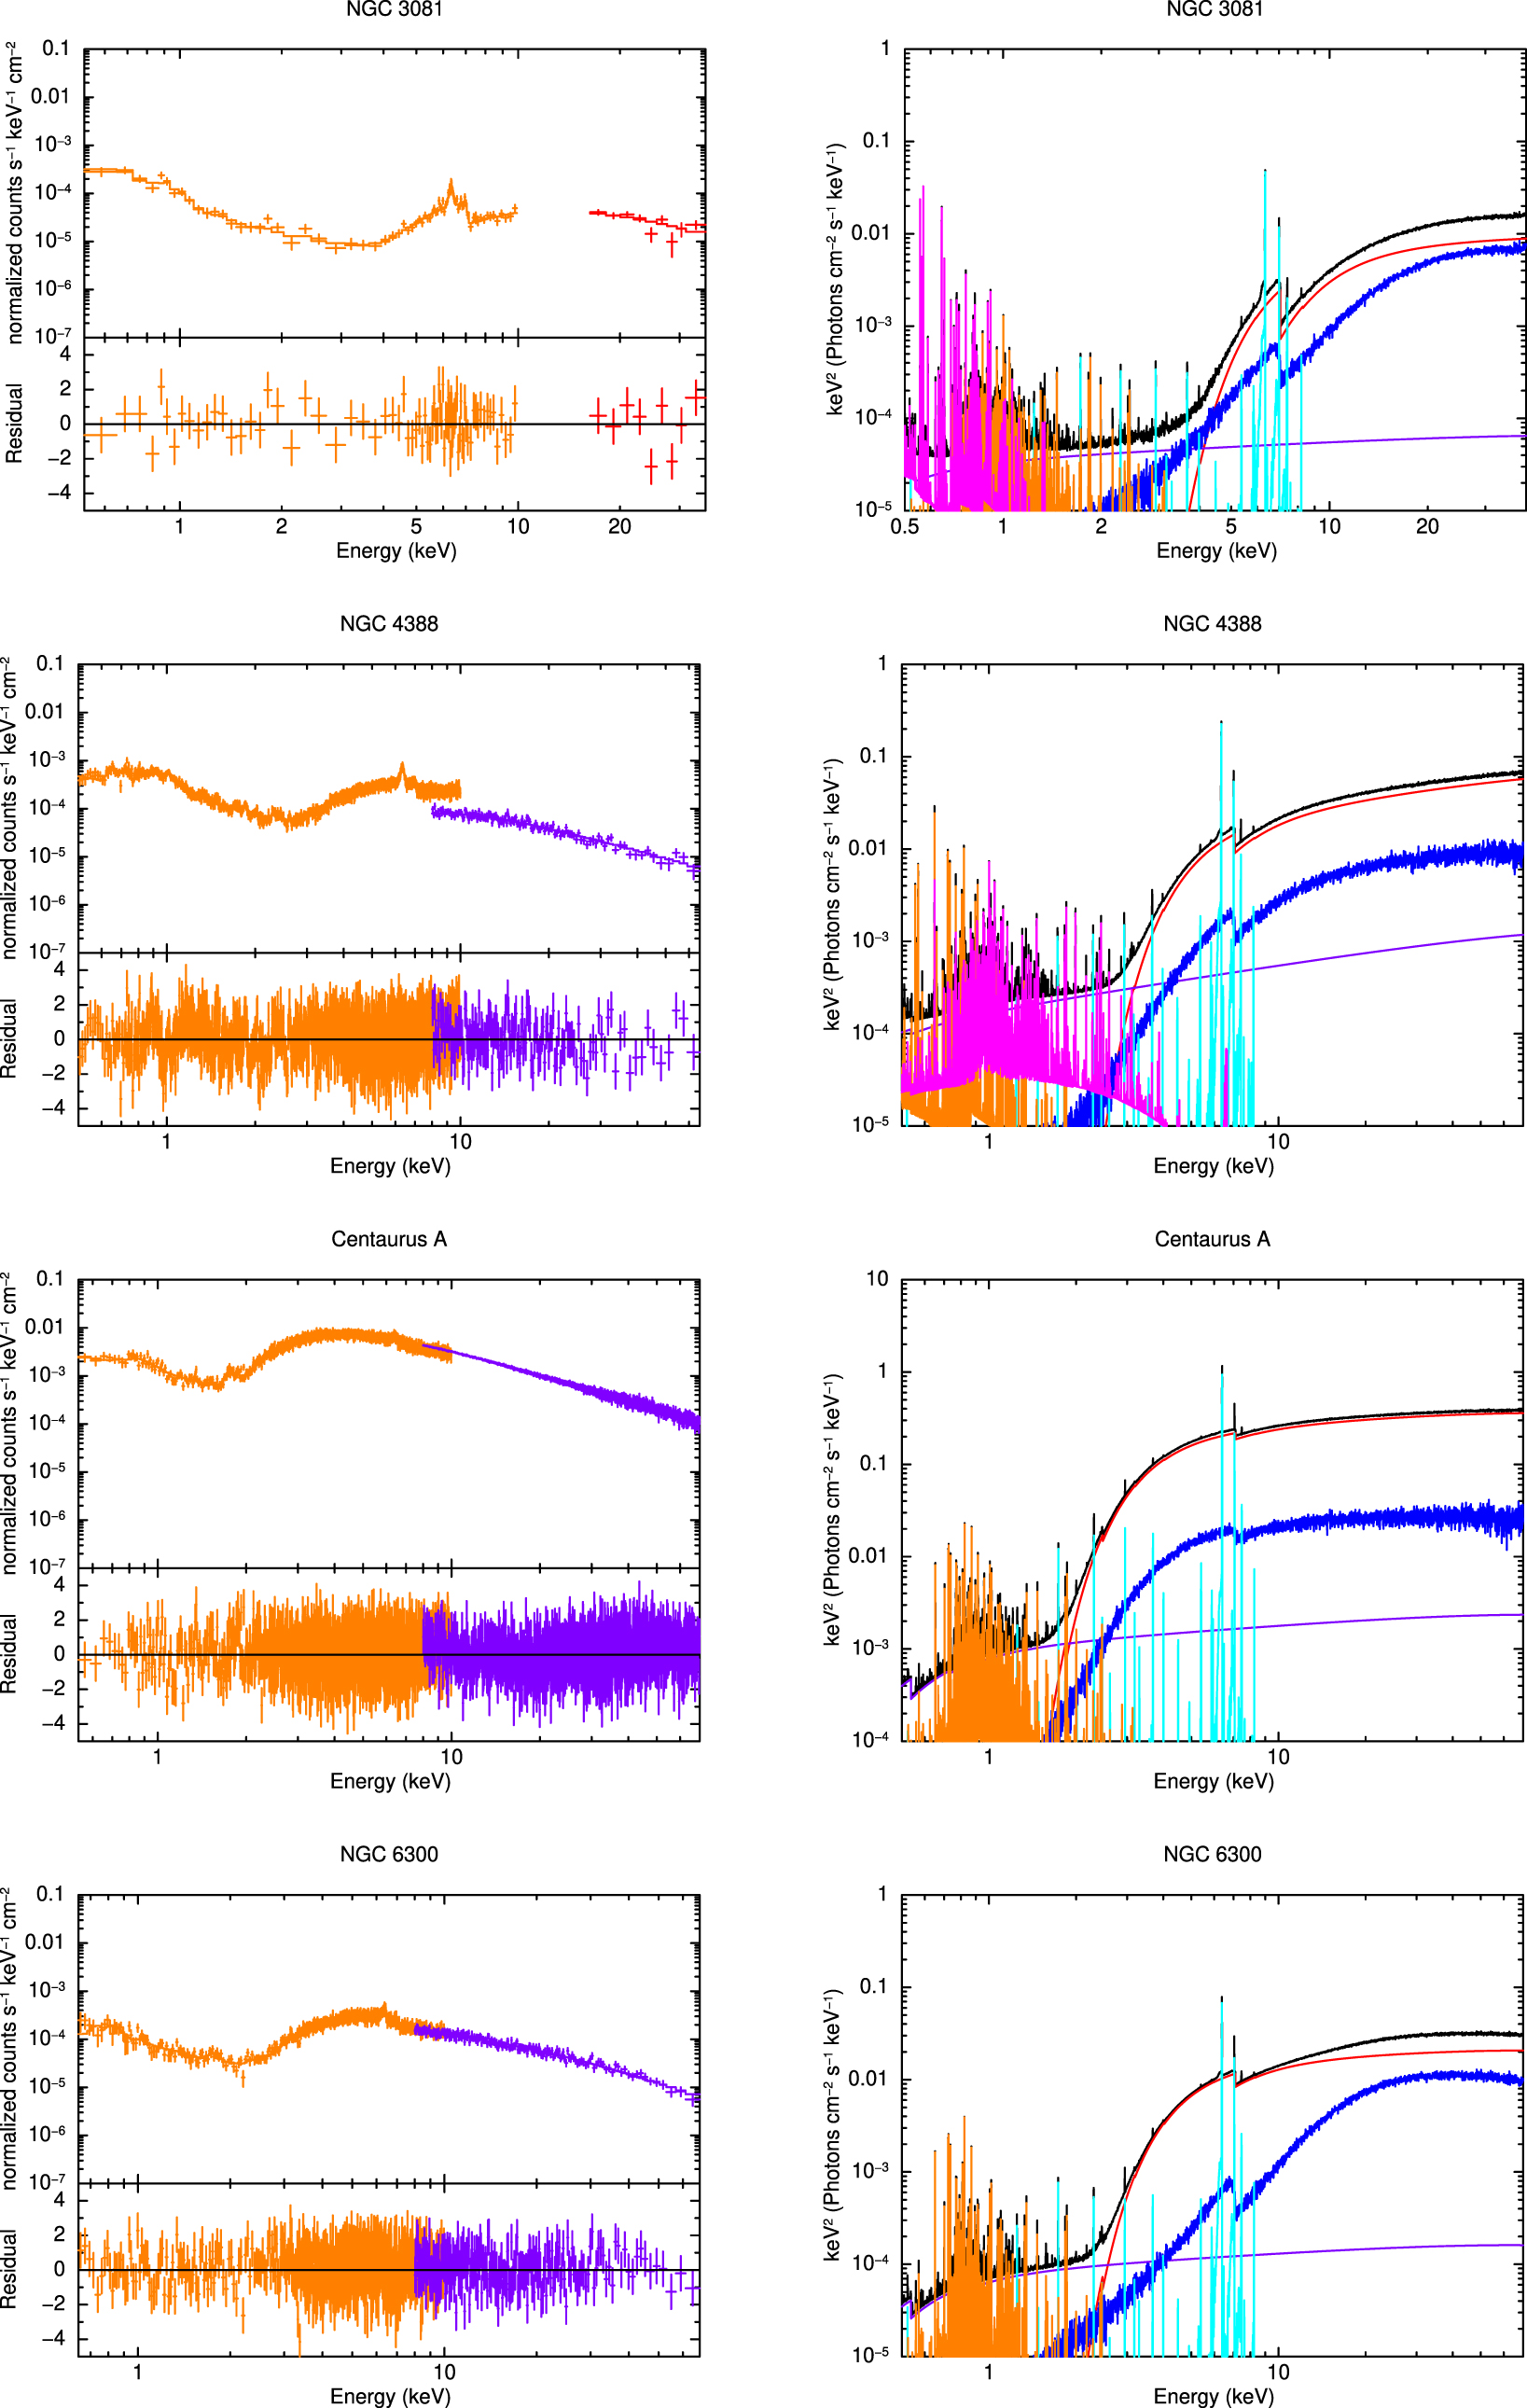
Figure 1. Left: observed broadband spectra of the unobscured AGNs folded with the energy responses. The best-fit models are overplotted. In the upper panels, the spectra of Suzaku/XIS (orange crosses), Suzaku/HXD-PIN (red crosses), XMM-Newton/EPIC-pn (blue crosses), and NuSTAR/FPMs (purple crosses) are plotted. Solid curves represent the best-fit models. In the lower panels, the fitting residuals in units of 1σ error are shown. Right: best-fit models in units of EIE (where IE is the energy flux at the energy E). The solid lines show the total (black), direct component (red), reflection continuum from the torus (blue), emission lines from the torus (light blue), soft excess (orange), and additional emission line (purple).
Download figure:
Standard image High-resolution image
Figure 2. Left: observed broadband spectra of obscured AGNs folded with the energy responses. The best-fit models are overplotted. In the upper panels, the spectra of Suzaku/XIS (orange crosses), Suzaku/HXD-PIN (red crosses), and NuSTAR/FPMs (purple crosses) are plotted. Solid curves represent the best-fit models. In the lower panels, the fitting residuals in units of 1σ error are shown. Right: best-fit models in units of EIE (where IE is the energy flux at the energy E). The solid lines show the total (black), direct component (red), reflection continuum from the torus (blue), emission lines from the torus (light blue), optically thin thermal plasma (orange and magenta), and scattered component (purple).
Download figure:
Standard image High-resolution image4.1. Model 1: Unobscured AGNs
A typical broadband X-ray spectrum of an unobscured AGN consists of (1) a direct component from the nucleus, which is well represented by a power law with an exponential high energy cutoff; (2) reflection components from the accretion disk (if any) and torus accompanied by fluorescence emission lines; and (3) a soft excess component. The spectrum is often subject to absorption by ionized (warm) and/or cold gas in the line of sight. To explain a hump structure peaked around 30 keV and an apparently broad iron K emission line feature, two major distinct models have been proposed: one invoking a strong relativistic reflection component from the inner accretion disk (e.g., Tanaka et al. 1995) and the other invoking variable partial absorbers (e.g., Miyakawa et al. 2012). The discussion of which model is physically correct has long been controversial. This paper does not aim to answer this long-standing question because our main goal is to constrain the torus structure. In fact, Ogawa et al. (2019) obtained similar results on the torus parameters by adopting either of the two models.
For simplicity, in this paper, we adopt the latter model (partial covering model). The whole model for unobscured AGNs is expressed in the XSPEC (Arnaud 1996) terminology as follows (model 1):

- (1)The const and phabs terms represent the cross-calibration constant (C) and the Galactic absorption, respectively. When we analyze NuSTAR data, we set C = 1 for the XIS-FI or EPIC-pn data as the reference and make it free for the NuSTAR/FPMs. That for the Suzaku/HXD-PIN is fixed at 1.16 or 1.18, depending on the target position in the detector coordinates, based on the calibration using the Crab Nebula. We fix the hydrogen column density of the Galactic absorption (
 ) to the total Galactic H i and H2 value given by Willingale et al. (2013).
 - (2)The zcutoffpl term represents the direct component (cutoff power law), and the compTT term is the soft excess (the thermal Comptonization model by Titarchuk 1994 is adopted). The cutoff energy is fixed at 300 keV, a canonical value for nearby AGNs (Dadina 2008). The photoelectric absorption and Compton scattering are taken into account with the zphabs and cabs models, respectively. Its line-of-sight column density () is self-consistently determined by the torus parameters with the equationNote that this condition was not considered in the analysis of Ogawa et al. (2019). Adopting the model by Iso et al. (2016), we consider three layers of absorption by ionized matter (WA); one is a full absorber, and two are partial absorbers. To model the ionized absorbers, we generate a table model by running XSTAR version 2.54a (Kallman & Bautista 2001; Bautista & Kallman 2001) for different values of the ionization parameter (ξ) and hydrogen column density (NH). We adopt the same grid as that used by Miyakawa et al. (2012), where ξ and NH range over and with 20 logarithmic intervals, respectively. We assume that the ionized gas has solar abundances, a temperature of 105 K, a density of 1012 cm−3, and a turbulent velocity of 200 km s−1, and that the incident spectrum is a power law with a photon index of 2.0.
- (3)The table models (atable{xclumpy_R.fits} and atable{xclumpy_L.fits}) correspond to the reflection continuum and fluorescence emission lines from the torus, respectively, based on the XCLUMPY model. The parameters are the power-law normalization at 1 keV, photon index, cutoff energy, equatorial hydrogen column density, torus angular width (σX), and inclination angle (iX). We link the photon index, normalization, and cutoff energy to those of the direct component. In unobscured AGNs, the observed equivalent width of the narrow iron Kα line mainly constrains the torus parameters (Ogawa et al. 2019). To avoid degeneracy among them, we fix iX at 45° for all objects as a typical value of unobscured AGNs (see Appendix B).
- (4)The zgauss term represents an additional emission line feature below 1 keV.


4.2. Model 2: Obscured AGNs
We adopt the same spectral model as in Tanimoto et al. (2020) for obscured AGNs. Compared with model 1, we ignore ionized absorbers because absorption by the torus is dominant. Instead, we consider (1) an unabsorbed scattered component by a surrounding gas of the power-law continuum and (2) optically thin thermal emission from the host galaxy, both of which become unignorable at low energy bands. This model (model 2) is expressed in the XSPEC terminology as follows:

- (1)The const1 and phabs terms represent the cross-calibration constant and the Galactic absorption, respectively (same as in model 1; see Section 4.1).
- (2)The zcutoffpl term represents the direct component. The const2 factor accounts for its possible time variability between two different observation epochs, which is fixed to unity for Suzaku/XIS. The zphabs * cabs term represents the photoelectric absorption and Compton scattering by the torus, whose line-of-sight column density is determined by Equation (3).
- (3)The const3 factor gives the scattering fraction (fscat). The parameters of zcutoffpl are linked to those of the direct component.
- (4)The table models of XCLUMPY (atable{xclumpy_R.fits} and const4 * atable{xclumpy_L.fits}) correspond to the reflection continuum and emission line components from the torus, respectively. To account for possible systematic uncertainties (due to the simplified assumption of the geometry and metal abundances), const4 is multiplied to the latter table. The photon index, normalization, and cutoff energy are linked to those of the direct component. The values of, σX, and iX are left free.
- (5)The apec term represents optically thin thermal emission from the host galaxy. In NGC 3081 and NGC 4388, two different temperature components are required.

4.3. Fitting Results
We find that models 1 and 2 give a fairly good description of the broadband spectra of all objects ( ). Tables 3 and 4 summarize the best-fit parameters of the unobscured and obscured AGNs, respectively. In the left panels of Figures 1 and 2, we overplot the best-fit models folded with the energy responses and their residuals from the data. The right panels of Figures 1 and 2 plot the best-fit models in units of EI(E) (where I(E) is the energy flux) for unobscured and obscured AGNs, respectively. Table 5 lists the best-estimated intrinsic luminosities and Eddington ratios with adopted black hole masses. Here we define the Eddington luminosity as LEdd = 1.26 × 1038(MBH/M⊙) erg s−1 and convert the 2–10 keV luminosities to bolometric ones with a correction factor of 20.
Table 3. Best-fit Parameters of Unobscured AGNs
| Object | phabs | zcutoffpl | compTT | WA1a | WA2a | WA3a | XCLUMPY | zgauss | const | |
|---|---|---|---|---|---|---|---|---|---|---|

|
Γ | kTbb | NH | NH | NH |

|
Eline, σline, Kline | CFPMs/XIS | χ2/dof | |
| KP | kTP |

|

|

|
σ | CFPMs/pn |

|
|||
| τ | Cfrac | Cfrac | Cfrac | i | CHXD/XIS | |||||
| KS |

|
|||||||||
| (1) | (2) | (3) | (4) | (5) | (6) | (7) | (8) | (9) | (10) | |
| NGC 2992 | 5.89c |

|
⋯ | ⋯ |

|

|

|
⋯ | ⋯ | 3140.6/2478 |

|
⋯ | ⋯ |
 d
d
|
 d
d
|

|

|
1.27 | |||
| ⋯ | ⋯ |

|
0.53b | 45c | ⋯ | |||||
| ⋯ |

|
|||||||||
| MCG−5-23-16 | 12.0c |

|
⋯ |

|

|
⋯ |

|
⋯ |

|
4096.8/3436 |

|
⋯ |

|

|
⋯ |

|
⋯ | 1.19 | |||
| ⋯ | 1c |

|
⋯ | 45c | ⋯ | |||||
| ⋯ |

|
|||||||||
| NGC 3783 | 14.1c |

|

|

|

|

|

|
 , 10c, , 10c, 
|
⋯ | 1714.0/1391 |

|
 d
d
|

|

|

|

|

|
1.23 | |||
 d
d
|
1c |

|
0.68b | 45c | ⋯ | |||||

|

|
|||||||||
| UGC 6728 | 5.55c |

|
⋯ | ⋯ |

|
⋯ |

|
⋯ | ⋯ | 668.0/652 |

|
⋯ | ⋯ |

|
⋯ |
 d
d
|
⋯ | 1.02 | |||
| ⋯ | ⋯ |

|
⋯ | 45c | 1.16c | |||||
| ⋯ | <0.44 | |||||||||
| NGC 4051 | 1.20c |

|

|
⋯ |
 d
d
|

|

|
⋯ | ⋯ | 1522.7/1313 |

|
 d
d
|
⋯ |

|

|
 d
d
|

|
1.16 | |||
 d
d
|
⋯ |

|
0.43b | 45c | ⋯ | |||||

|
<0.22 | |||||||||
| NGC 4395 | 1.93c |
 d
d
|
⋯ | ⋯ |

|
⋯ |

|
⋯ | ⋯ | 508.5/473 |

|
⋯ | ⋯ |

|
⋯ |

|
⋯ | 1.08 | |||
| ⋯ | ⋯ |

|
⋯ | 45c | 1.18c | |||||
| ⋯ |

|
|||||||||
| MCG−6-30-15 | 4.74c |

|

|

|

|

|

|
 , 10c, , 10c, 
|
⋯ | 2621.4/2083 |

|
 d
d
|

|

|
 d
d
|

|
 , 10c, , 10c, 
|

|
1.26 | ||
 d
d
|
1c |

|
0.26b | 45c | ⋯ | |||||

|

|
|||||||||
| IC 4329A | 5.60c |

|
⋯ |

|

|
⋯ |

|
 , 20c, , 20c, 
|

|
1523.2/1248 |

|
⋯ |

|

|
⋯ |

|
⋯ | 1.22 | |||
| ⋯ | 1c |

|
⋯ | 45c | ⋯ | |||||
| ⋯ |

|
|||||||||
| NGC 6814 | 14.8c |

|
⋯ | ⋯ |
 d
d
|
⋯ |

|
⋯ | ⋯ | 368.0/332 |

|
⋯ | ⋯ |

|
⋯ |
 d
d
|
⋯ | 1.11 | |||
| ⋯ | ⋯ |

|
⋯ | 45c | 1.16c | |||||
| ⋯ | <2.2 | |||||||||
| NGC 7213 | 1.11c |

|

|
⋯ |

|
⋯ |

|
⋯ | ⋯ | 1874.9/1613 |

|

|
⋯ |

|
⋯ |

|
⋯ | 1.16 | |||

|
⋯ |

|
⋯ | 45c | 1.16c | |||||

|

|
|||||||||
| NGC 7314 | 1.59c |

|
⋯ |

|

|
 d
d
|

|
⋯ | ⋯ | 1945.0/1698 |

|
⋯ |

|
 d
d
|

|

|

|
1.15 | |||
| ⋯ | 1c |

|
0.38b | 45c | ⋯ | |||||
| ⋯ |

|
|||||||||
| NGC 7469 | 5.39c |

|

|

|
 d
d
|
⋯ |

|
⋯ | ⋯ | 1696.2/1561 |

|
 d
d
|

|

|
⋯ |

|

|
1.09 | |||

|
1c |

|
⋯ | 45c | ⋯ | |||||

|
<0.15 | |||||||||
Notes. Column (1): galaxy name. Column (2): hydrogen column density of the Galactic absorption in 1020 cm−2. Column (3): photon index of the direct component and the normalization at 1 keV in 10−3 photons keV−1 cm−2 s−1. Column (4): input soft photon temperature in eV, plasma temperature in keV, plasma optical depth, and normalization of soft excess component at 1 keV in 10−2 photons keV−1 cm−2 s−1. Columns (5)–(7): hydrogen column density of an ionized absorber in 1022 cm−2, its logarithmic ionization parameter (ξ in erg cm s−1), and its covering fraction. Column (8): hydrogen column density along the equatorial plane in 1024 cm−2, torus angular width in degrees, inclination angle of the observer in degrees, and hydrogen column density along the line of sight in 1020 cm−2. Column (9): energy of the emission line in keV, its line width in eV, and its normalization at 1 keV in 10−4 photons keV−1 cm−2 s−1. Column (10): relative normalization of NuSTAR/FPMs to Suzaku/XIS, NuSTAR to XMM-Newton/EPIC-pn, and Suzaku/HXD to Suzaku/XIS.
aThe WA1 model is a full absorber, and the WA2 and WA3 models represent partial absorbers. bThe value is linked to that of WA2. cFixed. dThe parameter reaches a limit of its allowed range.Table 4. Best-fit Parameters of Obscured AGNs
| Object | phabs | zcutoffpl | apec | XCLUMPY | const3 | const4 | const(1,2) | |
|---|---|---|---|---|---|---|---|---|

|
Γ | kT1 |

|
fscat | NLine | CTIME | χ2/dof | |
| KP | KA1 | σ | CFPMs/XIS |

|
||||
| kT2 | i | CHXD/XIS | ||||||
| KA2 |

|
|||||||
| (1) | (2) | (3) | (4) | (5) | (6) | (7) | (8) | |
| NGC 3081 | 4.63a |
 b
b
|

|

|

|
1a | 1a | 96.9/82 |

|

|

|
⋯ | 1.18 | ||||

|

|
1.18a | ||||||

|

|
|||||||
| NGC 4388 | 2.87a |
 b
b
|

|

|

|

|

|
2071.9/1974 |

|

|

|
1a | 1.05 | ||||

|

|
⋯ | ||||||

|

|
|||||||
| Centaurus A | 11.7a |

|

|

|

|

|

|
3095.0/2919 |

|

|

|
1a | 1.06 | ||||
| ⋯ |

|
⋯ | ||||||
| ⋯ |

|
|||||||
| NGC 6300 | 10.6a |

|

|

|

|
1a |

|
1128.5/1059 |

|

|

|
1a | 1.07 | ||||
| ⋯ |

|
⋯ | ||||||
| ⋯ |

|
|||||||
Notes. Column (1): galaxy name. Column (2): hydrogen column density of the Galactic absorption in 1020 cm−2. Column (3): photon index of the direct component and the normalization at 1 keV in 10−2 photons keV−1 cm−2 s−1. Column (4): temperature of the apec model in keV and normalization of the apec model in 10![${}^{-19}/4\pi {[{D}_{{\rm{A}}}(1+z)]}^{2}\int {n}_{{\rm{e}}}{n}_{{\rm{H}}}{dV}$](https://content.cld.iop.org/journals/0004-637X/906/2/84/revision1/apjabccceieqn215.gif) , where DA is the angular diameter distance to the source in centimeters, and ne and nH are the electron and hydrogen densities in cm−3. Column (5): hydrogen column density along the equatorial plane in 1024 cm−2, torus angular width in degrees, inclination angle of the observer in degrees, and hydrogen column density along the line of sight in 1023 cm−2. Column (6): scattering fraction in percent. Column (7): relative normalization of the emission lines to the reflection component. Column (8): time variability constant, relative normalization of NuSTAR/FPMs to Suzaku/XIS, and relative normalization of Suzaku/HXD to Suzaku/XIS.
, where DA is the angular diameter distance to the source in centimeters, and ne and nH are the electron and hydrogen densities in cm−3. Column (5): hydrogen column density along the equatorial plane in 1024 cm−2, torus angular width in degrees, inclination angle of the observer in degrees, and hydrogen column density along the line of sight in 1023 cm−2. Column (6): scattering fraction in percent. Column (7): relative normalization of the emission lines to the reflection component. Column (8): time variability constant, relative normalization of NuSTAR/FPMs to Suzaku/XIS, and relative normalization of Suzaku/HXD to Suzaku/XIS.
Download table as: ASCIITypeset image
Table 5. X-Ray Luminosity
| Object | logL2–10a |

|

|
Reference |
|---|---|---|---|---|
| (1) | (2) | (3) | (4) | (5) |
| NGC 2992 | 43.0 | −1.52 | 7.72 | a |
| MCG−5–23–16 | 43.4 | −1.34 | 7.98 | b |
| NGC 3783 | 42.9 | −1.13 | 7.27 | b |
| UGC 6728 | 42.3 | −0.40 | 5.85 | c |
| NGC 4051 | 41.9 | −0.48 | 5.60 | d |
| NGC 4395 | 40.0 | −1.72 | 4.88 | b |
| MCG−6–30–15 | 43 | −1.24 | 7.42 | b |
| IC 4329A | 43.9 | −0.76 | 7.84 | d |
| NGC 6814 | 41.8 | −1.41 | 6.46 | d |
| NGC 7213 | 42.2 | −1.99 | 7.37 | e |
| NGC 7314 | 42.5 | −1.57 | 7.24 | d |
| NGC 7469 | 43.3 | −0.65 | 7.11 | d |
| NGC 3081 | 42.6 | −1.87 | 7.70 | f |
| NGC 4388 | 43.0 | −1.84 | 8.00 | f |
| Centaurus A | 42.0 | −2.70 | 7.94 | b |
| NGC 6300 | 42.1 | −1.99 | 7.30 | f |
Note. Column (1): galaxy name. Column (2): logarithmic intrinsic luminosity in the 2–10 keV band. Column (3): logarithmic Eddington ratio (λEdd = Lbol/LEdd). Here we obtained the bolometric luminosity as Lbol = 20L2−10 and defined the Eddington luminosity as LEdd = 1.26 × 1038 MBH/M☉. Column (4): logarithmic black hole mass. Column (5): reference for the black hole mass.
aWe calculate the X-ray luminosities from the redshifts, except for the very nearby objects NGC 4051, NGC 4395, and Centaurus A, for which we adopt distances of 17.6 (Yoshii et al. 2014), 3.85 (Tully et al. 2009), and 3.84 (Rejkuba 2004) Mpc, respectively.References. (a) Woo & Urry (2002); (b) García-Bernete et al. (2019); (c) Bentz et al. (2016); (d) Koss et al. (2017); (e) Vasudevan et al. (2010); (f) Kawamuro et al. (2016a).
Download table as: ASCIITypeset image
Since all of our targets are nearby and bright AGNs, they have been extensively studied by many authors. In Appendix A, we compare our results with previous works of broadband X-ray spectroscopy that utilized the same data as used here, when available.
5. AGN Torus Properties
We have shown that the torus reflection components in AGN X-ray spectra can be well represented with the XCLUMPY model, confirming the previous studies that applied it to broadband X-ray spectra of local AGNs (Ogawa et al. 2019; Tanimoto et al. 2019; Yamada et al. 2020; Tanimoto et al. 2020). Combining the 16 objects newly analyzed in this paper and the 12 obscured AGNs studied by Tanimoto et al. (2020), we construct the largest sample whose X-ray and infrared spectra are uniformly analyzed with the XCLUMPY and CLUMPY models, respectively. Although our sample is not a statistically well-defined one, we may regard it as a representative one including various types of AGNs. In particular, we have now included 12 unobscured AGNs in the sample, which gives us a new insight into the torus structure.
5.1. Torus Covering Factor as a Function of Eddington Ratio
In this subsection, we summarize the torus properties of our sample obtained from the X-ray spectral analysis described in Section 4. On the basis of the unobscured AGN fraction in a hard X-ray selected sample, Ricci et al. (2017a) showed that the Eddington ratio (i.e., the luminosity normalized by the black hole mass) is a key parameter that determines the torus geometry; since radiation pressure works to expel dusty gas, the torus covering fraction rapidly decreases when  . Thus, it is important to check whether the torus structure we determine for the individual objects through X-ray spectroscopy is consistent with their prediction.
Figure 3(a) plots the torus angular width determined from the X-ray spectra (σX) against Eddington ratio. By including the unobscured AGNs, which show higher Eddington ratios than most of the obscured AGNs in our sample, we confirm the trend reported by Tanimoto et al. (2020) that AGNs with high Eddington ratios have smaller σX. To be more quantitative, we estimate the covering factor of the torus with NH > 1022 cm−2, CT, that is, the fractional solid angle of torus material whose mean column density exceeds 1022 cm−2 in the XCLUMPY geometry. In XCLUMPY, the mean hydrogen column density at the elevation angle θ* (≡90° − iX) is given by

Defining θc such that  , CT can be calculated from the torus parameters as

Figure 3(b) plots CT against λEdd. As noticed, our results follow the trend of the CT versus λEdd relation by Ricci et al. (2017b) based on the statistical study. The good agreement supports our assumption of iX = 45° for unobscured AGNs in our sample (see Appendix B for the results with different iX values).
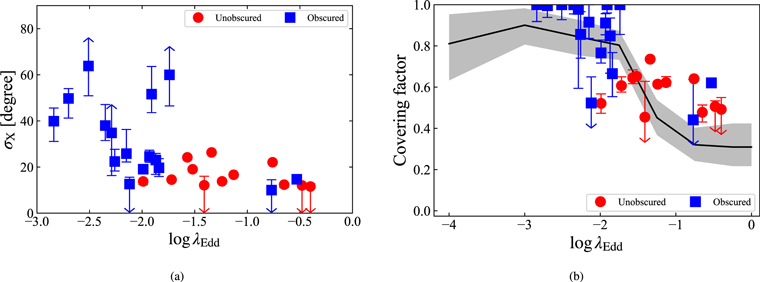
Figure 3. (a) Relation between the torus angular width (σX) and the Eddington ratio (λEdd). (b) Relation between the torus covering factor (CT) and the Eddington ratio (λEdd). The black curve and shaded region represent the best-fit and 1σ error region obtained by Ricci et al. (2017a). The blue squares and red circles denote the obscured and unobscured AGNs, respectively. The arrows represent the results reaching the upper or lower boundary.
Download figure:
Standard image High-resolution image5.2. Comparison with the Infrared Results
Figure 4 compares the torus parameters determined from the X-ray spectra and those from the infrared ones. We recall that the X-ray results trace all material, including gas and dust, whereas the infrared ones trace only dust. Hence, if the spatial distribution of gas and dust is not exactly the same and/or the dust temperature is not spatially uniform, it is possible that they give different solutions.

Figure 4. (a) Comparison between the torus angular width obtained from the infrared spectra (σIR) and that from the X-ray ones (σX). The black line shows σX = σIR. (b) Comparison between the inclination angle obtained from the infrared spectra (iIR) and that from the X-ray ones (iX). The black line shows iX = iIR. (c) Comparison between the V-band extinction along the line of sight ( ) and the hydrogen column density along the line of sight (
 ). The black line corresponds to the Galactic value. (d) Comparison between the V-band extinction along the equatorial plane (
 ) and the hydrogen column density along the equatorial plane (
 ). The ranges of the x- and y-axes correspond to the parameter boundaries of
  and
and  , respectively. The black line corresponds to the Galactic value. The blue squares and red circles denote the obscured and unobscured AGNs, respectively. The arrows represent the results reaching the upper or lower boundary.
Download figure:
Standard image High-resolution imageAs noticed from Figure 4(a), we confirm the finding by Tanimoto et al. (2020) that the torus angular widths obtained from the infrared spectra (σIR) become systematically larger than those obtained from the X-ray ones (σX), even including unobscured AGNs (Figure 4(a)). Tanimoto et al. (2020) suggested that this apparent discrepancy may be explained by a significant contribution from polar dusty outflows to the observed infrared flux, as found by infrared interferometric observations of nearby AGNs (Tristram et al. 2014; López-Gonzaga et al. 2016; Leftley et al. 2018; Lyu & Rieke 2018). Tanimoto et al. (2020) argued that this effect became most prominent at the highest inclinations because the flux from hot dust in the inner part of the torus was reduced due to extinction by outer cooler dust. Our results suggest that this effect is still present in our unobscured AGNs, which might have inclinations of ∼45°, on average. Although both CLUMPY and XCLUMPY do not include such polar components, the effect is more severe in the infrared spectra than in the X-ray ones. In X-rays, because the total mass in such polar outflows is much smaller than that contained in the torus itself, the reflection component from the polar outflow is weak compared with the torus reflection component at energies above a few keV (Liu et al. 2019).
In Figure 4(b), we compare the inclination angles determined from the X-ray (iX) and infrared spectra (iIR) for obscured AGNs by adding four sources to the original Tanimoto et al. (2020) sample. Here only objects whose iX is determined with an accuracy of <30° are included; unobscured AGNs are not included because we cannot directly constrain their iX from the spectra. We confirm that iX is generally larger than iIR. If σIR is overestimated as discussed above, then it could cause iIR to be underestimated due to its degeneracy (Nenkova et al. 2008b; Ramos Almeida et al. 2014).
Figure 4(c) confirms the results by Tanimoto et al. (2020) that the NH/AV ratios along the line of sight in obscured AGNs are similar to the Galactic value (NH/AV = 1.87 × 1021 cm−2 mag−1; Draine 2003), on average, with a scatter of ∼1 dex. By contrast, unobscured AGNs show systematically smaller NH/AV values than the Galactic one. In an unobscured AGN, the line-of-sight AV is not directly determined by extinction along the path toward the central region but is constrained by the infrared emission in the torus region (see next section). If the torus angular width σIR is overestimated by a larger factor than that in the elevation angle (90° − iIR), it would make the line-of-sight AV larger than the true value (see Equation (3)).
Figure 4(d) also suggests that the NH/AV ratios along the equatorial plane are similar to the Galactic value, on average, for both obscured and unobscured AGNs.6
It is consistent with the results of  obtained for obscured AGNs (Figure 4(c)), which are more directly constrained by the data through X-ray absorption (NH) and the infrared silicate absorption feature (AV). Our results imply that the gas-to-dust ratios of AGN tori are similar to the Galactic value, on average, but may be variable object to object with ∼1 dex.
6. Unified Picture of AGN Structure
Our findings can be well explained by an updated unified picture of AGN structure including (1) a dusty torus, (2) dusty polar outflows, and (3) dust-free gas inside the dust sublimation radius, where the broad-line region (BLR) is located. As in the classical unified model of AGNs (Antonucci 1993), we assume that only the inclination angle determines the X-ray unobscured/obscured and optical type 1/2 classifications. Figures 5(a)–(d) illustrate schematic views of AGN structure with increasing order of inclination: (case (a)) X-ray unobscured and optical type 1 AGNs, (case (b)) X-ray obscured and optical type 1 AGNs, (case (c)) X-ray obscured and optical type 2 (not edge-on case), and (case (d)) the same but close to the edge-on case. The X-ray power-law component is emitted from a hot corona close to the SMBH (whose light path is illustrated by the arrow), whereas the infrared emission mainly comes from the inner dusty torus and polar outflows. The spatial distribution of the dust-free gas inside the dusty torus is unknown, and we assume that it has a disklike geometry (i.e., elongated along the equatorial plane). Except for the dust-free gas region, the gas-to-dust ratio is assumed to be close to the Galactic ISM value. Note that the torus angular width and the direction of the polar outflows in the figures are arbitrary, which could depend on the AGN parameters, such as the Eddington ratio.

Figure 5. Unified picture of AGN structure, including a dusty torus (hot clumps in red and cooler clumps in gray), dusty polar outflows (red shaded region), and dust-free gas (gray shaded region inside the torus) where the BLR (purple circles) is located. The black and red arrows represent the light travel paths of the X-ray power-law component and the infrared dust emission toward an observer, respectively. The inclination increases from panels (a) to (d).
Download figure:
Standard image High-resolution imageIn case (a), i.e., at low inclinations, the paths along which X-ray and infrared emission travels are largely different. In X-rays, NH is constrained by absorption toward the central hot corona, whereas the AV parameter in CLUMPY is determined by the infrared emission from outer dusty regions, not by extinction toward the central region. In the CLUMPY model, dust optical depths at infrared wavelengths are converted to AV by assuming standard Galactic dust properties.The X-ray component shows little absorption because the column density of the dust-free gas is small, and optical emission lines from the BLR are not blocked by any dusty material. Hence, it is observed as an X-ray unobscured and optical type 1 AGN. As stated in Section 5.2, fitting the infrared spectrum with CLUMPY (i.e., by ignoring the dusty polar outflows) would largely overestimate the torus angular width (σIR), leading to an overestimate of the line-of-sight AV. Hence, the ratio of NH/AV along the line of sight apparently becomes much smaller than the value in the torus region, which is assumed to be similar to that of the Galactic ISM in our picture.
In case (b), where the inclination is higher than in case (a), the X-ray spectrum can be absorbed with a moderate column density (e.g., NH ∼ 1022 cm−2) by dust-free gas. In the optical band, however, the BLR can barely be seen when the line-of-sight path crosses an upper boundary region of the torus, assuming that extinction by the dusty polar outflows is unimportant. Hence, it is observed as an X-ray obscured but optical type 1 AGN. This may explain (a part of) the AGN population studied by Maiolino et al. (2001a, 2001b) that shows X-ray absorption but broad emission lines in the optical spectra, even without invoking dust properties that are largely different from those in the Galactic ISM.
In case (c), the travel paths of X-rays and infrared emission become close to each other, and both are subject to significant extinction by the dusty torus. Hence, it is observed as an X-ray obscured and optical type 2 AGN. In this geometry, the absorption of the X-ray emission is dominated by the dusty torus (with a column density of, e.g., NH ∼ 1023 cm−2), not by the dust-free gas. Hence, the  ratio represents the value in the torus region, which is close to the Galactic value, as assumed.
In case (d), the very edge-on case, it is also observed as an X-ray obscured and optically type 2 AGN. In X-rays, it may become a Compton-thick AGN with a column density of NH ≳ 1024 cm−2. As discussed in Tanimoto et al. (2020), the infrared emission coming from the innermost torus region is subject to extinction by cold dust in the outer parts of the torus or the circumnuclear disk, and its flux is more reduced compared with the previous cases. Then, the relative contribution of the infrared emission from the dusty polar outflows, which is located above the torus region and hence less subject to extinction, becomes more prominent. The extinction (AV) determined from the infrared spectrum represents an averaged value for the torus and polar outflow regions, whereas the column density (NH) determined from the X-ray spectrum represents that close to the equatorial plane. Hence, the  ratio becomes larger than the Galactic value.
We would like to remark that the proposed picture is still a toy model. It is deduced by interpreting the results of currently available models applied independently to the X-ray and infrared data. For more quantitative evolution, it is necessary to develop models that correctly include the contribution from the dusty polar outflows and self-consistently apply them simultaneously to both infrared and X-ray data. This will be left as an important future task.
7. Conclusions
- 1.We have successfully applied the X-ray clumpy torus model XCLUMPY to the broadband spectra (0.3–70 keV) of 16 AGNs. Combining them with previous works, we now have a sample of 28 AGNs whose torus properties are independently estimated from the infrared and X-ray spectra with the CLUMPY and XCLUMPY codes, respectively.
- 2.The relation between the Eddington ratio and the torus covering factor determined from the X-ray torus parameters of each object follows that derived by Ricci et al. (2017a) based on a statistical analysis of a hard X-ray selected sample.
- 3.Comparing the torus parameters obtained from the X-ray and infrared spectra, we confirm the results by Tanimoto et al. (2020) that (1) the torus angular widths determined by the infrared data are systematically larger those by the X-ray data and (2) the NH/AV ratios along the line of sight in obscured AGNs are similar to the Galactic value, on average, with a scatter of ∼1 dex. We find that unobscured AGNs show apparently smaller line-of-sight NH/AV ratios than the Galactic one, which could be explained if the angular torus widths are overestimated in the infrared spectral analysis.
- 4.Our findings can be well explained by an updated unified picture of AGN structure including a dusty torus, dusty polar outflows, and dust-free gas (Figure 5), where the X-ray and optical classifications and observed torus properties in the X-ray and infrared bands are determined by the inclination angle.
We thank the referee for the useful comments and suggestions. This work has been financially supported by Grants-in-Aid for Scientific Research 17K05384 and 20H01946 (Y.U.) and JSPS Research Fellowships (A.T. and S.Y.). This research has made use of the NuSTAR Data Analysis Software (NUSTARDAS), jointly developed by the ASI Science Data Center (ASDC; Italy) and the California Institute of Technology (Caltech; USA). This research has also made use of data obtained with XMM-Newton, an ESA science mission with instruments and contributions directly funded by ESA Member States and NASA; public Suzaku data obtained through the Data ARchives and Transmission System (DARTS), provided by the Institute of Space and Astronautical Science (ISAS) at the Japan Aerospace Exploration Agency (JAXA); and the NASA/IPAC Extragalactic Database (NED), which is operated by the Jet Propulsion Laboratory, California Institute of Technology, under contract with the National Aeronautics and Space Administration. For data reduction, we used software provided by the High Energy Astrophysics Science Archive Research Center (HEASARC) at NASA/Goddard Space Flight Center.
Facilities: XMM-Newton - , Suzaku - , NuSTAR. -
Software: HEAsoft (v6.26.1; NASA High Energy Astrophysics Science Archive Research Center (HEASARC), 2014), SAS (v17.0.0; Gabriel et al. 2004), NUSTARDAS, XSPEC (v12.10.1f; Arnaud 1996), XCLUMPY (Tanimoto et al. 2019).
Appendix A: Comparison of Spectral Fitting Results with Previous Studies
Since different spectral models were used in earlier works, we focus on the photon index of the intrinsic component and the line-of-sight column density (for obscured AGNs) to check the overall consistency. Appendices A.1–A.10 and A.11–A.14 describe the results of unobscured and obscured AGNs, respectively. The results of IC 4329A and NGC 7469 are similar to those of Ogawa et al. (2019), in which comparisons with previous studies were discussed in detail.
A.1. NGC 2992
The simultaneous XMM-Newton and NuSTAR data observed in 2019 May are reported here for the first time. We obtain  and
and  .
.
A.2. MCG−5–23–16
Jointly analyzing the NuSTAR and Suzaku spectra, we obtain  and
and  . Our results are very similar to those using the same Suzaku data reported by Zoghbi et al. (2017),
  and
and  , and the NuSTAR results observed in the same epoch (
 and
and  ). They utilized the xillver (García et al. 2013) and relxill models (Dauser et al. 2014; García et al. 2014) to reproduce the distant reflection and relativistic reflection components, respectively.
A.3. NGC 3783
We obtain  , which is smaller than the result by Mao et al. (2019;
  ), using the same NuSTAR and XMM-Newton data. We infer that this is because they adopted a different spectral model. They utilized the REFL model (Magdziarz & Zdziarski 1995; Zycki et al. 1999) in SPEX (Kaastra et al. 1996) for a neutral reflection component and took nine warm absorbers into account.
A.4. UGC 6728
The photon index  well matches with the result reported by Walton et al. (2013a) using the same Suzaku data (
 ) despite the different spectral modeling. They included a relativistic reflection component using the REFLIONX (Ross & Fabian 2005) model convolved with RELCONV (Dauser et al. 2013).
A.5. NGC 4051
The simultaneous XMM-Newton and NuSTAR data observed in 2018 November are reported here for the first time. We obtain  and
and  . The source was in a high flux state (e.g., Pounds et al. 2004).
A.6. NGC 4395
We obtain Γ < 1.53 and  . The photon index is consistent with that reported by Kawamuro et al. (2016b) using the same Suzaku data (
 ). The line-of-sight absorption by the torus is smaller than their result (
 ) because Kawamuro et al. (2016b) did not consider an ionized absorber.
A.7. MCG−6–30–15
We obtain  . This is in good agreement with the result reported by Marinucci et al. (2014) using the same XMM-Newton and NuSTAR data (
 ). The slight difference comes from the different spectral modeling; Marinucci et al. (2014) considered a distant reflection component from ionized material using the xillver model and five absorbers.
A.8. NGC 6814
We obtain  and
and  . These are different from the results based on the same Suzaku data reported by Walton et al. (2013b),
  and
and  . The difference comes from the different spectral modeling; they used the REFLIONX code for a reflection component and did not consider a partial absorber.
A.9. NGC 7213
We obtain  . Our results are consistent with those reported by Patrick et al. (2012) using the same Suzaku and Swift/BAT data,
  , within the errors. They used the REFLIONX model for a reflection component.
A.10. NGC 7314
We obtain  and
and  . These are slightly different from the NuSTAR results (Panagiotou & Walter 2019),
  and
and  . We infer that because they analyzed only the NuSTAR data and did not consider ionized absorbers, a larger absorption than ours was obtained.
A.11. NGC 3081
The model with two apec components well reproduces the broadband X-ray spectra. We obtain Γ > 1.56 and  . Our results are consistent with the results reported by Kawamuro et al. (2016a) using the same Suzaku data,
  and
and  .
.
A.12. NGC 4388
The model with two apec components well reproduces the broadband NuSTAR+Suzaku spectrum. Our best-fitting parameters are Γ < 1.51 and  . Analyzing the Suzaku XIS+HXD spectra, Kawamuro et al. (2016a) obtained
  and
and  . Using the NuSTAR data, Masini et al. (2016) obtained
  and
and  . Kawamuro et al. (2016a) utilized the pexrav model (Magdziarz & Zdziarski 1995), and Masini et al. (2016) utilized the MYTorus model (Murphy & Yaqoob 2009). Our photon index is slightly smaller than these results. We infer that this is because the XCLUMPY model contains a strong unabsorbed (hence soft) reflected continuum escaped through clumps in the near-side torus, which works to make the intrinsic spectrum harder (see the discussion in Tanimoto et al. 2019).
A.13. Centaurus A
Results utilizing the Suzaku data are reported here for the first time. The model with one apec component well reproduces the broadband NuSTAR+Suzaku spectrum. We obtain  and
and  . Our photon index is slightly smaller from the NuSTAR result; Fürst et al. (2016) obtained
  and
and  , utilizing the MYTorus model. This may be explained the same way as for NGC 4388.
A.14. NGC 6300
The model with one apec component well reproduces the broadband NuSTAR+Suzaku spectrum. We obtain  and
and  , which are in good agreement with the Suzaku results reported by Kawamuro et al. (2016a),
  and
and  . Our photon index is slightly smaller than that reported by Panagiotou & Walter (2019) using the NuSTAR data,
  and
and  . Since they used the pexrav model for the reflection component, the discrepancy may also be explained the same way as for NGC 4388.
Appendix B: Inclination Angle Dependence of Torus Covering Factor in Unobscured AGNs
To investigate the dependence of the torus parameters on the assumed inclination angle (iX) for unobscured AGNs, we fit the spectra by fixing iX at 30° and 60°. We find that the mean values of the torus angular width, logarithmic column density along the equatorial plane, and torus covering factor are (〈σX〉,  , 〈CT〉) = (22°, 24.2, 0.70) for iX = 30°, (17°, 24.2, 0.58) for iX = 45°, and (12°, 23.9, 0.41) for iX = 60°. Figures 6(a) and (b) plot CT against λEdd for iX = 30° and 60°, respectively. As noted, we find general trends that CT is overestimated for iX = 30° and underestimated for iX = 60°, assuming that the relation of Ricci et al. (2017a) holds for our sample. Thus, we suggest that the assumption of iX = 45° adopted in the main paper is the most reasonable of the three cases. It is remarkable that iX = 30°, often adopted as a typical inclination for unobscured AGNs, cannot reproduce the Ricci et al. (2017a) relation.

Figure 6. Relation between the torus covering factor (CT) and the Eddington ratio (λEdd). The black curve and shaded region represent the best-fit and 1σ error region obtained by Ricci et al. (2017a). The blue squares and red circles denote the obscured and unobscured AGNs, respectively. The arrows represent the results reaching the upper or lower boundary. (a) The inclination angle (iX) of the unobserved AGNs is set to 30°. The open circle denotes the best-fit CT value of NGC 6814, whose lower and upper limits reach the boundaries (0 and 1) at a <90% confidence level. (b) The iX is set to 60°.
Download figure:
Standard image High-resolution image
Footnotes
- 3
Among the parent sample by Ichikawa et al. (2015) and García-Bernete et al. (2019), we exclude NGC 1365, NGC 1386, NGC 4151, and ESO 005–G004, which show strong X-ray spectral variability among different observations (see Ogawa et al. 2019 and Tanimoto et al. 2020). We also do not include NGC 1068 and NGC 4945 because of their too-complex X-ray spectra and NGC 4138 because it was not detected with the HXD.
- 4
Centaurus A, NGC 3081, and MCG−5–23–16 are included in both papers; we refer to García-Bernete et al. (2019) for the infrared results.
- 5
Since the background event file for the NGC 6814 observation seems to contain an unignorable systematic error, we utilized the night-Earth occultation data as the NXB for this target.
- 6
Our new results of IC 4329A and NGC 7469 support the conclusion by Ogawa et al. (2019), who assumed the same inclination and torus angular width as the infrared values, that their tori are dust-rich compared with the Galactic ISM.