


Abstract
The traditional picture of post-starburst galaxies as dust- and gas-poor merger remnants, rapidly transitioning to quiescence, has been recently challenged. Unexpected detections of a significant interstellar medium (ISM) in many post-starburst galaxies raise important questions. Are they truly quiescent, and if so, what mechanisms inhibit further star formation? What processes dominate their ISM energetics? We present an infrared spectroscopic and photometric survey of 33 E+A post-starbursts selected by the Sloan Digital Sky Survey, aimed at resolving these questions. We find compact, warm dust reservoirs with high PAH abundances and total gas and dust masses significantly higher than expected from stellar recycling alone. Both polycyclic aromatic hydrocarbon (PAH)/total infrared (TIR) and dust-to-burst stellar mass ratios are seen to decrease with post-burst age, indicative of the accumulating effects of dust destruction and an incipient transition to hot, early-type ISM properties. Their infrared spectral properties are unique, with dominant PAH emission, very weak nebular lines, unusually strong H2 rotational emission, and deep [C ii] deficits. There is substantial scatter among star formation rate (SFR) indicators, and both PAH and TIR luminosities provide overestimates. Even as potential upper limits, all tracers show that the SFR has typically experienced a decline of more than two orders of magnitude since the starburst and that the SFR is considerably lower than expected given both their stellar masses and molecular gas densities. These results paint a coherent picture of systems in which star formation was, indeed, rapidly truncated, but in which the ISM was not completely expelled, and is instead supported against collapse by latent or continued injection of turbulent or mechanical heating. The resulting aging burst populations provide a "high-soft" radiation field that seemingly dominates the E+A galaxies' unusual ISM energetics.
Export citation and abstract BibTeX RIS
1. Introduction
Once thought to be a simple evolutionary sequence, the pathways leading galaxies from the star-forming blue cloud to the quiescent red sequence have been revealed to be incredibly diverse (Barro et al. 2014; Schawinski et al. 2014). The cessation of star formation appears to happen on vastly different timescales, strongly dependent on a galaxy's growth history (Martin et al. 2007). A class of unique objects called post-starburst (PSB) galaxies appear to be the remnants of the most violent of such "quenching" events.
PSBs were originally characterized in galaxy clusters by both Dressler & Gunn (1983) and Couch & Sharples (1987) as galaxies with strong Balmer absorption features but surprisingly weak nebular emission lines. Their optical spectra resemble a linear combination of a several hundred Myr old (A-star-dominated) stellar population and an old stellar population (early-type or K-star-dominated), leading to their "E(K)+A" designation. E+A galaxies' unique spectral characteristics suggest that they experienced a burst of star formation, which was rapidly quenched (in ≲ 100 Myr) several hundred Myr ago (Dressler & Gunn 1983; Couch & Sharples 1987). PSBs likely have various formation mechanisms—such as ram pressure stripping from cluster infall (see Blanton & Moustakas 2009) and intragroup interactions in both isolated groups and clusters (e.g., Zabludoff et al. 1996; Zabludoff & Mulchaey 1998; Alatalo et al. 2015a). In the field, PSBs are nearly ubiquitously observed to host strong tidal features and kinematics indicative of violent relaxation due to major, late-stage mergers (Zabludoff et al. 1996; Yang et al. 2004, 2008). Though locally rare, they are thought to be more common at high redshift (Tran et al. 2004; Kriek et al. 2016; Zahid et al. 2016)—indeed, Tran et al. (2004) estimate that ∼70% of present-day ellipticals may have passed through a PSB phase at z < 1. This, as well as more recent results by Wild et al. (2016), suggests that PSBs may be a critical evolutionary component to the development of the present-day red sequence.
In the past decade, much work has been done to constrain the physical mechanisms that could halt star formation on the short timescales required in PSB galaxies—of order a single dynamical period. Based on hydrodynamic simulations, Hopkins et al. (2006) presented a unified, merger-driven evolutionary sequence for galaxies, beginning with mergers of gas-rich disks, progressing to late-stage mergers with heavily dust-obscured, central starbursts, coupled with supermassive black hole (SMBH) fueling and subsequent quasar-mode feedback, and culminating in the development of quiescent spheroids resembling present-day ellipticals. Observationally, late-stage gas-rich mergers appear to manifest as (ultra)luminous infrared galaxies ((U)LIRGs; Kormendy & Sanders 1992; Kartaltepe et al. 2010; Draper & Ballantyne 2012; Carpineti et al. 2015).
This basic framework has been modified with the addition of E+A galaxies (e.g., Hopkins et al. 2008; Snyder et al. 2011). Hydrodynamic simulations have focused on the brief time steps directly following the late-stage merger phase, suggesting that E+A galaxies represent an intermediate stage in the evolution of gas-rich major mergers, prior to the development of the spheroidal remnant. These results predict that the E+A signature remains centrally concentrated throughout—a direct link to their compact progenitor starbursts. Snyder et al. (2011) found that the E+A phase generally lasted ≤300 Myr and only in rare cases persisted on Gyr timescales.
Elegant as this evolutionary picture is, observational evidence to support it has remained elusive, and the detailed evolution of the interstellar medium (ISM) in E+A galaxies remains almost completely unknown. Alatalo et al. (2016a, 2016b) have recently characterized a sample of galaxies possessing strong Balmer decrements but stronger emission lines than classically selected E+A galaxies (see Section 2). These objects appear to be in very early PSB phases, likely probing both the latest stages of the burst and earliest stages of star formation decline. By selection, their sample possesses strong classical shocks, inferred from optical emission line ratios indicative of shock excitation. The vast majority are likely still forming stars at a relatively high rate, based on their nebular lines, and they show evidence of active galactic nucleus (AGN) driven outflows in many cases, consistent with the Hopkins et al. (2006) evolutionary scenario. They detect significant reservoirs of molecular gas in all cases (Alatalo et al. 2016b).
E+A galaxies appear to be heterogeneous in their H i content—some possess large reservoirs, while others harbor little atomic gas (Chang et al. 2001; Buyle et al. 2006; Zwaan et al. 2013). Recent work by French et al. (2015, hereafter FYZ15), studying the molecular content of the sample presented here, has shown that, like the Alatalo et al. (2016b) sample, E+A galaxies also host significant molecular reservoirs, implying that their molecular fuel is not completely expelled in starburst or AGN-driven outflows. Additionally, Roseboom et al. (2009) and Rowlands et al. (2015) found dust and molecular gas in two small samples of E+A galaxies with a variety of ages. Combined with the FYZ15 discovery of molecular reservoirs, these results suggest that E+A galaxies may retain at least a portion of their ISM past the period of star formation cessation.
The evolution of PSB systems is inextricably tied to the fate of their gas and dust, which, due to inhomogeneous selection criteria and results, is at best inconclusive. Thus, the evolutionary pathway from merger-induced starbursts to passive, gas-poor ellipticals, though theoretically compelling, remains unclear. In order to investigate directly this transition, a coherent description of the ISM properties of post-burst galaxies is required:
- 1.Do they maintain a significant ISM mass, and if so, from where does it originate and what processes dominate its energetics?
- 2.At what level does star formation continue, is it consistent with the density of molecular material, and what mechanisms set the level?
- 3.How is dust distributed in these systems, and how does it respond to aging starlight post-burst?
- 4.Do their ISM properties support the view of E+A galaxies as rapidly transitioning systems?
Here we attempt to illuminate these questions with a detailed analysis of the broad-ranging infrared properties found in the first results of a survey of 33 E+A PSBs. The combined photometric and spectroscopic view from Spitzer, Wide-Field Infrared Survey Explorer (WISE), and Herschel constrains many of the physical conditions of the ISM in these unique objects. We present the sample in Section 2.
2. Sample Selection
The parent sample of this survey was drawn from the Sloan Digital Sky Survey (SDSS) Data Release 5 (DR5). Sources were required to possess Hα equivalent widths (EQWs) <3 Å (vs. typically ≫10 Å in normal star-forming galaxies) and Lick Hδ absorption indices >4 Å, defining a parent sample of 1122 galaxies. Sources were fitted using Bruzual & Charlot (2003) stellar population synthesis models, to infer burst properties and post-burst ages. The majority of sources have existing GALEX near-UV (NUV) and far-UV (FUV) wavelength coverage, the addition of which significantly alleviates age-reddening degeneracies. French et al. (2017, submitted) detail the UV–optical spectrophotometric fitting methodology, which provides, among other physical parameters, reliable PSB ages over the range 100–1500 Myr, with typical uncertainties of ∼20%.
Of the SDSS parent sample, five galaxies had serendipitous overlap in existing Spitzer continuum survey fields. Though these five sources were too faint to observe with IRS, the remarkable similarity in the shape of their 0.5–4 μm spectral energy distributions (SEDs) permitted an extrapolation of the optical/near-infrared (NIR) (Two Micron All Sky Survey) photometry, via template fitting, to the full E+A subsample. Sources with extrapolated 8 μm and 24 μm flux densities >4 mJy were considered for Spitzer follow-up, resulting in a subsample of 26 galaxies. An additional equivalent width cut of EW([O iii], 5007Å) < 1 Å was imposed to eliminate sources with strong AGN activity—leaving 15 galaxies selected for Spitzer photometric and spectroscopic follow-up (Program 40757, PI J.D. Smith).
The rest of the present sample (unobserved with Spitzer) was drawn from WISE detections, in which most of the SDSS E+A sample was detected. We selected 18 additional galaxies from WISE, by imposing a flux cut at W4/22 μm of 5 mJy, for a total sample of 33 galaxies. These 33 sources were all targeted for photometric and spectroscopic follow-up with Herschel (Program OT2_jsmith01_2, PI J.D. Smith). These same sources were also followed up with ground-CO imaging by FYZ15.
As required owing to sensitivity constraints, the WISE infrared-based selection undoubtedly resulted in selection of E+A galaxies that were typically more infrared-bright. Indeed, the distribution of optical-to-infrared luminosity ratios is slightly skewed toward lower values for the WISE-selected sample (though with a broad distribution), compared to the original sample of 15. However, the sample as a whole displays optical-to-infrared ratios consistent with normal star-forming galaxies (see Section 4.3).
A list of relevant sample parameters and luminosities is given in Table 1. The SDSS spectra for the sample can be found in Figure 20 of Appendix A.
Table 1. Sample Parameters
| Galaxy | Alt. ID | DL |

|
R90 |

|
SFRHα |

|

|

|
||||
|---|---|---|---|---|---|---|---|---|---|---|---|---|---|
| (SDSS) | (FYZ15) | Source | R.A. | Decl. | z | (Mpc) | (M⊙) | (arcsec) | (L⊙) | (M⊙ yr−1) | (L⊙) | (L⊙) | (K km s−1 pc2) |
| (1) | (2) | (3) | (4) | (5) | (6) | (7) | (8) | (9) | (10) | (11) | (12) | (13) | (14) |
| 0336_469_51999 | EAH17 | H | 12:44:51.69 | −01:45:35.6 | 0.048 | 222.01 | 10.05 | 4.67 | 5.93 | 0.08 | 7.72 | 9.44 | <8.41 |
| 0379_579_51789 | EAS15 | S | 22:55:06.80 | +00:58:39.9 | 0.053 | 247.20 | 10.83 | 9.70 | 6.48 | 0.68 | 7.79 | 10.22 | 8.48 |
| 0413_238_51929 | EAS02 | S | 03:16:54.91 | −00:02:31.1 | 0.023 | 104.86 | 10.08 | 11.83 | 5.80 | 0.10 | 6.84 | 9.50 | 8.11 |
| 0480_580_51989 | EAH08 | H | 09:48:18.68 | +02:30:04.2 | 0.060 | 280.94 | 10.41 | 4.48 | 5.86 | 0.18 | 7.87 | 9.78 | 8.55 |
| 0570_537_52266 | EAS05 | S | 09:44:26.96 | +04:29:56.8 | 0.047 | 215.33 | 10.57 | 8.42 | 6.28 | 0.58 | 7.58 | 9.97 | 8.48 |
| 0598_170_52316 | EAH14 | H | 11:53:06.45 | +64:17:56.5 | 0.062 | 289.99 | 10.04 | 3.15 | 6.38 | 0.21 | 8.22 | 9.74 | <8.65 |
| 0623_207_52051 | EAS12 | S | 16:13:30.19 | +51:03:35.6 | 0.034 | 153.66 | 10.01 | 18.20 | 5.78 | 0.04 | 7.81 | 9.78 | 7.94 |
| 0637_584_52174 | EAS14 | S | 21:05:08.67 | −05:23:59.4 | 0.083 | 390.19 | 11.31 | 9.68 | 6.86 | 1.78 | 8.34 | 10.48 | 9.10 |
| 0656_404_52148 | EAS01 | S | 00:44:59.24 | −08:53:22.9 | 0.020 | 88.58 | 10.24 | 13.08 | 5.36 | 0.07 | 7.03 | 9.86 | <7.79 |
| 0755_042_52235 | EAH06 | H | 07:45:49.50 | +31:22:42.2 | 0.044 | 202.74 | 10.53 | 5.52 | 6.47 | 1.08 | ... | 9.96 | <8.40 |
| 0756_424_52577 | EAS03 | S | 07:51:14.31 | +34:25:05.5 | 0.063 | 292.66 | 10.86 | 7.46 | 6.48 | 1.18 | ... | 10.01 | 9.16 |
| 0815_586_52374 | EAS13 | S | 16:27:02.56 | +43:28:33.9 | 0.046 | 213.17 | 10.95 | 11.41 | 6.18 | 0.62 | 8.03 | 10.25 | <8.52 |
| 0870_208_52325 | EAH16 | H | 09:26:57.69 | +42:31:36.6 | 0.111 | 536.37 | 10.74 | 4.52 | 6.95 | 0.81 | 8.37 | 10.45 | <9.19 |
| 0951_128_52398 | EAS07 | S | 11:19:07.62 | +58:03:14.3 | 0.033 | 148.45 | 10.54 | 7.23 | 5.90 | 0.12 | 7.50 | 10.13 | <8.03 |
| 0962_212_52620 | EAS06 | S | 10:37:57.36 | +46:14:40.3 | 0.023 | 103.02 | 10.14 | 7.10 | 5.52 | 0.08 | 7.25 | 9.24 | 8.63 |
| 0986_468_52443 | EAH04 | H | 21:14:00.54 | +00:32:06.4 | 0.027 | 122.39 | 10.18 | 8.98 | 6.15 | 0.27 | 7.12 | 9.84 | 7.96 |
| 1001_048_52670 | EAH15 | H | 10:52:20.45 | +05:49:41.6 | 0.041 | 188.94 | 10.40 | 4.72 | 6.02 | 0.34 | 7.56 | 9.96 | <8.44 |
| 1003_087_52641 | EAH11 | H | 11:05:40.71 | +05:59:54.3 | 0.054 | 251.09 | 10.61 | 4.67 | 6.43 | 0.32 | 8.00 | 10.01 | <8.59 |
| 1039_042_52707 | EAS10 | S | 13:05:25.83 | +53:35:30.3 | 0.038 | 174.40 | 10.53 | 6.44 | 5.52 | 0.05 | 7.76 | 10.20 | <8.19 |
| 1170_189_52756 | EAS11 | S | 16:10:20.49 | +41:51:17.6 | 0.040 | 181.41 | 10.74 | 10.55 | 6.13 | 0.51 | 7.80 | 10.37 | <8.24 |
| 1279_362_52736 | EAS09 | S | 12:46:26.84 | +50:47:31.4 | 0.027 | 122.73 | 10.56 | 10.68 | 5.90 | 0.17 | 7.34 | 9.94 | 8.52 |
| 1352_610_52819 | EAH09 | H | 15:08:55.09 | +37:33:29.8 | 0.029 | 132.32 | 10.21 | 5.34 | 6.10 | 0.28 | 7.39 | 9.65 | 7.89 |
| 1604_161_53078 | EAH07 | H | 11:11:17.96 | +11:33:15.8 | 0.038 | 174.24 | 10.65 | 12.50 | 6.59 | 2.17 | 8.08 | 10.38 | <8.01 |
| 1616_071_53169 | EAS08 | S | 12:39:36.05 | +12:26:20.0 | 0.041 | 187.12 | 10.67 | 13.55 | 5.99 | 0.34 | 7.59 | 10.14 | <8.00 |
| 1853_070_53566 | EAH18 | H | 16:21:00.81 | +21:10:06.1 | 0.031 | 140.93 | 10.64* | ... | ... | ... | ... | 9.96 | ... |
| 1927_584_53321 | EAS04 | S | 08:27:01.40 | +21:42:24.4 | 0.015 | 68.73 | 9.99 | 8.84 | 5.59 | 0.63 | 6.94 | 9.61 | <7.14 |
| 2001_473_53493 | EAH05 | H | 12:17:02.43 | +39:04:37.3 | 0.065 | 305.06 | 10.00 | 3.44 | 6.04 | 0.23 | 8.11 | 9.58 | 8.96 |
| 2276_444_53712 | EAH01 | H | 08:34:33.71 | +17:20:46.3 | 0.048 | 220.73 | 10.45 | 9.35 | 6.01 | 0.38 | 7.58 | 9.97 | 9.11 |
| 2360_167_53728 | EAH02 | H | 09:26:19.29 | +18:40:41.0 | 0.054 | 250.84 | 9.96 | 5.26 | 5.65 | 0.09 | ... | 9.05 | 8.93 |
| 2365_624_53739 | EAH13 | H | 10:22:00.79 | +22:09:47.4 | 0.113 | 544.68 | 11.00 | 4.61 | 7.04 | 1.53 | 8.65 | 10.65 | 9.29 |
| 2376_454_53770 | EAH10 | H | 10:33:42.71 | +21:07:40.8 | 0.105 | 505.46 | 10.24 | 3.44 | 5.87 | 0.04 | 7.88 | 10.04 | 9.26 |
| 2750_018_54242 | EAH12 | H | 14:55:05.45 | +13:16:51.6 | 0.083 | 390.55 | 10.55 | 2.83 | 6.51 | 0.29 | 7.81 | 9.88 | <8.82 |
| 2777_258_54554 | EAH03 | H | 14:48:16.05 | +17:33:05.9 | 0.045 | 206.72 | 10.34 | 7.06 | 5.54 | 0.12 | 7.76 | 9.49 | 9.20 |
Note. Column (1): SDSS Plate_Fiber_MJD notation. Column (2): FYZ15 EA designation. Column (3): primary telescope(s) used for targeting; S = Spitzer + Herschel, H = Herschel-only. All objects have been observed by Herschel. Columns (4)–(5): right ascension and declination. Column (6): SDSS spectroscopic redshift. Column (7): redshift-derived luminosity distance, assuming Planck Collaboration et al. (2016) cosmology. Column (8): stellar mass presented in French et al. (2015), derived from the MPA-JHU emission-line analysis of the SDSS DR7 data products (Kauffmann et al. 2003). Asterisk indicates stellar mass calculated using the GAMA G12/G15 WISE date products (Cluver et al. 2014). Column (9): radius encompassing 90% of the SDSS Petrosian flux in r band. Column (10): Hα luminosity derived from the MPA-JHU emission-line analysis (Aihara et al. 2011) and corrected for foreground extinction using the updated extinction maps of Schlegel et al. (1998). Column (11): aperture-corrected, Hα-based SFR from French et al. (2015), corrected for in situ extinction using the Hα/Hβ Balmer decrement. Column (12): NUV luminosity from the GALEX 2274 Å filter. Column (13): B-band luminosity, converted from SDSS photometry (see Section 4.3). Column (14): CO (1–0) integrated line luminosities reported in French et al. (2015).
Download table as: ASCIITypeset image
Table 2. DL07 SED Fit Parameters
| Galaxy |

|

|
γ |

|
|
|---|---|---|---|---|---|
| (SDSS) | (M⊙) | (%) | Umin | (%) | (L⊙) |
| (1) | (2) | (3) | (4) | (5) | (6) |
| 0336_469_51999 | 6.74 ± 0.14 | 4.5 | 2.5 | 3.26 | 9.51 ± 0.013 |
| 0379_579_51789 | 7.13 ± 0.17 | 1.8 | 2.5 | 1.99 | 9.74 ± 0.007 |
| 0413_238_51929 | 6.26 ± 0.09 | 4.7 | 8.0 | 6.11 | 9.58 ± 0.005 |
| 0480_580_51989 | 8.09 ± 0.27 | 0.4 | 10.0 | 0.00 | 11.18 ± 0.011 |
| 0570_537_52266 | 7.00 ± 0.16 | 5.5 | 1.2 | 14.90 | 9.70 ± 0.008 |
| 0598_170_52316 | 6.08 ± 1.29 | 4.7 | 5.0 | 19.14 | 9.69 ± 0.657 |
| 0623_207_52051 | 7.32 ± 0.20 | 5.5 | 0.7 | 0.37 | 9.39 ± 0.008 |
| 0637_584_52174 | 7.57 ± 0.21 | 6.5 | 3.0 | 0.81 | 10.24 ± 0.007 |
| 0656_404_52148 | 5.42 ± 0.01 | 4.8 | 15.0 | 1.63 | 8.91 ± 0.006 |
| 0755_042_52235 | 6.80 ± 0.13 | 7.5 | 5.0 | 5.34 | 9.96 ± 0.007 |
| 0756_424_52577 | 7.47 ± 0.20 | 3.6 | 3.0 | 1.64 | 10.13 ± 0.007 |
| 0815_586_52374 | 7.41 ± 0.20 | 8.5 | 1.2 | 0.48 | 9.72 ± 0.004 |
| 0870_208_52325 | 7.02 ± 0.73 | 0.8 | 1.5 | 12.37 | 9.98 ± 0.140 |
| 0951_128_52398 | 5.29 ± 0.05 | 5.0 | 15.0 | 1.95 | 8.77 ± 0.005 |
| 0962_212_52620 | 6.67 ± 0.12 | 2.7 | 20.0 | 1.37 | 10.12 ± 0.005 |
| 0986_468_52443 | 6.35 ± 0.09 | 4.7 | 15.0 | 1.82 | 9.88 ± 0.006 |
| 1001_048_52670 | 6.50 ± 0.11 | 2.9 | 4.0 | 3.33 | 9.41 ± 0.008 |
| 1003_087_52641 | 6.39 ± 0.10 | 6.9 | 15.0 | 3.46 | 9.96 ± 0.010 |
| 1039_042_52707 | 5.59 ± 0.02 | 2.4 | 30.0 | 2.23 | 9.32 ± 0.006 |
| 1170_189_52756 | 6.65 ± 0.12 | 1.9 | 12.0 | 0.89 | 9.87 ± 0.005 |
| 1279_362_52736 | 6.94 ± 0.14 | 4.6 | 6.0 | 0.08 | 9.83 ± 0.006 |
| 1352_610_52819 | 6.53 ± 0.10 | 6.5 | 7.0 | 2.40 | 9.68 ± 0.007 |
| 1604_161_53078 | 6.70 ± 0.13 | 7.3 | 2.0 | 10.36 | 9.71 ± 0.007 |
| 1616_071_53169 | 6.38 ± 0.10 | 1.8 | 4.0 | 0.66 | 9.07 ± 0.008 |
| 1853_070_53566 | 6.02 ± 0.06 | 7.3 | 10.0 | 0.80 | 9.28 ± 0.008 |
| 1927_584_53321 | 5.80 ± 0.04 | 5.3 | 10.0 | 1.94 | 8.96 ± 0.005 |
| 2001_473_53493 | 7.56 ± 0.21 | 0.3 | 25.0 | 0.00 | 11.08 ± 0.012 |
| 2276_444_53712 | 7.70 ± 0.23 | 2.7 | 10.0 | 0.38 | 10.84 ± 0.015 |
| 2360_167_53728 | 6.86 ± 0.90 | 0.0 | 30.0 | 1.97 | 10.51 ± 0.090 |
| 2365_624_53739 | 7.93 ± 0.24 | 6.2 | 4.0 | 0.95 | 10.72 ± 0.007 |
| 2376_454_53770 | 7.93 ± 0.25 | 2.1 | 6.0 | 1.18 | 10.89 ± 0.007 |
| 2750_018_54242 | 6.30 ± 0.10 | 4.4 | 30.0 | 5.77 | 10.23 ± 0.011 |
| 2777_258_54554 | 8.70 ± 0.33 | 0.6 | 15.0 | 0.00 | 10.86 ± 0.015 |
Note. Column (1): galaxy ID using SDSS notation. Column (2): derived dust mass. Column (3): derived PAH mass abundance. Column (4): lower cutoff for starlight intensity scale factor U. Column (5): fraction of dust mass in regions with U > Umin. Column (6): total integrated 3–1100 μm luminosity.
Download table as: ASCIITypeset image
3. Observations, Reduction, and Modeling
3.1. Photometry
All IRAC and MIPS photometric data were reduced as described in Dale et al. (2005). All PACS and SPIRE photometric data were reduced as described in Dale et al. (2012). The available WISE photometry was calibrated and reduced following the method presented in Jarrett et al. (2013). Spitzer photometry from IRAC and MIPS (3–160 μm) is available for 15/33 objects. WISE photometry is available for the full sample in all passbands. Herschel PACS photometry is also available for the full sample, but SPIRE data were only obtained for 15 sources. A more detailed description of the reduction for each data set can be found below. The photometry is presented in its entirety in Tables 5–7 in Appendix A.
3.1.1. Spitzer and Herschel
The photometric apertures were chosen by eye to encompass essentially all of the emission at every wavelength; the aperture corrections for the Spitzer/IRAC photometry follow those described in Dale et al. (2009). The sky was subtracted in the aperture photometry process. This subtraction was accomplished via a set of sky apertures that collectively circumscribe each galaxy, projected on the sky close enough to the galaxy to measure the "local" sky but far enough away to avoid containing any galaxy emission.
Uncertainties in the integrated photometry,  total, were formulated by quadrature sum of the calibration uncertainty, cal, and the measurement uncertainty, sky, based on the measured sky fluctuations, and the areas covered by the galaxy and the sum of the sky apertures, i.e.,

with

where σsky is the standard deviation of the sky surface brightness fluctuations, Ωpix is the solid angle subtended per pixel, and Npix and Nsky are the number of pixels in the galaxy and (the sum of) the sky apertures, respectively. For nondetections, 5σ upper limits are derived from the sky background, assuming that a galaxy spans all Npix pixels in the aperture, i.e.,

3.2. IRS Spectra
Spitzer/IRS spectral maps were obtained in small 3 × 1 half-slit-width stepped Short-Low (SL, 5.2–14.5 μm) maps and single-width Long-Low (LL, 14.5–38.5 μm) maps. All IRS data were reduced with the IRS spectral cube analysis tool, CUBISM (Smith et al. 2007a). The four spectral segments were stitched together using data from the four SL and LL submodules: SL2 (5.25-7.6 μm), SL1 (7.5-14.5 μm), LL2 (14.5–20.75 μm), and LL1 (20.5–38.5 μm). In the overlapping regions between submodules (i.e., SL2-SL1 and LL2-LL1), scaling factors were obtained by first trimming the excess pixels near the overlapping regions and then stitching them together using low-order polynomial fits from either side. The combined SL and LL spectra were initially offset, which we attributed to varying slit losses. Indeed, the color-corrected synthetic photometry computed from the SL and LL spectral segments differed significantly from the observed IRAC 8 μm and MIPS 24 μm values. The ratios between synthetic photometry and true photometry were, on average, ∼55% for stitched SL/IRAC and ∼45% for stitched LL/MIPS. SL and LL spectra were separately scaled to match the observed IRAC/MIPS fluxes, which eliminated the spectral offset without further scaling between spectral segments. The respective scaling factors can be found in Table 5 in Appendix A.
Once scaled, the SL and LL segments were blended, again using low-order polynomial fitting. After the respective SL/8 μm and LL/24 μm scaling, final spectra are then directly tied to the global galaxy photometry, significantly easing comparisons with other global results. The spectral uncertainties from the IRS pipeline are adopted, with additional uncertainty propagated from the spectral decomposition. The decomposition method is described in greater detail in Section 4.5.1.
The spectra were initially decomposed using PAHFIT (Smith et al. 2007b, hereafter SDD07; see Section 4.5.1), with only the pipeline uncertainties. The resulting fits were then subtracted from a featureless section of the continuum, and the resultant residuals were added in quadrature with the spectral uncertainties before running the final PAHFIT decomposition.
3.3. PACS Spectra
Spectra of the [C ii] 158 μm and [O i] 63 μm lines were obtained for each source. PACS spectral observations were obtained in the Un-Chopped mapping mode and reduced using the Herschel Interactive Processing Environment (HIPE) version 12.0.2765 (Ott 2010). The reductions applied the standard spectral response functions and a custom flat-field correction and flagged instrument artifacts and bad pixels (see Poglitsch et al. 2010; Kennicutt et al. 2011). The residual dark signal not removed by chopping was determined from each individual observation and subtracted during processing. Herschel's baseline exhibits significant baseline drifts, and distinctive instrumental transients are common occurrences. These instabilities result in a variable nonastrophysical continuum, which is dominated by emission from Herschel itself.
Transient signals are strongly correlated with motions of the PACS grating and of Herschel. Using fits of the Draine et al. (2007) dust model to SEDs of galaxies in the KINGFISH sample, we estimate that the expected astrophysical continuum is less than 2% of the spectral line flux detected at the line positions. Thus, the continuum adjacent to the expected location of the lines can be approximated as constant and is used to correct for transients.
The averages of the clean off-observations obtained were subtracted from observations to correct for the thermal background contributed by Herschel. Subsequently, all spectra within a given spatial element were combined. Final spectral cubes with 2 06 spatial pixels were created by combining individual pointings using the Drizzle algorithm implemented in HIPE. In-flight flux calibrations16
were applied to the data. These calibrations resulted in absolute flux uncertainties of 15% with relative flux uncertainties between each Herschel pointing of ∼10%.
06 spatial pixels were created by combining individual pointings using the Drizzle algorithm implemented in HIPE. In-flight flux calibrations16
were applied to the data. These calibrations resulted in absolute flux uncertainties of 15% with relative flux uncertainties between each Herschel pointing of ∼10%.
3.4. SED Modeling
The SEDs are fit with the models of Draine & Li (2007) (DL07) as updated by Aniano et al. (2012). Following Dale et al. (2001), Draine & Li (2007) model interstellar dust heating with a δ-function in interstellar radiation field (ISRF) intensity U, coupled with a power-law distribution Umin < U < Umax,

where U is normalized to the local Galactic ISRF, dMdust is the differential dust mass heated by a range of starlight intensities [U, U + dU], Mdust is the total dust mass, and (1 – γ) is the fraction of the dust heated by the diffuse ISRF defined by U = Umin. The minimum and maximum ISRF intensities span 0.01 < Umin < 30 and  .
.
A sum of three different SEDs is fit to each galaxy: a blackbody of temperature T* = 5000 K—appropriate for the stellar contribution to the IR at λ > 3 μm (see Draine et al. 2007; Smith et al. 2007b)—along with two related dust components. Following Draine et al. (2007), the sum can be expressed as

where Ω* is the solid angle subtended by stellar photospheres, D is the distance to the galaxy, and γ and (1–γ) are the fractions of the dust mass heated by the "power-law" and "delta-function" starlight distributions, respectively. pν(0)(qPAH, Umin) and pν(qPAH, Umin, Umax, α) are, respectively, the emitted power per unit frequency per unit dust mass for dust heated by a single starlight intensity Umin, and the same for dust heated by a power-law distribution of starlight intensities dM/dU ∝ U−α extending from Umin to Umax. Finally, the fractional contribution to total dust mass from PAHs, denoted as qPAH, varies in the model suite between 0% and 12%, with a grid spacing of 0.1%.
We adopt the choice of Draine et al. (2007) to fix Umax = 106 and α = 2 to minimize the number of free parameters. We use a minimum value of 0.01 for Umin. The remaining free parameters Ω*, Mdust, qPAH, Umin, and γ are found via χ2 minimization:

where  is the model flux density obtained after convolving the model with the bth filter bandpass,
  is the uncertainty in the observed flux density, and
  is set to
  to allow for the uncertainty intrinsic to the model.
To derive the TIR luminosities quoted in this paper, we subtract the stellar component of the fit, to isolate the dust emission and numerically integrate the result from 3 to 1100 μm. The starlight-subtracted full SED fitting method agrees well with the three-band (24 μm, 70 μm, 160 μm) prescription of Dale & Helou (2002), to within <15%. Failing to remove the starlight component can result in substantial discrepancies between the two estimates. The average starlight fraction of the full TIR luminosity (stellar blackbody not subtracted) is 40%, with a sample dispersion of ±23%—typical for nearby star-forming galaxies, but considerably lower than for most early-type galaxies (ETGs), which are stellar dominated.
Though the radiation field present in E+A galaxies likely differs from star-forming galaxies (see Section 5 for an in-depth discussion), quantities such as dust mass and TIR luminosity, output by the DL07 models, are relatively unaffected by these differences. Draine et al. (2014) found that in M31's bulge, dust mass was unaffected beyond a ∼50% level when considering a Milky-Way-type radiation field versus a more appropriate, old-star-dominated template. As the radiation field in E+A galaxies will likely be intermediate between these two extremes, changes to the assumed radiation field are not a dominant source of uncertainty. Rather, the emissivity of large grains is the dominant uncertainty in the dust mass. It should be noted that recent results (e.g., the PHAT survey; Dalcanton et al. 2012) indicate that the DL07 dust opacities may be higher than extinction-derived measures by a factor of ∼2, leading to a consistent overestimation of dust mass. Despite this, we use here the original models, which have been consistently adopted for all other extragalactic samples, such as SINGS/KINGFISH (see Section 3.5).
3.5. Comparison Samples
This work makes frequent comparisons between the E+A sample and other infrared-focused samples of galaxies, in an effort to provide useful context. In this section, we briefly describe the three most frequently referenced samples and point the reader to relevant references for further reading.
The Spitzer Infrared Nearby Galaxies Survey (SINGS) surveyed 75 nearby, primarily star-forming galaxies (see Kennicutt et al. 2003, for survey introduction). The survey targeted galaxies with a wide range of stellar masses, including examples of both the most massive early-type spiral galaxies (e.g., M81) and lower-mass, low-metallicity dwarf galaxies (e.g., Holmberg II). The sample also spans the full range of nuclear classifications, including Seyfert, LINER, and H ii dominated. See SDD07 for an in-depth analysis of the low-resolution mid-infrared (MIR) spectral properties of the SINGS sample and Draine et al. (2007) for analysis of the infrared SEDs and derivation of dust masses and PAH abundances.
The KINGFISH (Key Insights on Nearby Galaxies: A Far-Infrared Survey with Herschel) survey is directly descendant from the SINGS survey (see Kennicutt et al. 2011, for survey introduction), targeting a 61-galaxy subset of the original sample. Herschel allowed, for the first time, mapping of the cold dust and far-infrared (FIR) cooling lines in these galaxies. See Dale et al. (2012, 2017) for a description of the FIR/submillimeter photometry for the sample and Smith et al. (2017) for an analysis of the [C ii] cooling-line deficit in KINGFISH sources.
The Great Observatories All-sky LIRG Survey (GOALS) is a flux-limited survey of over 200 luminous and ultraluminous infrared galaxies—those with LIR ≥ 1011 L⊙ (LIRG) and 1012 L⊙ (ULIRG), respectively—at z < 0.09, identified by the Infrared Astronomical Satellite (IRAS). GOALS is a multiwavelength survey, combining data from Chandra, GALEX, HST, and Spitzer (see Armus et al. 2009, for survey introduction). Like SINGS/KINGFISH, GOALS targeted galaxies spanning the full range of optically classified nuclear types (Seyferts, LINERs, and H ii). Focusing on the infrared properties, Inami et al. (2013) provide details of the IRS spectra and fine-structure emission-line fluxes for the sample, while Stierwalt et al. (2014) detail the physics of the dust and gas, including properties of PAH and H2 emission and dust composition.
No single, dedicated survey has produced a similarly complete analysis of the infrared properties of ETGs. Of the SINGS sample, there are seven galaxies of either S0 or elliptical type. Additionally, several Spitzer archival studies have yielded relatively large samples of ETGs, with various photometric and spectroscopic coverage. Temi et al. (2009) composed an archival atlas of 225 nearby ETGs (E, E–S0, and S0; within 70 Mpc) that were covered in at least one of the three MIPS passbands: 24 μm, 70 μm, and 160 μm. Likewise, Rampazzo et al. (2013) composed an archival atlas of 91 ETGs with full Spitzer IRS 5–38 μm nuclear spectra. Of the 91, 58 possess IRS spectra that deviate from a purely passively evolving early-type template. Of these, 43 exhibit PAH emission (required for later comparison). And of these 43 sources, we find 16 with cross-matches in Temi et al. (2009) with detections in all three MIPS bands. TIR luminosities are calculated using the three-filter prescription of Dale & Helou (2002).
This subset of ETGs is more infrared-bright than typical, passive ETGs. Of galaxies in the Temi et al. (2009) sample, the sources detected in all three MIPS bands possess a geometric mean from LTIR/LB = 0.1 to >10× higher than the LTIR/LB ≤ 0.01 for sources with limits on 70 μm and/or 160 μm. For reference, only 40% of the Temi et al. (2009) parent sample of ETGs possessed detections in all three MIPS bands—reflecting the passive, dust-poor nature of the majority of ETGs. Most of these IR-bright ETGs are thought to be the remnants of minor mergers or interactions (Davis et al. 2015). Supplementing these 16 IR-bright ETGs with the seven ETGs from SINGS, we thus compose a sample of 23 dusty ETGs for comparison against our E+A sample.
In addition to our composite ETG comparison sample, we make use of the ATLAS3D sample—a multiwavelength, volume-limited survey of 260 ETGs out to 42 Mpc (Cappellari et al. 2011). The molecular gas content of the ATLAS3D sample is described in Young et al. (2011), while a recent paper by Lapham et al. (2017) details the FIR cooling-line properties of a small subset of the sample.
4. Results
In this section, we first present global results from the infrared photometry for the sample—such as dust masses and abundances, multiwavelength comparisons and extinction analysis, and spatial distribution. We then discuss results from the IRS and PACS spectroscopy, including PAH, nebular line, and H2 emission, ISM energetics, and cooling-line deficit. We then discuss time evolution of ISM properties, followed by an analysis of potential AGN activity. We conclude with an analysis of the star formation properties of the sample, as well as comparisons to galaxy star-forming relations. In the following section (Section 5), we discuss the significance and implications of these results regarding the prior and future evolution of these galaxies.
4.1. Infrared SEDs
The infrared SEDs of galaxies are dominated by stellar emission in the NIR (∼0.8–5 μm) and reprocessed emission from interstellar dust grains in the MIR and FIR (∼3–1100 μm).
In Figure 1 we show starlight-subtracted infrared color–color diagrams for the E+A sample, compared to the KINGFISH sample of nearby star-forming galaxies (Dale et al. 2014). In general, the E+A galaxies display infrared colors consistent with the (wide) range of KINGFISH galaxies. Many of the E+A galaxies have bluer (∼5×) 8 μm/24 μm color than KINGFISH sources at a similar 70 μm/160 μm color, indicating dominant PAH emission in the MIR. Additionally, ∼50% of the Spitzer subsample galaxies are nondetections at 500 μm, and the rest have 100 μm/500 μm > 20, both indicative of warm dust peaks.

Figure 1. FIR/submillimeter color–color diagrams. In the left panel, the stellar contribution to the 8 μm and 24 μm photometry has been removed. The solid line indicates the sequence of model SEDs for normal star-forming galaxies from Dale et al. (2014). Upward-pointing arrows denote sources with 5σ upper limits on the 500 μm photometry.
Download figure:
Standard image High-resolution imageOur SED modeling approach is explained in detail in Section 3.4. Figure 2 shows the SED fit for each galaxy, and Table 2 gives the dust model parameters, such as dust mass, polycyclic aromatic hydrocarbon (PAH) mass abundance, and derived radiation field intensity. The peak of the IR SED corresponds roughly to an effective dust temperature, and warmer grains imply a higher intensity radiation field. Figure 3 shows the SED peak wavelength for the E+A galaxies relative to the KINGFISH/SINGS matched sample. The E+A sample's IR SEDs peak, on average, at ∼70–75 μm—significantly warmer than the ∼100 μm peak of normal galaxies in the SINGS/KINGFISH samples, and comparable to (U)LIRGs in the GOALS sample (Vivian et al. 2012).

Figure 2. Globally integrated infrared/submillimeter SEDs for the sample, sorted by SDSS plate ID. The following symbols are utilized: filled black circles (Herschel), open magenta triangles (WISE), and open red circles (Spitzer). Arrows indicate 5σ upper limits. The solid curve is the sum of a 5000 K stellar blackbody (red dashed) along with Draine & Li (2007) models of dust emission from PDRs (blue dotted; U > Umin) and the diffuse ISM (green long-dashed; U = Umin). The fitted parameters from these model fits are listed within each panel along with the reduced χ2.
Download figure:
Standard image High-resolution image
Figure 3. Comparison histograms of the SED peak wavelength for the E+A and matched KINGFISH/SINGS samples. Note that the 13 SINGS/KINGFISH sources with peaks at ∼130 μm are low-metallicity dwarf galaxies. The E+A sample has infrared SEDs that peak at ∼70 μm, much warmer than the KINGFISH/SINGS mean of ∼100 μm.
Download figure:
Standard image High-resolution image4.2. Dust Masses, PAH Abundances, and DGR
Modeling of the E+A sample's infrared SEDs reveals that all sources possess significant dust reservoirs. Derived dust masses reach as high as 5 × 10⁸ M⊙, comparable to the SINGS sample. However, the modeled PAH mass fractions (qPAH) range from 0 to 8.5%, with a median value of 4.6%, substantially larger than the SINGS median of 3.2%. Indeed, nearly half (16/33) of the E+A SEDs yield a best-fit  , the highest value for SINGS.
Estimates of the molecular gas content of this sample were obtained from CO observations with IRAM and SMT, detailed in FYZ15. An αCO = 4 M⊙ (K km s−1 pc2)−1 was used (the Milky Way value; see Section 4.6.2 for αCO definition and discussion). Combining these measurements with our estimates of the dust mass, we examined the dust-to-molecular-gas ratio (DMGR = MDust/MMol). Only 17 E+A galaxies (∼50%) were detected in CO at the >3σ level. Of those 17 galaxies,  . In Figure 4, we show the distribution of DMGR for the CO-detected subsample and compare to the dust-to-total-gas ratios (DGR = MDust/[MMol + MH i]) of KINGFISH/THINGS galaxies (Sandstrom et al. 2013). The E+A galaxies possess a DMGR mean within 40% of the Sandstrom et al. (2013) DGR mean and span a similar range. This suggests that either their atomic mass fractions are low or their intrinsic DGR values are substantially higher than those of normal galaxies. One source (0623) lies above the DGR range from Sandstrom et al. (2013), suggesting that this particular source could possess a higher atomic fraction. We discuss additional possibilities for this source in Section 4.6.2. However, some studies have found a broader range of DGR among nearby galaxies than Sandstrom et al. (2013; e.g., Rémy-Ruyer et al. 2014).

Figure 4. Histogram of the DMGR for the 11 E+A galaxies with CO intensities detected at ≥3σ and modeled dust masses known to better than 50%. The SDSS plate IDs are shown for the galaxies in each bin. The red dashed line denotes the sample mean, while the black dashed line is the KINGFISH/THINGS mean DGR from Sandstrom et al. (2013). The hatched region shows the full range of DGR from Sandstrom et al. (2013). Overall, the E+A galaxies' DMGRs are consistent with the DGRs observed in nearby star-forming galaxies.
Download figure:
Standard image High-resolution image4.3. UV/Optical-to-infrared Comparisons
As described in Section 2, the E+A galaxies were selected to have very weak optical emission lines. However, the derived TIR luminosities are very comparable to galaxies in the SINGS sample, with both samples possessing medians of LTIR ≃ 7 × 10⁹ L⊙. Using the SDSS photometry and the Cook et al. (2014) ugri–UBVRC transformations, we compute a geometric mean TIR-to-B-band luminosity ratio  , with a full range of 0.044–31. This wide range is consistent with galaxies in the SINGS sample (SDD07), but even the highest values are significantly lower than those found in ULIRGs, which can reach
  (e.g., Arp 220; Armus et al. 2009; Véron-Cetty & Véron 2010).
In Figure 5 we plot the E+A MPA-JHU Hα line luminosities (Aihara et al. 2011), relative to TIR, as a function of GALEX NUV/TIR and compare them to the SINGS sample. The measured Hα emission listed in Table 1 is derived from the 3'' SDSS fiber; many sources are larger than this 3'' aperture, necessitating an aperture correction. Hα fluxes for sources that are fully resolved at 8 μm (FWHM ≳ 3'') were aperture corrected from the 3'' SDSS fiber by scaling the 8 μm flux density within the fiber to the global value. Size estimates for Herschel-only sources were obtained by adopting the mean 8 μm-to-R90 size ratio for the Spitzer sources (see Section 4.4). For Herschel sources with projected 8 μm FWHM > 3'' (only 2), a linear fit to the 3''-to-global flux ratios as a function of 8 μm size for the resolved Spitzer sources was used to derive a correction. Of the eight sources that are resolved (or projected to be resolved) at 8 μm and thus require an aperture correction, the corrections are generally modest, from 3 to 5. A single source does require a larger correction of 9.1. Performing a similar analysis on the 8 μm images of several compact SINGS sources with SDSS coverage yields Hα fluxes within a factor of two of the globally obtained values.
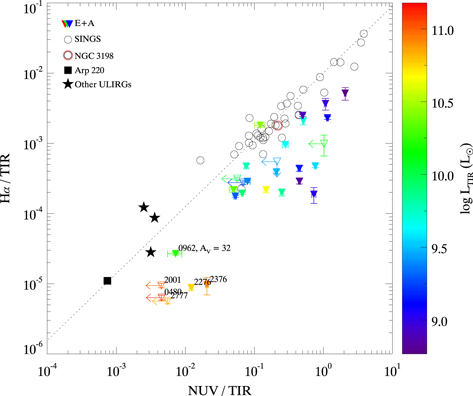
Figure 5. Aperture-corrected Hα-to-TIR luminosity ratio, plotted as a function of the NUV-to-TIR luminosity ratio for the E+A sample (downward-pointing triangles), color-coded by TIR luminosity (red is most luminous). Hα and NUV have both been corrected for galactic extinction. Downward-pointing arrows denote upper limits for the Hα/TIR ratio, while leftward-pointing arrows denote upper limits for the NUV/TIR ratio. The SINGS/KINGFISH sample is shown as open circles, with NGC 3198 (a source with detected 9.7 μm silicate absorption; SDD07) labeled with a second, concentric red circle. Arp 220 (black filled square) and several other ULIRGs (black filled stars; UGC 05101, UGC 08696, IRAS 08572+3915) are also plotted for reference (Hα, Moustakas & Kennicutt 2006; TIR, Armus et al. 2009; NUV, Brown et al. 2014). The dotted line is an attenuation curve ranging from τV = 0 to 10, assuming a Charlot & Fall (2000) extinction law. Only the slope of this curve is meaningful, given the anticorrelated impacts of attenuation on Hα/UV vs. IR emission. The trend with increasing extinction is remarkably consistent from the star-forming to ULIRG comparison samples, while E+A galaxies lie consistently below it. The six most attenuated sources, all but one of which are 22 μm selected Herschel-only sources, are labeled for reference. The single highly obscured Spitzer E+A source 0962_212_52620 is labeled with extinction measured directly from its 9.7 μm silicate absorption (AV ≃ 32; see Section 4.5.1).
Download figure:
Standard image High-resolution imageBoth SINGS and E+A sources are spread along the direction of a Charlot & Fall (2000) reddening curve,

where TλISM is the interstellar transmission function and τλ is the optical depth, at a given wavelength. We have adopted an emission-line (e.g., Hα) optical depth of τλHα = 2τλISM, as is typically assumed owing to the elevated extinction seen in H ii regions where the emission originates. We find a wide range of extinction impact.17 The ULIRGs (including Arp 220) fall at the lower left, along the extinction curve sequence from the normal galaxies. Notably, however, the E+A galaxies are offset from this sequence by a factor of ∼5, consistent with a robust young but aging stellar population and a relative dearth of ongoing star formation, resulting in more NUV than H-ionizing emission. Several of the IR-selected Herschel sources appear to possess high internal extinction, as they lie much further along the reddening curve than the SINGS sample. This raises the possibility of a "skin" effect in this small, dustier subset, in which the bulk of the stellar population could be hidden by substantial dust columns (see Section 5 for further discussion).
4.4. Spatial Extent
To examine the spatial extent of the MIR emission, we fit elliptical Gaussian functions to the IRAC 8 μm images of each galaxy. The resulting 50% enclosed flux radii (taken as the geometric mean between the Gaussian 50% radius along two elliptical axes) reveal compact emitting regions—on average 3–4× smaller than their corresponding R50 optical sizes in r band. Four of the galaxies are unresolved with IRAC, and, except for one source (0623_207_52051), the rest are very modestly resolved with FWHMs less than twice the size of the IRAC point-spread function (≲6''). In Figure 6, we show the SDSS gri image of 0379_579_51789, overlayed with 8 μm surface brightness contours. As is typical of the sample, the 8 μm emission is contained within a region ∼3× smaller than the corresponding optical emission.
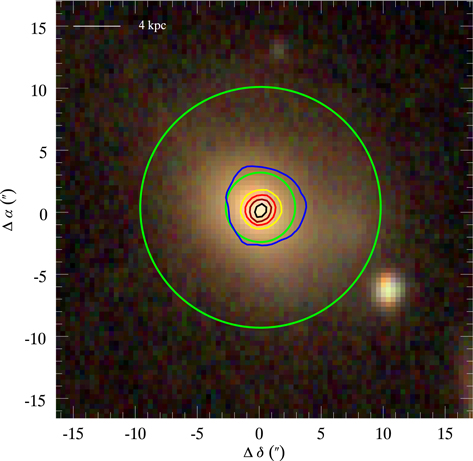
Figure 6. SDSS three-color image (gri) of 0379_579_51789 (north is right; east is up). Two green circles are overlaid, with radii equal to 0379's r-band Petrosian 50% and 90% radii, respectively (R50 ∼ 28/R90 ∼ 97, as derived by SDSS). Also shown are 0379's IRAC 8 μm surface brightness isocontours, at 1, 3, 4, 5, and 6 MJy sr−1. The 8 μm FWHM is 38, corresponding to a physical size of ∼4 kpc at the distance of 0379, approximately represented by the 4 MJy sr−1 (yellow) isocontour. The 8 μm 50% diameter is only 22, approximately overlapping the second innermost (dark red) contour.
Download figure:
Standard image High-resolution imageUsing angular sizes derived from the redshift-dependent luminosity distances, we compare the physical 8 μm FWHMs for the E+A galaxies to the 8 μm FWHMs for the GOALS sample (Díaz-Santos et al. 2010). We estimate a mean 8 μm FWHM of 2.8 kpc for the E+A galaxies, with a full range of 1.1–5.6 kpc. Of the 15 Spitzer sources, 4 are more compact than the most compact GOALS ULIRGs (d ∼ 1.5 kpc), and 4 of the remaining 11 are as compact as or more compact than the most compact GOALS LIRGs (d ∼ 2.6 kpc Díaz-Santos et al. 2010). Overall, only three sources possess FWHM >4 kpc. Five of the sources are unresolved at 8 μm—in two of which this corresponds to a physical size >3 kpc—and thus may be even more compact than estimated.
Their compactness at 8 μm seems to be consistent with the high optical central surface brightness of many E+A galaxies. Yang et al. (2006, 2008) discovered a sample of E+A galaxies possessing compact blue cores, with typical sizes <1.4 kpc. Though the presence of significant dust columns may confuse such optical classification in the majority of this sample, as well as others, the consistency of 8 μm sizes across the sample suggests that central compactness is likely a typical characteristic of E+A galaxies.
4.5. Spectral Properties
Relatively unaffected by dust attenuation, the MIR spectrum of galaxies provides unique insight into the properties of their ISM. Using the Spitzer/IRS spectra obtained for our 15-galaxy subsample, we investigate physical properties of the dust and gas and an extinction-independent analysis of residual star formation (see Section 4.10). The full sample of E+A spectra are shown in Figure 7, with various spectral features labeled. PAH emission is strongly detected in the entire sample, along with unusually bright H2 rotational emission lines, but the nebular emission lines are considerably fainter than found in typical star-forming galaxies, as discussed below.

Figure 7. Spitzer IRS rest-frame spectra of 15 E+A galaxies, sorted arbitrarily for maximum visibility. Green lines show the positions of primary PAH features, while blue lines show the positions of relevant H2 rotational lines and red lines show fine-structure emission lines. The plate number of each object is shown on the right. The spectra are PAH-dominated in all cases but are correspondingly weak in nebular emission lines.
Download figure:
Standard image High-resolution image4.5.1. PAHFIT Decomposition and Silicate Opacity
The IRS spectra were decomposed using the spectral decomposition model PAHFIT,18 described in SDD07. PAHFIT treats IRS spectra as linear combinations of four distinct components: a blackbody stellar continuum, warm dust blackbody continua, fine-structure emission features, and dust (PAH) emission features. Spectra are decomposed by minimizing the χ2 of the fit resulting from iterative addition of the four components. Fine-structure lines are fit using Gaussian profiles and the PAH emission features with Drude profiles. Figure 8 shows the decomposition of 0962_212_52620, one of the nearest and brightest sources.

Figure 8. PAHFIT decomposition of 0962_212_52620. Nebular and H2 rotational lines are shown in magenta and dust emission features in blue. The stellar continuum is shown as a cyan curve, the dust continua as red curves, and the total fit as a green curve. The attenuation profile is shown as a dotted line, with the relative extinction shown on the right-hand axis.
Download figure:
Standard image High-resolution imagePAHFIT also internally fits and corrects emission features for extinction. Extinction in the MIR is dominated by two distinctive, broad silicate features: a deep feature at 9.7 μm and a shallower feature at 18 μm. PAHFIT offers the choice of several extinction curves (e.g., Chiar & Tielens 2006; Kemper et al. 2004) and a well-mixed or foreground screen geometry.
In contrast to the rest of our Spitzer subsample, 0962_212_52620 displays significant 9.7 μm and 18 μm silicate absorption, most visible in Figure 8 in the declining continuum between 15 and 20 μm and sharp upturn thereafter. Assuming a screen geometry, PAHFIT returns a 9.7 μm silicate optical depth τ9.7 = 1.77. Using the ratio of V-band extinction-to-silicate optical depth AV/τ9.7 = 18 for the local ISM (Roche & Aitken 1984; Rieke & Lebofsky 1985), this corresponds to AV = 32. For comparison, the ULIRG Arp 220 has been estimated to possess AV ≳ 100,19 using screen extinction models and the observed 9.7 μm absorption (Smith et al. 1989; Spoon et al. 2006). In Section 4.9 we discuss the possibility of a buried AGN in this source. All other sources exhibit no detectable silicate absorption, corresponding to global extinction AV ≲ 3.
4.5.2. PAH and Nebular Line Emission
PAHs are small, carbonaceous dust grains found in galaxies' ISM across a wide range of environments. PAHs are thought to act as the principal heating sources of the neutral ISM, via photoelectrons liberated from them by the ISRF. Due to their small size (<16 Å; Draine & Li 2007), PAHs possess very low heat capacities, and thus absorption of a single UV photon heats them to high, nonequilibrium temperatures. Consequently, the resulting emission also manifests as individual transition bands. As such, PAHs are more sensitive to changes in the ISRF. See the Tielens (2008) review for an in-depth discussion of astrophysical PAH chemistry and emission processes.
PAH emission has been studied in great detail in nearby galaxies (e.g., SINGS; SDD07; Draine et al. 2007) and has been found to be fairly ubiquitous, even at high redshift (e.g., Teplitz et al. 2007), across a wide range of galaxy evolutionary stages. Due to their modest preference for UV photons (Crocker et al. 2013), some have sought to calibrate PAH emission as a star formation indicator (Peeters et al. 2004; Wu et al. 2005)—the grain fluorescence attributed to photodissociation regions (PDRs) bordering H ii regions (Povich et al. 2007). Conversely, Li & Draine (2002) showed that PAH emission need not be elicited by UV emission, casting doubt on their usefulness as star formation tracers. Supporting this, PAH emission has been seen in many nearby ETGs with visible dust lanes and seemingly small amounts of ongoing star formation (Temi et al. 2007; Vega et al. 2010; Rampazzo et al. 2013).
PAH emission features dominate the spectra of all 15 of the Spitzer-observed E+A galaxies. Indeed, the vast majority of the galaxies in the subsample (13/15) possess all of the primary features identified by SDD07 in nearby star-forming galaxies—at 6.2 μm, 7.7 μm, 8.6 μm, 11.3 μm, 12.7 μm, and 17 μm. In Figure 9 we show the distribution of E+A total integrated PAH emission strengths, relative to TIR luminosity. As a population, the E+A galaxies display much more dominant PAH emission than the dusty ETG sample or AGN-hosting star-forming galaxies and are most consistent with that of the SINGS H ii-dominated sources.

Figure 9. Histograms of total PAH-to-TIR luminosity for the E+A sample. Left: PAH/TIR for the E+A galaxies (blue) compared to the dusty ETGs (red). The E+A galaxies are, on average, 3× as fractionally PAH luminous as the ETGs. Right: PAH/TIR for the E+A galaxies compared to the SINGS AGN (orange) and H ii (green) subsamples, individually. The E+A galaxies are most similar to the SINGS H ii-dominated galaxies but display, on average, brighter PAH emission than either comparison sample.
Download figure:
Standard image High-resolution imageIndeed, the total fractional contribution of PAH emission to the infrared is high, with all but one source displaying PAH/TIR ≥ 10%. The geometric mean of 13.0% is noticeably higher than the SINGS value of 8.7%, with one source (1616_071_53169) displaying an exceptional PAH/TIR = 22.2 ± 2.1%—if confirmed, this is the highest known fractional PAH luminosity of any galaxy.
The MIR forbidden line transitions of numerous ionized species provide relatively extinction-independent probes of the radiation field. In Figure 10 we plot PAH/TIR as a function of the combined nebular emission from [Ne ii], [Ne iii], [S iv], and [S iii] 18 μm, relative to PAH. The E+A galaxies largely occupy a distinct parameter space compared to the SINGS, GOALS, and dusty ETG samples, with weaker line emission but higher PAH/TIR. In the seven E+A galaxies that possess a >5σ sum, the geometric mean line/TIR is ∼3× lower than for the SINGS H ii-dominated sample, yet their geometric mean PAH/TIR of 13.0% is significantly higher than the 9.6% of the H ii sources. GOALS sources typically possess significantly lower PAH/TIR but relative line luminosities more comparable to the E+A galaxies. The dusty ETGs live largely at the other extreme, with many possessing line-bright spectra but overall weak PAH emission—indicative of star formation or shock-dominated environments that are more hostile to the survival of small grains.
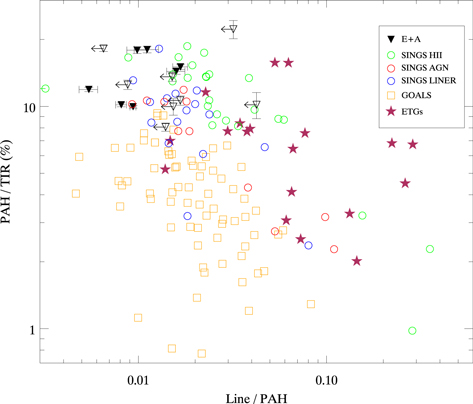
Figure 10. Fractional PAH luminosity, relative to TIR, plotted as a function of total line ([Ne ii] + [Ne iii] + [S iv] + [S iii] 18 μm) emission, relative to PAH. E+A galaxies are shown as black downward-pointing triangles, with open symbols and arrows denoting upper limits. The SINGS sample is shown as open circles (SDD07), with H ii nuclei in green, Seyfert nuclei in red, and LINERs in blue. The GOALS sample is shown as open orange squares (Armus et al. 2009; Inami et al. 2013; Stierwalt et al. 2014). As shown here (and as can also be intuited from their spectra), the E+A galaxies possess very bright PAH emission but exceptionally weak relative nebular line emission—distinct from all other comparison samples.
Download figure:
Standard image High-resolution imageThus, the ISM energetics of E+A galaxies are unusual—PAH emission is even more dominant than in normal star-forming galaxies, but nebular line emission is considerably weaker. This suggests that, in the E+A galaxies, the primary PAH heating mechanism is less well coupled to the primary line emission mechanism. We discuss this further in Section 5.
4.6. Properties of Rotational H2 Emission
As a symmetric diatomic molecule, H2 possesses no permanent dipole moment. However, at temperatures ≳80 K, its quadrupole moment allows for emission via pure rotational transitions. Excitation mechanisms range from star formation (UV pumping in PDRs; Hollenbach & Tielens 1997) to AGNs (X-rays; Draine & Woods 1992), cosmic rays (Dalgarno et al. 1999), and turbulent/shock heating (Shull & Hollenbach 1978). H2 rotational emission is seen, to some degree, in most nearby star-forming galaxies (SDD07). All galaxies in our E+A sample display some amount of H2 rotational emission. Below we discuss potential excitation mechanisms, as well as emission-based temperature and mass estimates.
4.6.1. Excitation Mechanisms
Stierwalt et al. (2014) showed that most (U)LIRGs in the GOALS sample host exceptionally strong H2 emission compared to normal star-forming galaxies, likely due to turbulent shock heating rather than UV excitation—the dominant mechanism in normal galaxies. They find that the emission ratio of H2 to the 7.7 μm PAH feature has a strong positive correlation with merger state, with the latest-stage mergers also displaying the highest H2/7.7 μm. Much of the power in the 7.7 μm PAH feature is thought to arise from the photoexcitation of ionized grains (Li & Draine 2001). Thus, H2/7.7 μm traces the importance of nonradiative heating to the observed H2 emission (see Section 4.7). In Figure 11, we show the sum of the H2 S(0–3) luminosities relative to the 7.7 μm PAH luminosity, as a function of both the H2 luminosity and H2/TIR. The E+A galaxies exhibit a slightly larger than order-of-magnitude range in H2/PAH luminosity. A majority (10/15) of the E+A galaxies display far higher H2/7.7 μm ratios than are seen in star-forming galaxies, which have a geometric mean H2/7.7 μm = 0.013 (SDD07)—4× lower than the E+A value of 0.053. The E+A galaxies are, however, quite consistent with the most luminous GOALS sources (Stierwalt et al. 2014), but at substantially lower total luminosity. The E+A galaxies are also strong outliers in H2/TIR, with values consistently higher than GOALS or SINGS sources, but very comparable to a number of the dusty ETGs.

Figure 11. Left: ratio of total H2 S(0–3) emission to 7.7 μm PAH emission, as a function of H2 luminosity. Arrows denote 4σ upper limits. Orange open squares denote the GOALS sample (Stierwalt et al. 2014), filled magenta squares denote the dusty ETGs, and the green, red, and blue open circles denote SINGS H ii, AGN, and LINER nuclei, respectively. The ETGs have been corrected for 7.7 μm depletion using the geometric mean 7.7 μm/11.3 μm for the E+A sample. The E+A galaxies are shown as filled downward-pointing triangles. The dotted line is the Ogle et al. (2010) H2/7.7 μm turbulent-heating (e.g., MOHEG) threshold. The E+A galaxies are overall more luminous than either the dusty ETGs or SINGS but less luminous than GOALS sources. Right: same as the left panel, but plotted as a function of H2/TIR on the x-axis. The majority of E+A galaxies display significantly stronger H2 emission, relative to TIR, than the majority of either SINGS or GOALS and are most consistent with the dusty ETGs. In the majority of E+A galaxies, an unusually high 0.1%–1% of their TIR luminosities appears to be from H2 rotational emission.
Download figure:
Standard image High-resolution imageOf the 23 galaxies in the dusty ETG sample, eight have bright H2 emission, relative to both their TIR and PAH luminosities. Most of the ETGs show indications of artificially high H2/7.7 μm ratios due to small-grain depletion by AGNs or a soft exciting radiation field, as evidenced by 7.7/11.3 PAH band ratios significantly below 1 (see Sections 4.8 and 4.9). This effect is corrected by deriving a 7.7 μm using the geometric mean 7.7/11.3 for the E+A sample (little to no depletion; 7.7/11.3 = 2.8). Even after this correction, the eight ETGs show high H2 relative to both 7.7 μm and TIR—though note that TIR luminosities are much fainter than the E+A galaxies (∼10–100× lower). It is interesting to note that these dusty ETGs all possess either nuclear dust rings or sporadic dust patches, as well as strong shells or tidal streams, both suggestive of relatively recent gas-rich mergers/interactions (Rampazzo et al. 2013)—unlike "traditional" dust-poor pure ellipticals.
Much recent work has focused on identifying contributions to H2 emission not associated with the radiation field, particularly in cases where these nonradiative mechanisms dominate. Ogle et al. (2010) discovered a class of H2-emitting radio galaxies, which they dubbed molecular hydrogen emission line galaxies (MOHEGs), all with exceptional H2/7.7 μm ≥ 0.04—an empirically derived radiative heating limit determined by comparing to the SINGS star-forming sample. Galaxies with H2/7.7 μm above the Ogle et al. (2010) threshold of 0.04 are, then, assumed to be dominated by H2 nonradiative H2 excitation mechanisms. Of the 15 Spitzer-observed E+A galaxies, eight sources have detected H2 lines that satisfy the H2/7.7 μm ≥ 0.04 MOHEG criterion.
Cluver et al. (2013) detected a sample of MOHEGs in Hickson Compact Groups (HCGs), all with significant intragroup interactions. Several galaxies in their sample have confirmed strong AGN activity and thus may exhibit artificially high H2/7.7 μm values owing to PAH grain depletion. However, they determine that the H2 emission present in the vast majority of their sample is driven by shock heating due to ram pressure from the ongoing intragroup interactions. The PAH band ratios of the E+A sample (see Section 4.8, Figure 14) show little evidence for preferential small-grain destruction, suggesting that shock (or turbulent) heating of the molecular gas is a viable mechanism for producing the observed emission. These shocks are thought to be magnetohydrodynamic (MHD) and intrinsically low velocity in nature, and particularly efficient at cooling via H2 rotational lines (Draine et al. 1983).20
It seems that for the majority of the E+A galaxies, turbulent heating is the most viable option for producing the observed strong H2 emission, due to consistently high H2/7.7 μm ratios and little evidence for small-grain depletion. Indeed, with H2 contributing ∼1% of TIR, 0815_586_52374 possesses some of the highest known fractional H2 emission in galaxies—rivaled only by the intragroup shock ridges between interacting galaxies, such as those in Stephan's Quintet (SQ; Cluver et al. 2010; Appleton et al. 2017), or very IR-faint post-merger ETGs. Two potential origins for the turbulent heating are (1) the effects of a recent galaxy interaction/merger and (2) radio-mode (jet) feedback from an SMBH. Each of these mechanisms will be discussed in greater detail in Section 5.
4.6.2. Estimating Mass and Temperature
In the cold, dense interiors of molecular clouds, conditions do not allow for the excitation of H2's quadrupole transitions, leaving the bulk of the molecular gas mass essentially dark. The only reliable method of tracing this gas is via rotational transitions of the carbon monoxide (CO) molecule, which do emit at the ∼10 K temperatures present deep in molecular clouds. Converting the observed CO brightness to a molecular gas mass requires a CO-to-H2 conversion factor, αCO,

where αCO is in units of M⊙ (K km s−1 pc2)−1.
Togi & Smith (2016), by adopting a power-law temperature distribution, developed a method to fit and extrapolate the H2 excitation diagrams to derive estimates of the total H2 mass, independent of CO. The slope of the fitted power law is directly related to how much of the H2 is warm (above a typical "cold" threshold of ∼50 K), which in turn is related to the conditions present in the ISM. We adopt this method for the E+A sample and compare to the estimates from CO.
For robust estimates, sources must possess at least three H2 rotational lines with signal-to-noise ratio (S/N) ≥ 5, one of which must be the 17.04 μm S(1) line. The H2 column density is assumed to be distributed via the power law,

where dN is the number of H2 molecules in the temperature range T to T + dT. The model takes three parameters: the upper (Tu) and lower (Tl) temperature limits, as well as the power-law index, n. Tl is the lowest temperature found in the range of possible temperatures required to explain the observed excitation. Using the power-law index required to match the MIR rotational line fluxes and extrapolating down to Tl =50 K, the estimated H2 mass is in good agreement with the CO-derived estimates for nearby galaxies (Togi & Smith 2016). As the power-law model is extrapolated down to the Tl "temperature floor," the assumption of 50 K is perhaps the most significant model uncertainty. For example, it is possible that Tl could be elevated in very turbulent systems, leading to an overestimation of H2 mass.
Of the 15 Spitzer sources, 11 possess at least three H2 lines detected at 5σ. Figure 12 shows the excitation diagrams for the 11 selected galaxies. We compare the model estimates to the FYZ15 CO-derived masses, for which an αCO = 4 M⊙ (K km s−1 pc2)−1 was assumed.
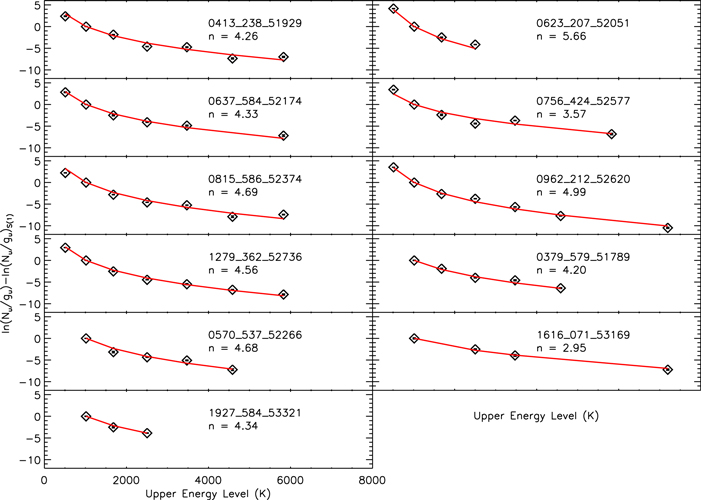
Figure 12. Power-law model fits (red solid lines) to the observed H2 rotational line ratios (black diamonds) for our 11 selected galaxies. Several sources display nearly the full compliment of MIR H2 rotational lines. The relatively shallow power-law slopes indicate that in many cases the molecular gas is quite warm. Uncertainties are shown, though in most cases they fall within the symbols.
Download figure:
Standard image High-resolution imageThe resulting masses are given in Table 3, along with the ratio of model to CO-based masses. The power-law model masses are in good agreement with the estimates from CO, to within a typical factor of 2–4 (similar to the model uncertainties), for all but three sources. Cases where the model estimate is quite low (e.g., 0756) could be explained by a decreased αCO, as is typically assumed for turbulent conditions in ULIRG molecular clouds. However, cases where the model estimate is high are harder to explain (e.g., 0623, 0815). The most likely explanation is that these sources have elevated H2 temperature floors above 50 K. Indeed, this seems to be supported by these two sources' high H2/7.7 μm ratios (both among the top three in the sample), indicating particularly turbulent ISM. The derived power-law slopes are shallower than those found for SINGS galaxies (Togi & Smith 2016) and comparable to those of ULIRGs (A. Togi, private communication) and turbulent systems such as SQ (Appleton et al. 2017), indicating that much of the gas is warm.
Table 3. Power-law H2 Model Results
| MMol(Model) | |||
|---|---|---|---|
| Galaxy | (108 M⊙) | n |

|
| (1) | (2) | (3) | (4) |
| 0379_579_51789 | 7.5 | 4.20 ± 4.20 | 0.62 |
| 0413_238_51929 | 3.63 ± 0.63 | 4.26 ± 0.04 | 0.71 |
| 0570_537_52266 | 25.0 | 4.68 ± 4.68 | 2.04 |
| 0623_207_52051 | 27.5 ± 18.8 | 5.66 ± 0.02 | 7.9 |
| 0637_584_52174 | 43.8 ± 7.8 | 4.33 ± 0.04 | 0.88 |
| 0756_424_52577 | 6.0 ± 1.5 | 3.57 ± 0.06 | 0.10 |
| 0815_586_52374 | 53.8 ± 3.8 | 4.69 ± 0.02 | >3.9 |
| 0962_212_52620 | 65.0 ± 2.4 | 4.99 ± 0.01 | 3.7 |
| 1279_362_52736 | 12.0 ± 1.0 | 4.56 ± 0.02 | 0.87 |
| 1616_071_53169 | 0.25 | 2.95 ± 2.95 | >0.06 |
| 1927_584_53321 | 0.96 | 4.34 ± 4.34 | >1.75 |
Note. Column (1): galaxy ID. Column (2): power-law model-derived H2 mass (in units of M⊙). Column (3): power-law index of best-fit model. Column (4): ratio of power-law-derived to CO-derived molecular gas mass. CO estimates are taken from FYZ15 (see Table 1), assuming αCO = 4.
Download table as: ASCIITypeset image
4.7. FIR Line Deficit
The primary heating source of the diffuse ISM is thought to be the photoelectrons liberated from small dust grains, such as PAHs, by ionizing radiation. The photoelectric heating efficiency of the gas is defined as the ratio of gas heating from photoelectrons to total dust heating from the absorption of UV and optical photons (Mochizuki 2004). The gas then cools via emission from collisionally excited infrared forbidden lines such as [C ii], [N ii], [O i], and [Si ii]. Of these lines, the [C ii] 158 μm and [O i] 63 μm lines dominate in low- and high-density environments, respectively (Wolfire et al. 2003). These two transitions are thought to be responsible for >90% of neutral gas cooling (Kaufman et al. 2006). Malhotra et al. (2001) showed that the photoelectric heating efficiency decreases in galaxies with higher dust temperatures—a measure of ISRF intensity. When the ISRF intensity is high enough such that the PAH photoionization rate is elevated above the electron capture rate, the ionization potential increases, thus decreasing photoelectric yields (Croxall et al. 2012). As the cooling-line emission is directly proportional to the photoelectric efficiency, a decrease in photoelectric efficiency results in a deficit of cooling-line emission.
[O i] is only detected (very modestly; above 3σ) in three sources, while 17/33 sources are detected in [C ii]. In Figure 13 we show the [C ii]/TIR ratio for our sample, as a function of 70 μm/100 μm FIR color (a measure of the dust temperature). Most galaxies in our sample show a significant deficit in [C ii] emission, indicative of inefficient gas heating. There appears to be a modest negative trend with 70 μm/100 μm color. Though the E+A sample displays a wide range of deficits with many upper limits, 85% lie below the KINGFISH mean of 0.48%. A significant fraction of the sample (∼25%–30%, including upper limits) falls below the full KINGFISH range, overlapping with GOALS ULIRGs. Many of the E+A galaxies are, however, very consistent with the range of deficits seen in dusty ETGs from the ATLAS3D sample (Lapham et al. 2017), which are largely intermediate between the KINGFISH and GOALS ULIRG samples. Several sources display severe deficits (upper limits at <0.02%)—comparable to GOALS ULIRGs and some high-redshift submillimeter galaxies (see Díaz-Santos et al. 2013; Smith et al. 2017).

Figure 13. Left: [C ii] deficit ([C ii]/ TIR) plotted as a function of 70 μm/100 μm color. The E+A galaxies are shown as black filled circles, where open circles with downward-pointing arrows denote 3σ upper limits. The double-headed arrows denote the ranges of various comparison samples: the KINGFISH (Smith et al. 2017) full range (blue), 68% range (red), and mean (magenta), dusty ETGs (green), and GOALS ULIRGs (orange; Díaz-Santos et al. 2013, assuming a multiplicative factor of 2 for FIR-to-TIR conversion). We also show individual regions of the intergalaxy shock ridge in SQ (light-blue stars; Appleton et al. 2013). Right: [C ii]-to-total PAH emission as a function of the 7.7 μm/11.3 μm PAH band ratio. The E+A galaxies follow the same schema as the left panel. The blue plus signs correspond to resolved regions within the star-forming galaxies NGC 1097 and NGC 4559 (Croxall et al. 2012). The E+A galaxies seem to posses significantly deeper [C ii] deficits than most normal, star-forming galaxies, relative to both TIR and PAH emission.
Download figure:
Standard image High-resolution imageThe E+A sample is inconsistent with the surplus of (shock-excited) [C ii] emission seen in the individual shock regions of SQ (Appleton et al. 2013)—which are colliding at 1000 km s−1. This is interesting, as the E+A galaxies' H2 rotational emission (see Section 4.6.1) approaches the emission seen in SQ. This suggests that the turbulent heating found in E+A galaxies is altogether different from the fast shocks seen in SQ (which couple the [C ii] and H2 cooling via a turbulent cascade) and is, instead, a primarily low-velocity phenomenon.
We also plot the ratio of [C ii]/PAH emission, as a function of the 7.7 μm/11.3 μm PAH band ratio. The 7.7 μm feature is thought to originate from ionized grains and the 11.3 μm feature from neutral grains. Thus, the 7.7 μm/11.3 μm traces the grains' ionization state. In this sample, we see a strong decrease in the photoelectric efficiency ([C ii]/PAH) as the grains become more ionized (7.7 μm/11.3 μm), similar to trends seen in nearby star-forming galaxies (Croxall et al. 2012). However, the PSBs lie systematically ∼10× below the trend for nearby star-forming galaxies, indicating particularly low photoelectric heating.
Compared to resolved regions within NGC 1097 and NGC 4559 (Croxall et al. 2012), the three sources detected in [O i] are all deep outliers in the cooling-line ratio ([C ii]/[O i])—as low as 0.04 in one case. The total line luminosity relative to TIR in these cases—([C ii] + [O i])/TIR —is high, with the two [C ii] detections possessing ([C ii] + [O i])/TIR >0.01. Additionally, both of those sources possess deep [C ii] deficits, below 0.1%. These characteristics—deep [C ii] deficit and dominant [O i]–are typically seen in ULIRGs, with dense-gas-dominated ISM. Such dominant [O i] is expected in MHD-driven molecular shocks, where carbon is largely neutral (Draine et al. 1983)—consistent with the properties of H2 emission discussed in Section 4.6.1.
4.8. Time Evolution of the ISM
The derivation of the E+A galaxies' post-burst ages involves the decomposition of their UV–optical SEDs and detailed stellar population modeling, described in an upcoming paper by French et al. (2017, submitted). Many other works have investigated the evolution of the ISM in PSB galaxies (e.g., colors, AGN activity, metallicity; Alatalo et al. 2014, 2017; Yesuf et al. 2014). Here we examine relationships between the properties of PAH emission and ISM content of the E+A sample with post-burst age.
As described in Section 4.5.2, PAH emission is closely linked to the ISRF. The primary emission features (6.2, 7.7, 8.6, 11.3, 12.7, and 17 μm) are thought to arise from grains of different characteristic sizes and ionization states (Draine & Li 2007). As the stellar populations of post-burst galaxies age, the radiation field heating dust grains should become softer. Thus, we might expect to observe a time evolution of E+A galaxies' dust emission properties with post-burst age. In Figure 14, we show luminosity ratios of the primary PAH bands, each as a function of post-burst age. Surprisingly, all ratios remain nearly flat with age, and most lie comfortably within the SINGS 10%–90% ranges. When discounting the three highest-value sources, there appears to be a very slight negative trend with age in the shortest-wavelength bands, similar to the trend observed in Roseboom et al. (2009).

Figure 14. Luminosity ratios of the six primary PAH features, plotted as a function of post-burst age (K. D. French et al. 2017, in preparation). The dashed lines correspond to the SINGS sample 10%–90% range for the given ratio, from SDD07. The E+A galaxies appear to possess ratios in good agreement with SINGS.
Download figure:
Standard image High-resolution imageIn Figure 15, we plot fractional PAH emission (PAH/TIR) as a function of post-burst age. We observe a generally strong negative trend of PAH/TIR with burst age, but with an apparent peak occurring at ∼400 Myr. Suppression of PAH/TIR is expected in the presence of grain destruction—PAHs are very small and much more easily destroyed than larger grains, while larger grains contribute the bulk of the infrared emission. Thus, PAHs will contribute fractionally less to TIR in the presence of grain destruction. Interestingly, it seems that the effects of grain destruction accumulate with age in the E+A galaxies. In fact, the oldest E+A galaxies approach the PAH/TIR < 10% seen in the dusty ETG sample.

Figure 15. Total PAH/TIR, plotted as a function of post-burst age (K. D. French et al. 2017, in preparation). Sources are color-coded by TIR luminosity. A generally decreasing trend is seen, with the oldest sources displaying the lowest PAH emission, relative to TIR.
Download figure:
Standard image High-resolution imageIt has been suggested that a time delay should exist between star formation and PAH emission. Galliano et al. (2008) proposed that, following a burst of star formation, PAH emission should be absent for the first ∼400 Myr, until PAH production begins in the atmospheres of carbon-rich asymptotic giant branch (AGB) stars, and they use this to explain the relative weakness of PAH emission in low-metallicity starbursting dwarf galaxies. While we do see some evidence for a peak in PAH/TIR at ages of ∼400 Myr, more recent work by Sandstrom et al. (2010) showed no correlation between the distribution of PAH emission and AGB stars in the Small Magellanic Cloud (SMC). They do observe a strong correlation between the distribution of PAH and CO emission, potentially indicating that PAH grain growth occurs predominantly in the cold, dense interiors of molecular clouds. Zhukovska et al. (2016, and references therein) also argue that galaxies' dust production in general is dominated by interstellar grain growth in the cold neutral medium, rather than stellar-related production (e.g., winds and supernovae). They find that in a typical star-forming galaxy, grain destruction by supernovae and growth in the ISM should reach a "steady state" in ∼140 Myr (after the onset of hydrodynamic simulations). They do suggest that carbonaceous seed grains supplied by AGB stars, on which gas-phase metals from the ISM could accumulate, could accelerate dust regrowth during early galactic evolution.
In Figure 16, we plot the observed dust mass and molecular gas mass for the sample, each normalized to the modeled stellar mass produced in the burst, as a function of post-burst age. To assess the contribution of dust produced solely from the aging stellar population, we employ theoretical dust yield models for single stellar populations, including AGB stars. The models are calculated for solar metallicity as described in Zhukovska (2008), assuming a Kroupa (2001) initial mass function (IMF). Dust yields for AGB stars are taken from Zhukovska et al. (2008). Models of dust destruction in hot gas are also included. In conditions found in ETGs, dust grains are efficiently destroyed by thermal sputtering on the timescale τspu = 105 (1+(106 K/Tgas)3) ne−1 yr for typical 0.1 μm sized grains (Dwek & Arendt 1992). For simplicity, we consider grain sputtering in a hot gas with the fixed density and temperature for three cases: (1) nH = 0.002 cm−3, Te = 1.5 × 10⁷ K; (2) nH = 0.001 cm−3, Te = 106 K; and (3) a lower-density gas with nH = 7 × 10⁻⁵ cm−3, Te = 1.5 × 10⁷ K, similar to the outer regions of elliptical galaxies (Mathews & Brighenti 2003). Dust is rapidly destroyed in the ISM in the first two cases on the timescales of 50 and 200 Myr, respectively, and on the longer timescale τspu = 1.5 Gyr in the third case. Possible dust destruction by blast waves from Type Ia supernovae is neglected.

Figure 16. Left: ratio of dust mass per unit total stellar mass, as a function of time since the burst (post-burst age; K. D. French et al. 2017, in preparation). Only sources with Mdust/M*,burst ≥2σ are shown, where σ is the total propagated uncertainty from each quantity. The red diamonds are the median Mdust/M*,tot values in three age bins: 0–300 Myr, 300–600 Myr, and >600 Myr, the locations of which are denoted by the blue dashed lines. The three magenta stars are ETGs in SINGS with M*,tot > 1010M⊙ and well-measured dust masses. Their stellar populations are assumed to be old, though uncertain, denoted by the right-facing arrows. Middle: dust mass per unit burst stellar mass, as a function of post-burst age. Only sources with Mdust/M*,burst ≥2σ are shown. The red diamonds are the median Mdust/M*,burst values in the three age bins. The four curves are the theoretical AGB dust models of Zhukovska (2008; solid—no destruction, dot-dashed—low-density, dashed—106 K, dotted—1.5 × 10⁷ K; see Section 4.8). The declining trend is even more visible here. Right: ratio of observed molecular gas mass per unit burst stellar mass, also plotted as a function of post-burst age. Only sources detected in CO (≥3σ) and with MMol/M*,burst ≥2.5σ are shown. The solid curve is an updated theoretical model from Zhukovska (2008), showing the total injection of gas from stellar evolution, for the modeled burst, over time. For reference, by ∼300 Myr the formed stellar population has returned ∼10% of its stellar mass to the ISM. As the vast majority of E+A galaxies lie above the curve, they appear to possess significantly higher gas masses than can be explained by stellar recycling alone.
Download figure:
Standard image High-resolution imageWe observe a steep negative trend of dust-to-burst stellar mass with age (Mdust/[f*,burst M*]), similar in slope to the two high-density sputtering models. Like the trend with PAH/TIR, this implies that the effects of dust destruction continue to accumulate in E+A galaxies, rather than reaching the steady state predicted by Zhukovska et al. (2016), and potentially points to sputtering in a hot, low-density medium. It should be noted that older post-burst populations are more likely to have originated from longer, stronger bursts (Snyder et al. 2011), thus creating an intrinsic anticorrelation between age and 1/f*,burst (see K. D. French et al. 2017, in preparation) even disregarding Mdust. However, this effect is much weaker than the observed trend. Indeed, the trend remains even when considering Mdust/M*,tot, though with higher scatter. All sources younger than 400 Myr possess considerably higher measured dust masses than can be explained by recycled input from AGB stars. Older sources, however, lie closer to the curve. However, all sources possess more dust than can be explained by AGB star input when accounting for destruction using either of the two high-density sputtering models.
In terms of the gas produced by stellar recycling, due to limited H i observations, we do not have total gas mass. But using molecular mass as a lower gas mass limit, we note that, although there is little observable trend in the molecular gas-to-burst stellar mass with age, the majority of sources lie significantly above the Zhukovska (2008) model. For these sources, it seems that at least a significant fraction of the ISM must be preexisting, rather then regrown via stellar recycling. This has interesting implications for the evolution of these galaxies, discussed further in Section 5. There are several sources, however, that fall below the model prediction, implying that in these few cases the ISM may, indeed, have been regrown by gas injection from the burst stellar population.
4.9. AGN Diagnostics
This sample was optically selected to possess weak to nonexistent [O iii] emission, thus attempting to eliminate sources with strong AGNs. Additionally, eight of the E+A galaxies have existing Chandra coverage. De Propris & Melnick (2014) used the X-ray luminosities to place limits on AGN luminosity in these eight sources at <0.1% of the Eddington luminosity—consistent with our [O iii] selection. However, the sample possesses significant dust reservoirs and a range of extinction, introducing the possibility of obscured AGNs that could contribute significantly to the ISM energetics—as have been found in other PSB studies (e.g., Ko et al. 2013; Yesuf et al. 2014; Alatalo et al. 2017). Additionally, in Section 4.6.1 we revealed that the majority of galaxies in the sample display strong, shock-powered H2 rotational emission. AGN feedback has been proposed as a potential mechanism for eliciting similar emission in some ETGs, motivating a closer study in the E+A sample. In this section we investigate various AGN indicators to probe the possibility of both obscured and radio-mode AGNs. We find evidence for one deeply embedded AGN and some evidence for excess radio activity in an additional three sources. In the vast majority of sources (29/33), however, we find no compelling evidence of the presence of an AGN.
4.9.1. Probing Obscured AGNs
Several high-ionization forbidden transitions exist in the MIR and serve as extinction-insensitive probes of the presence of AGN activity: mainly [Ne v] at 14.32 μm and [O iv] at 25.96 μm. [Ne v] is absent in all of our IRS spectra, ruling out the presence of strong AGNs. However, at low luminosities [Ne v] often becomes blended with the 14.3 μm PAH feature during decomposition, making it difficult to rule out the presence of low-luminosity AGNs (SDD07).
[O iv] is more reliable at low luminosities; however, it is also blended, this time with [Fe ii] (SDD07). Satyapal et al. (2004) calibrated the ratio of [O iv]/[Ne ii] as a LINER/AGN indicator. In the single source where both lines are detected (0756_424_52577),  ([O iv]/[Ne ii]) = −0.55. If the detected line is entirely [O iv], this ratio could be consistent with either very low level AGN or LINER activity. However, the presence of a luminous, buried AGN is highly unlikely.
0962_212_52620, the source with detected silicate absorption, is not detected in [O iv]. To more robustly probe the presence of a buried AGN, we use the classification scheme of Spoon et al. (2007): combining the apparent silicate strength with the 6.2 μm equivalent width (EQW). Silicate strength is defined as

where fobs and fcont are the observed 9.7 μm flux density and the local MIR continuum flux density, evaluated at 9.7 μm, respectively. We estimate SSil ≈ –1.5 for 0962, combined with a 6.2 μm EQW of 0.78 μm. These place 0962 in Spoon et al. (2007) class 2C—populated primarily by PAH-dominated ULIRG spectra. Thus, we find no evidence of a buried AGN in any of the Spitzer sources.
Another potential PAH-based AGN indicator can be found in the 7.7 μm/11.3 μm PAH band ratio, which is tied to ionization state and grain size distribution. SDD07 observed a strong suppression in 7.7/11.3 with increasing [Ne iii]/[Ne ii], which was later confirmed in larger surveys (e.g., Diamond-Stanic & Rieke 2010). The majority of SINGS galaxies with 7.7/11.3 < 3 are either optically confirmed AGNs or LINER types. The majority of the E+A galaxies have 7.7/11.3 < 3, consistent with their optical and few reliable [O iv]/[Ne ii] LINER classifications. Three sources possess 7.7/11.3 < 1.5, below the lowest 10% of the SINGS sample. However, in this weak suppression regime, LINERs and true AGNs are virtually indistinguishable. When combined with the modest [O iv] detections and, more often, nondetections, the 7.7/11.3 ratios do not provide any further evidence of strong buried AGNs and, instead, further support their optical LINER classification.
Though not observed with Spitzer IRS, one Herschel-only source (2360_167_53728) displays extreme WISE colors of [3.4]–[4.6] = 1.8 and [4.6]–[12] = 2.8, which place it at the top of the WISE AGN selection region from Jarrett et al. (2011). Its WISE photometry is best matched by the NIR/MIR spectrum of the ULIRG IRAS 08572+3915 (T. H. Jarrett 2018, private communication)—an obscured AGN host. Indeed, as seen in Figure 2, the rise from 3.4 μm to 4.6 μm is poorly fit by the Draine & Li (2007) starlight + dust SED model, potentially indicating the presence of a very hot dust component peaking at ∼5–10 μm. However, the TIR luminosity of 3.3 × 10¹⁰ L⊙ is 50× lower than that of IRAS 08572+3915, making it a truly peculiar source.
4.9.2. Radio Activity
Six of the E+A galaxies were detected in the Very Large Array (VLA) Faint Images of the Sky at Twenty-Centimeters (FIRST) survey (Becker et al. 1995), and another two in the NRAO VLA Sky Survey (NVSS; Condon et al. 1998). Using the observed 1.4 GHz flux densities, we compare the E+A galaxies to the radio-infrared correlation—an empirical relationship between star-forming galaxies' infrared and radio luminosities (de Jong et al. 1985; Helou et al. 1985). In star-forming systems, the radio emission is thought to arise from nonthermal synchrotron emission caused by the acceleration of cosmic rays in supernova remnants (Condon 1992).
It is worth first noting that the detection rate of the E+A galaxies in FIRST is significantly lower than for normal star-forming galaxies—their radio luminosities are intrinsically lower. Among a sample of 258 SDSS DR14-selected star-forming galaxies—LHα ≳ 107 L⊙, or SFR ≳1 M⊙ yr−1 (Kennicutt et al. 1994)—with redshifts 0.049 < z0.051, the FIRST detection rate is ∼35%. In comparison, the E+A detection rate is only 18% (6/33)—significantly lower.
We plot the eight E+A galaxies' radio and TIR luminosities in Figure 17, against the star-forming comparison sample of Bell (2003). Four of the E+A galaxies lie within the locus of the star-forming comparison sample. Three sources (0756_424_52577, 1352_610_52819, and 1604_161_53078), however, appear to be offset—0756 significantly so.

Figure 17. Radio–infrared correlation. For the eight E+A galaxies possessing FIRST and/or NVSS coverage, their 1.4 GHz luminosity density is plotted against their TIR luminosity (blue triangles). The diverse sample of star-forming galaxies from Bell (2003) is plotted for comparison (black circles). The three sources with apparent 1.4 GHz excess are labeled.
Download figure:
Standard image High-resolution imageRadio excess is commonly interpreted as evidence for the presence of a radio AGN. Both sources detected in FIRST (1352, 1604) are unresolved, with a resolution of ∼5''. For 1352, this is comparable to the optical size. However, 1604's optical size is 125—much larger than the unresolved 1.4 GHz emission. Though a true central point source cannot be determined, AGN activity remains a plausible explanation.
0756's position relative to the radio–IR correlation shows a significant excess at 1.4 GHz, a generally unequivocal indication that a radio AGN is present in the system. However, this particular galaxy was detected in NVSS, which possesses a much larger beam size—FWHM ≃ 45''. SDSS imaging shows that this galaxy is interacting with another galaxy (not targeted by SDSS), with a separation significantly smaller than the 45'' beam, making it possible that some of the observed emission is associated with the companion. 0756 is also the only source with detected [O iv], as discussed in the previous section.
4.10. Star Formation
The stellar population modeling effort detailed in French et al. (2017, submitted) reveals that the E+A galaxies possessed, on average, peak SFRs in excess of 100 M⊙ yr−1, during the height of their past starbursts. Limits from Hα suggest that these galaxies possess current SFRs that are >100× lower than their former peaks. However, the sample was selected to possess very weak Hα, introducing a potential bias. To robustly assess the current star-forming properties and thus PSB nature of the sample, we adopt three different infrared SFR calibrations, using a mixture of photometric and emission-line-based tracers, each discussed below. SFRs for each galaxy, using each tracer, are given in Table 4. Many of these SFRs may be upper limits, however, due to the presence of an unusual, old-starlight-dominated radiation field. See Sections 4.10.2 and 5 for further discussion of these limitations.
Table 4. Global Star Formation Rates
| Galaxy | TIR | 12 μm | [C ii] 158 μm | [Ne ii]+ [Ne iii] |
|---|---|---|---|---|
| (SDSS) | (M⊙ yr−1) | (M⊙ yr−1) | (M⊙ yr−1) | (M⊙ yr−1) |
| (1) | (2) | (3) | (4) | (5) |
| 0336_469_51999 | 0.46 | 1.20 | <0.59 | ... |
| 0379_579_51789 | 0.78 | 1.70 | <0.77 | <0.35 |
| 0413_238_51929 | 0.54 | 0.93 | <0.23 | 0.17 ± 0.03 |
| 0480_580_51989 | 21.15 | 2.40 | 1.89 ± 0.47 | ... |
| 0570_537_52266 | 0.71 | 2.51 | ... | <0.09 |
| 0598_170_52316 | 0.69 | 2.63 | 5.11 ± 0.48 | ... |
| 0623_207_52051 | 0.35 | 0.81 | <0.30 | <0.14 |
| 0637_584_52174 | 2.47 | 5.89 | 2.32 ± 0.64 | 1.77 ± 0.27 |
| 0656_404_52148 | 0.12 | 0.16 | 0.12 ± 0.03 | <0.08 |
| 0755_042_52235 | 1.29 | 2.88 | <0.82 | ... |
| 0756_424_52577 | 1.90 | 2.51 | ... | 1.71 ± 0.19 |
| 0815_586_52374 | 0.74 | 1.23 | 1.04 ± 0.19 | 0.56 ± 0.10 |
| 0870_208_52325 | 1.36 | 2.69 | <3.27 | ... |
| 0951_128_52398 | 0.08 | 0.71 | ... | <0.03 |
| 0962_212_52620 | 1.87 | 1.78 | 0.29 ± 0.07 | 0.67 ± 0.02 |
| 0986_468_52443 | 1.06 | 1.41 | 1.04 ± 0.13 | ... |
| 1001_048_52670 | 0.36 | 1.29 | 2.15 ± 0.23 | ... |
| 1003_087_52641 | 1.28 | 3.98 | ... | ... |
| 1039_042_52707 | 0.29 | 0.85 | 0.87 ± 0.12 | <0.04 |
| 1170_189_52756 | 1.04 | 0.76 | 1.02 ± 0.24 | <0.07 |
| 1279_362_52736 | 0.96 | 1.15 | 0.34 ± 0.11 | 0.30 ± 0.03 |
| 1352_610_52819 | 0.68 | 1.29 | 0.56 ± 0.12 | ... |
| 1604_161_53078 | 0.72 | 1.66 | <0.60 | ... |
| 1616_071_53169 | 0.16 | 0.17 | 0.61 ± 0.16 | <0.62 |
| 1853_070_53566 | 0.27 | 1.05 | ... | ... |
| 1927_584_53321 | 0.13 | 0.23 | <0.06 | 0.13 ± 0.01 |
| 2001_473_53493 | 16.83 | 4.47 | <1.61 | ... |
| 2276_444_53712 | 9.76 | 6.03 | 2.51 ± 0.34 | ... |
| 2360_167_53728 | 4.56 | 2.82 | 1.29 ± 0.37 | ... |
| 2365_624_53739 | 7.39 | 13.18 | 9.85 ± 1.60 | ... |
| 2376_454_53770 | 10.98 | 7.94 | 13.38 ± 1.68 | ... |
| 2750_018_54242 | 2.39 | 6.31 | <3.05 | ... |
| 2777_258_54554 | 10.11 | 2.24 | ... | ... |
Note. Column (1): galaxy ID. Column (2): TIR-based SFR from the Murphy et al. (2011) calibration. Column (3): WISE 12 μm based SFR from Cluver et al. (2017, in preparation). Column (4): [C ii]-based SFR from the de Looze et al. (2011) calibration. Column (5): neon-based SFR from the Ho & Keto (2007) calibration.
Download table as: ASCIITypeset image
4.10.1. SFR Calculations
We adopt the TIR SFR calibration of Murphy et al. (2011),

adopting a factor of LTIR/LIR = 1.06 to convert from 3–1100 μm TIR to 8–1000 μm IR luminosity.
Additionally, we adopt the neon-based calibration of Ho & Keto (2007), which estimates the SFR from MIR forbidden transitions of ionized neon ([Ne ii] at 12.8 μm and [Ne iii] at 15.6 μm). The calibration is

where ![${L}_{[\mathrm{Ne}{\rm{II}}]+[\mathrm{Ne}{\rm{III}}]}$](https://content.cld.iop.org/journals/0004-637X/855/1/51/revision1/apjaaafcdieqn20.gif) is the sum of integrated [Ne ii] and [Ne iii] line luminosities and f+ and f+2 are the fractions of singly and doubly ionized neon, respectively.
is the sum of integrated [Ne ii] and [Ne iii] line luminosities and f+ and f+2 are the fractions of singly and doubly ionized neon, respectively.
Using the CLOUDY photoionization code (Ferland et al. 2013), we simulated model H ii regions21 using realistic temperatures and densities and adopted ionization fractions typical for neon—f+ = 0.17–0.53 and f+2 = 0.47–0.83. It should be noted that the range of ionization fractions is small, and thus, due to their linear contribution to the Ho & Keto (2007) calibration, they are not a dominant source of uncertainty in the SFRs.
Integrated line fluxes are obtained from PAHFIT, which we find can overestimate the significance of the [Ne ii] line at low luminosities, due to the line's proximity to the broad 12.7 μm PAH emission feature. Therefore, for most sources we predicate "detections" of the [Ne ii] and [Ne iii] sum on the detection of [Ne iii] at ≥5σ, followed by eye inspection of the spectra. In two cases (0637 and 0756) [Ne iii] is not detected, but [Ne ii] is detectable by eye (also with high S/N), resulting in an S/N >5 for the sum. The neon SFR calibration was determined to be self-consistent with the TIR calibration (when using identical IMFs) in the star-forming SINGS sample.
Lastly, we adopt the [C ii]-based SFR calibration of de Looze et al. (2011):

Upper limits are assessed at the 3σ level.
4.10.2. SFR Considerations and Limitations
Recent work by Hayward et al. (2014) has shown that PSBs can remain dust obscured, with UV emission from the post-burst population leading to a boost in infrared emission unrelated to star formation for up to 1.5 Gyr after the burst. Their work suggests that TIR may overestimate the SFR of PSBs by up to two orders of magnitude, in some cases. Additionally, the adopted Murphy et al. (2011) relation was calibrated on galaxies with steady star formation. Thus, if the E+A galaxies are, truly, post-burst, all SFR estimates will be expected to be upper limits. Indeed, in sources where neon is detected, SFR(TIR) is typically twice as high as the corresponding SFR([Ne ii]+[Ne iii]) and ranges from 1.1 to 3.2× higher.
Additionally, Smith et al. (2017) suggest that in dense stellar environments (such as stellar bulges) the energy density of UV–optical emission is high enough to heat dust grains without a significant contribution from the FUV (e.g., star formation). These systems display [C ii] deficits that do not reflect their star formation, due to a decoupling of infrared emission and gas heating. Most of the E+A galaxies have steep surface brightness profiles (e.g., Yang et al. 2008; Abramson et al. 2013), indicative of dense central stellar environments, and most display [C ii] deficits similar to or even deeper than those found in the densest central bulges of the KINGFISH sample. Together these could indicate that SFRs derived from TIR and [C ii] emission are generally overestimates. In Section 5, we discuss this in greater detail.
PAH emission, as an oft-used star formation indicator, was excluded on the basis of the E+A galaxies' potentially unusual radiation field. Indeed, [Ne ii]-to-total PAH emission ([Ne ii]/PAH) is 10× lower, on average, than the SINGS sample. Additionally, individual PAH feature-based calibrations, such as those of Hernán-Caballero et al. (2009), yield SFRs that are >10× higher, on average, than those based on TIR. We do, however, include SFRs based on WISE 12 μm (Cluver et al. 2017), which were calibrated using TIR. These are still an average of 3× higher than the neon SFRs. Thus, in these sources, PAH-based SFRs are completely unreliable—consistent with the findings of Li & Draine (2002).
Though only a subset of the 15 Spitzer sources are detected in [Ne ii] and [Ne iii], it is perhaps the most robust of the three calibrations. However, caution is still advised. Most of the sample can be classified as LINERs via their optical emission line ratios. This was confirmed in Section 4.9 using the [Ne ii] and [O iv] lines. Given the weakness of even the detected lines, it is feasible that in these sources some of the nebular emission could be attributable to a low-level nuclear source or to extended LINER (LIER) emission from evolved stars, as seen in many quiescent galaxies (Yan et al. 2006; Belfiore et al. 2016; Herpich et al. 2016).
Additionally, classical shocks have been shown to efficiently produce nebular line emission, including [Ne ii] and [Ne iii]. Though no classical shock indicators are seen in the optical emission lines, shock diagnostics are worth investigating owing to the observed turbulent ISM as traced by H2 rotational emission. We do find that the observed [C ii] emission is inconsistent with production in fast shocks as are seen in other turbulent systems like SQ. To further limit the impact of shocks on ISM diagnostics such as nebular line emission, we compare the E+A galaxies' observed MIR nebular line ratios to the models of Allen et al. (2008). The [Ne ii], [Ne iii], and [S iii] lines are amply produced in fast shocks and display distinct evolution of their emission ratios with shock velocity; low-velocity shocks produce these lines only weakly. We compute observed line ratios for the E+A galaxies and compare to the predicted ratios to examine any potential significant contribution from such low-velocity shocks. From Allen et al. (2008), the predicted ratios for a 100 km s−1 or 200 km s−1 shock are as follows: [Ne ii]/[Ne iii] = 2, [Ne ii]/[S iii] = 2.3, and [Ne ii]/[Ne iii] = 1.9, [Ne ii]/[S iii] = 2, respectively. At velocities >200 km s−1 [Ne iii] and [S iii] dominate over [Ne ii]. We can place limits on shocks for seven galaxies—requiring at least one detected line and a limit on at least one of the other two lines. In four out of seven of the galaxies, we can stringently limit shock velocities to ≤200 km s−1, while in the remaining three we can limit shocks even further, to <100 km s−1. At these low velocities, shock production of [Ne ii] and [Ne iii] is entirely negligible compared to production by the ionizing radiation field (see Allen et al. 2008) and thus is not a dominant source of uncertainty in the derived SFRs. These velocity limits are in stark contrast to strongly shock-dominated systems, such as SQ (where the driving shock velocity is ∼1000 km s−1), and are in good agreement with our [C ii] and H2 observations.
SFRs for the sample were also computed by FYZ15, using the Hα luminosities from the MPA-JHU emission-line analysis of the SDSS DR7 (Aihara et al. 2011; see Table 1 for fiber Hα fluxes). Of the seven sources with reliable neon-based SFRs, neon agrees with the aperture-corrected Hα SFRs of FYZ15 to within a factor of 2, on average. One source, 0962, shows a ∼10× higher SFR in neon, compared to Hα, though still modest at <1 M⊙ yr−1. This is the same source that possesses significant dust attenuation, as discussed in Sections 4.5.1 and 4.9.
4.10.3. Efficiency of Star Formation in E+A Galaxies—Comparing to Star Formation Laws
Galaxies' star-forming properties are often placed in the context of empirical star formation laws. The star-forming main sequence is an empirical power-law relation between a star-forming disk galaxy's SFR and stellar mass. Quiescent galaxies deviate from this relation, with ETGs possessing far lower SFRs for their mass than a corresponding spiral galaxy. The Kennicutt–Schmidt (KS) law (Kennicutt 1998) is an empirical power-law relationship that exists between SFR and gas density in galaxies, expressed in terms of the SFR and either molecular or total gas (H i + H2) surface densities (ΣSFR, ΣGas). The relation is shown to hold (with relatively low scatter) across 6–7 orders of magnitude, indicating that gas density is a fundamental parameter in setting a galaxy's SFR—likely a natural balance between feedback and gravitational collapse (Hopkins et al. 2013). See the review by Kennicutt & Evans (2012) for a more detailed discussion of observational results.
In Figure 18, we show SFRs for the E+A sample (using infrared tracers, as well as Hα) plotted as a function of stellar mass, and we compare to the empirical relationship for star-forming galaxies (GAMA G12; Jarrett et al. 2017). The E+A galaxies lie overwhelmingly below the relation for all tracers, with tracers such as [Ne ii] + [Ne iii] and Hα showing the deepest suppression. In the vast majority of sources (all but the deepest outliers in Figure 5) dust attenuation is very typical, and thus the extinction-corrected Hα SFRs should be quite accurate—as suggested by their consistency with neon-derived SFRs (where detected).
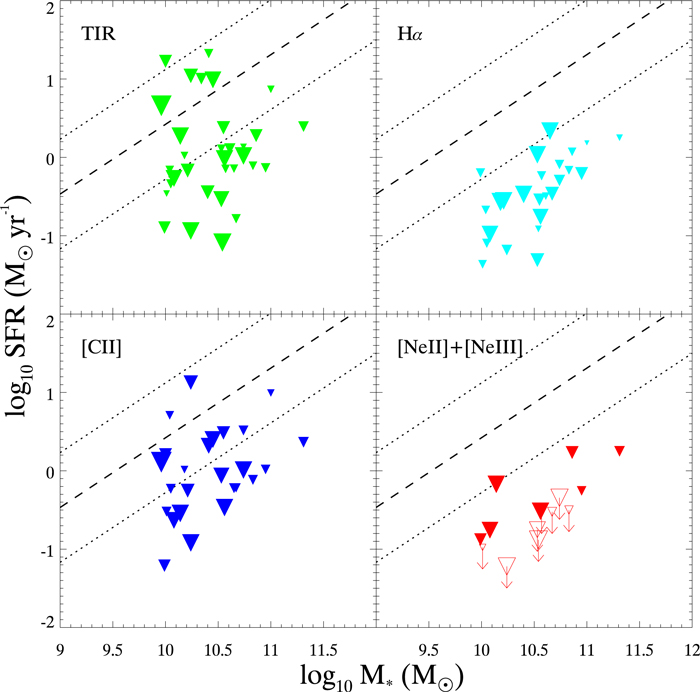
Figure 18. SFR rate vs. stellar mass. For the E+A sample, we plot each of our derived SFRs in a separate panel: TIR (top left; green), [C ii] (bottom left; blue), and neon (bottom right; red). We also include Hα (FYZ15, top right; cyan). Symbol size is scaled linearly with post-burst age (oldest have largest symbols). SFR limits are denoted by downward-pointing arrows. The dashed and dotted lines show the WISE best-fit and full range, respectively, to late-type galaxies in the GAMA G12 field (Jarrett et al. 2017)—the star-forming main sequence. Hα SFRs have been excluded for the seven sources with high inferred extinction. Though there is considerable scatter among different tracers, the E+A galaxies overwhelmingly lie below the star-forming main sequence.
Download figure:
Standard image High-resolution imageThe KS relation, alternatively, traces how efficiently a galaxy is forming stars given its existing molecular reservoirs—independent of the galaxy's mass. Most ETGs that are considered "quiescent" from their position compared to the star-forming main sequence do, in fact, closely follow the KS relation (Davis et al. 2014). One of the limitations of the KS relation, however, is the implicit choice of a CO-to-H2 conversion factor (e.g., αCO; Section 4.6). We have little information about the αCO factor in the E+A galaxies and thus adopt separate conversion factors when considering different comparison samples.
FYZ15 found significant offsets from the KS relation, using optical size estimates and SFR indicators. We reexamine these offsets in Figure 19, with our infrared size estimates and additional SFR tracers. We plot the E+A sample against the original Kennicutt (1998) sample, comparing to the star-forming (center) and ULIRG (right) sample separately. We follow our assumption from Section 4.3 that the spatial distribution of any ongoing star formation will likely be well traced by the 8 μm emission. This should also trace the molecular gas well, given the consistency of our DMGRs with typical DGRs (see Section 4.2). Therefore, we adopt the 8 μm FWHM sizes for computation of ΣSFR and ΣMol. Though we argue that PAH (8 μm) emission is a poor star formation indicator in E+A galaxies, the adopted 8 μm sizes provide a stringent upper limit on the extent of star formation.

Figure 19. KS star formation diagram. SFR surface density is plotted as a function of CO surface brightness (left) and molecular gas surface density (middle, right). Galaxies with CO limits have been excluded, as have ΣSFR(Hα) for the seven sources with significant inferred extinction. The one exception is 0815, which, though it is not detected in CO (1–0), does have a reliable molecular mass from fitting of its H2 temperature distribution (Section 4.6). The comparison sample is derived from the original sample of Kennicutt (1998), composed of star-forming galaxies (black filled circles) with αco = 4.35, star-forming galaxy nuclei (black open circles) with 1 ≤ αCO ≤ 3.6, and ULIRGs (black filled squares) with αCO = 0.8. The E+A galaxies are plotted assuming αCO factors of none (left), 4.35 (middle), and 0.8 (right). Power-law fits to the comparison samples are shown in each panel as dashed lines: star-forming galaxies (blue) and ULIRGs (red). Lines with 10× lower normalization than each fit (but identical slopes) are shown as dotted lines, again with blue corresponding to star-forming galaxies and red to ULIRGs. Assuming αco = 4.35, the E+A galaxies are offset from star-forming galaxies by a factor of 5 when considering neon SFRs. Assuming αco = 0.8, the E+A galaxies are offset from ULIRGs by a factor of 10 when considering neon.
Download figure:
Standard image High-resolution imageCompared to star-forming galaxies (using an appropriate αCO = 4.35), the E+A galaxies possess gas densities that are higher than 90% of the star-forming comparison sample—rivaled only by some of the gas-rich, star-forming nuclei. They also display a modest 3–5× offset below the KS relation when considering the neon SFRs, and often >5× when considering Hα (as found in FYZ15)—comparable to and exceeding the offsets observed in gas-rich ETGs (Davis et al. 2014). The gas densities are very typical of ULIRGs (using an appropriate αCO = 0.8), however, in line with the lower 30% of the comparison sample. The offset in ΣSFR from ULIRGs is more severe, reaching >10× in some cases. SFRs based on TIR display only a more modest offset, with two sources even lying above the relation (both Herschel sources with scaled 8 μm sizes). However, as discussed in Section 4.10.2, TIR likely provides only an upper limit in many cases and may overestimate the SFR substantially. The subset of sources with detected neon all display a ∼10× offset in ΣSFR compared to the ULIRGs. This is corroborated by equivalent offsets in Hα, most of which occur in sources unaffected by dust attenuation.
In the small subset of 22 μm selected sources with high inferred dust attenuation (0480, 0962, 2001, 2276, 2360, 2376, 2777), Hα-based SFRs likely suffer from significant optical depth effects, even after correcting for extinction using τV derived from the stellar population fitting (e.g., Balmer decrement). In Figures 18 and 19 we therefore exclude SFR and ΣSFR based on Hα for these seven sources. We find that, in these cases alone, differences between TIR and Hα-based SFRs are extreme—with SFR(TIR)/SFR(Hα) ranging from 25 to 275. These seven sources appear to form the spur of sources in FYZ15 that possess the most significant offsets from the KS law—up to a factor of 100 in one case. Although it is now clear that such extreme offsets in Hα-inferred star formation efficiency are the result of the impact of dust obscuration, the single Spitzer source among these seven, 0962, still possesses a 5–10× offset in ΣSFR using the dust-insensitive MIR neon line (for star formation and ULIRG comparisons, respectively). This measure is 3× lower than SFR based on TIR, though it is still ∼10× higher than that of Hα. We discuss the interpretation of this small subset of galaxies in Section 5.
5. Discussion
PSB galaxies are traditionally viewed as gas- and dust-poor—having had the bulk of their ISM expelled by the event that nearly truncates their star formation on short timescales. In direct contrast to canonical timescale arguments for quenching via AGN-driven outflows, E+A galaxies have been found to host significant molecular reservoirs (FYZ15; Rowlands et al. 2015). Here, we have revealed that these reservoirs are warm, are dusty, and likely dominate the gas content—forming an ISM with unusual emission properties and energetics. Below, we discuss the implications these characteristics have for the evolutionary origin and ultimate fate of post-burst systems.
5.1. Examining the Post-starburst Classification
A comparison of the Hα, NUV, and TIR luminosities of the E+A sample reveals a dust-attenuation sequence that spans three orders of magnitude (see Figure 5). A nearly identical sequence is observed in star-forming galaxies, extending down to ULIRGs such as Arp 220, with the vast majority of E+A galaxies displaying obscuration typical of normal star-forming galaxies (AV ≲ 3; SDD07). One of the Spitzer/IRS sources (0962; Section 4.5.1) displays significant silicate absorption (τ9.7 μm = 1.7), and several of the WISE/22 μm selected Herschel-only sources appear to be nearly as dust obscured as Arp 220 (from the attenuation curve)—highlighting a potential "skin effect" regarding their classification. It should be noted that the E+A galaxies that were selected with the stringent WISE 22 μm flux cut are, on average, dustier and more embedded. The potential for "skin effect" stellar populations is apparently small in a purely optically selected E+A sample. Regardless of level of obscuration, the E+A galaxies display a >5× systematic deficiency of Hα emission (relative to TIR), compared to all other comparison galaxies—consistent with their selection and young but aging stellar populations. For the deeply embedded E+A galaxies, there are two explanations for this deficiency:
- 1.A unique geometry is present, where significant ongoing star formation is completely dust obscured behind a PSB "skin," which contributes the bulk of NUV and Hα emission. Though star-forming regions can be preferentially deeply embedded, it is difficult to reconcile the complete segregation of the clear post-burst "skin" stellar population from an obscured starbursting population.
- 2.The "skin" is representative of, or related to, the rest of the stellar population, and thus the galaxies are truly Hα (and thus star formation) deficient—even though the bulk of the stars remain dust obscured. In support of this, these galaxies have TIR-based SFRs that are typically 5–10× lower than their modeled peak burst SFRs.
Due to the constancy of the Hα–NUV attenuation law across a wide variety of galaxy morphologies and evolutionary states, it seems unlikely that dust geometry can account for the observed deficiency. Though Arp 220 possesses one of the highest known global extinction values, with both its dual nuclei and many of its star-forming regions heavily embedded (Smith et al. 1989; Scoville et al. 1991; Sturm et al. 1996), it does not deviate from the observed relation by more than a factor of two. Indeed, despite high general obscuration, UV-bright clusters are readily seen in the visible skin of most ULIRGs (Goldader et al. 2002).
Furthermore, Wild et al. (2011) find that in galaxies with very high silicate-inferred extinction (AV > 50), Balmer decrement-derived extinction measurements do, indeed, trace silicate-based measurements, suggesting that the visible stellar populations contain information about the embedded populations. Thus, it seems most likely that the E+A "skin" is also representative of the embedded stellar population, in the few cases with evidence for substantial dust attenuation. Some of these infrared-bright sources may, indeed, harbor obscured regions of ongoing star formation. However, their TIR-based SFRs (which are likely overestimates; see Section 4.10.2) indicate that they have still experienced dramatic decreases in SFR since their starburst peaks. Moreover, in the obscured IRS source 0962, the measured neon-based SFR, which can readily penetrate columns of AV ∼ 100 or greater, is nearly 200× lower than the peak modeled burst SFR. The burst mass fraction and burst age recovered from stellar SED modeling in the sample would not change if a portion of the stellar population with similar properties is obscured by dust in the optical/UV, but the inferred peak burst SFR would increase if accounting for this hidden population, further highlighting the strongly truncated star formation history of these systems.
5.2. Origin of the Spectral Properties
The majority of sources are compact at 8 μm (1/3 are unresolved), with over half possessing FWHM sizes <3 kpc—on average, 5–6× more compact than in the optical. This suggests that the dust and molecular gas reservoirs are very centrally concentrated, as is found in starbursting (U)LIRGs, supporting a connection between E+A galaxies and progenitor starbursts. Further evidence of this connection is found in their IRS spectra. Strong PAH emission is ubiquitous across the sample, with a geometric mean PAH/TIR of 13.0%—significantly higher than the SINGS geometric mean of 8.7% (SDD07) and considerably higher than the GOALS or dusty ETG samples. However, high-ionization lines are astonishingly weak. [Ne ii] 12.8 μm, one of the brightest infrared fine-structure lines in star-forming galaxies, is weaker in every source, relative to both PAH and TIR emission, than the SINGS mean, with some deficient by factors of >5. The E+A galaxies are substantially different than the dusty ETG population, most of which have been "revived" by a minor, gas-rich merger. That the nebular line deficiency persists into the MIR confirms that these sources are indeed only weakly star-forming, supporting their optical classification.
Though remarkably devoid of nebular lines, the E+A galaxies nevertheless display near-ubiquitous bright rotational H2 emission. They are strong outliers in H2/TIR compared to both SINGS and GOALS sources, rivaled only by turbulent, shock-powered systems similar to SQ (Cluver et al. 2010; Appleton et al. 2017). Indeed, 8 of the 15 E+A galaxies lie above the MOHEG H2/7.7 μm limit of 0.04 (Ogle et al. 2010; Cluver et al. 2013)—also indicating that the H2 excitation is shock driven. Stierwalt et al. (2014) found that most galaxies in the GOALS sample that satisfied the MOHEG H2/PAH criterion were experiencing, or had recently experienced, the most major mergers. Power-law fits of the H2 rotational excitation diagrams reveal that much of the H2 is warm, with H2 temperature power-law slopes that are, on average, shallower than those of star-forming galaxies and similar to those of ULIRGs and shock-powered systems such as SQ (Appleton et al. 2017).
The [C ii] cooling-line deficit ([C ii]/TIR) in the E+A sample varies by two orders of magnitude, with 85% of sources deeper than the KINGFISH average of 0.48% (Smith et al. 2017). Smith et al. (2017) found that the [C ii] deficit in galaxies is overwhelmingly driven by a single parameter: the SFR density (ΣSFR). The underlying mechanism is thought to be grain charging—increases in FUV intensity result in a higher grain ionization potential, decreasing photoelectric heating efficiency in the gas. Using the relation between [C ii]/TIR and ΣSFR, given by Smith et al. (2017), we find that the ΣSFR predicted from the equation is, on average, 100× higher than the ΣSFR calculated directly from TIR (which are shown in Figure 19). Smith et al. (2017) posited that severe discrepancies such as these often arise in environments with very high stellar density, which possess high surface brightness but lower per-photon energy than in star-forming regions (e.g., softer radiation field). In such a "high-soft" environment, the photoelectric coupling between the dust and gas is effectively broken. The poor correlation between ΣSFR and [C ii]/TIR here is strong evidence in support of E+A galaxies possessing an aging PSB stellar population (soft) that is compact and centrally concentrated (high surface brightness). A high stellar density region dominated by A stars (as is assumed in E+A galaxies) could quite effectively produce such a high-soft radiation field. This could also help to explain the observed warm dust peaks—at ∼70–75 μm they are significantly warmer than the ∼100 μm peaks found in star-forming galaxies. Additionally, the PAH mass fraction, qPAH, is likely affected by a high-soft radiation field. Draine et al. (2014) found that qPAH was 2× lower in the bulge of M31 when adopting a typical ISRF, rather than the true, old-starlight-dominated radiation field of M31's bulge. Given the aging post-burst populations in the E+A galaxies, the qPAH values quoted in this paper are, thus, likely only lower limits.
5.3. Insight into the Evolutionary Path
A strong negative trend is visible between fractional PAH luminosity (PAH/TIR) and modeled post-burst age. PAH grains are small and more easily destroyed. Thus, a suppression of PAH/TIR is consistent with the accumulating effects of small-grain destruction as these sources age. Indeed, in quiescent ellipticals, PAH emission vanishes almost entirely (e.g., Bressan et al. 2006). We also find a strong negative trend in dust mass (normalized to both total stellar mass and stellar mass created in the burst) with age, also likely indicative of the effects of dust destruction. This trend continues for several dusty ETGs in the SINGS sample that possess well-measured dust masses. In the models of Zhukovska et al. (2016), grain growth in the cold ISM reaches a steady state with grain destruction ≳140 Myr following a burst of star formation. As star formation seems to have all but ceased, both PAH/TIR and the dust-to-burst mass ratio should remain roughly constant in sources older than ∼100 Myr. What, then, is causing the continued dust destruction implied by the declining PAH/TIR and dust-to-burst mass ratios? We suggest that this is evidence for an incipient transition to early-type, hot-gas-dominated ISM.
Indeed, of galaxies with modeled burst ages greater than 900 Myr, the majority display distinctly early-type morphologies (see FYZ15). Additionally, PAH/TIR in these oldest systems is very comparable to the dusty ETG comparison sample—most have PAH/TIR < 10%. Though these dusty ETGs have likely been revived by a minor merger (and host confirmed star formation), their diminished PAH/TIR compared to normal star-forming galaxies suggests that they indeed possess ISM conditions that are harsher to small-grain survival. These results provide a window into the potential future evolution of the E+A systems and appear to support the classical view of E+A galaxies as the progenitors of gas- and dust-depleted pure elliptical galaxies. In these situations the gas must be driven by an ongoing (if sporadic) source of turbulent energy, after the initial disrupting event, in order to maintain suppression of star formation. The mechanism responsible for the gas's continued turbulence is unknown, but we discuss potential mechanisms below.
Despite the unique conditions present in the E+A galaxies and the attendant limitations of traditional SFR indicators, we find that, although the E+A galaxies' ISMs are dense—comparable to ULIRGs (which are molecular gas dominated; Iono et al. 2005), when averaged over a typical ∼2 kpc scale—and centrally concentrated, they display a significant offset from both the star-forming main sequence and the KS star formation relation. Both are indicative of low star-forming efficiencies, the former on a galaxy-wide scale and the latter on a local ISM scale. Traditional models of the star formation quenching process (typically some combination of AGNs and stellar feedback) require the expulsion of galaxies' dust and gas on short timescales. Even if the gas does not escape the galaxy entirely, its distribution should be significantly altered. In contrast to this picture, most of the E+A galaxies in this sample possess dust and molecular gas masses substantially higher than can be explained by stellar recycling. Thus, in most cases, the observed dusty ISM must be preexisting, rather than regrown. Since we have no reliable method of estimating the gas or dust masses prior to or during the burst, it is very possible that a significant fraction of the ISM was removed. Indeed, the molecular-gas-to-stellar-mass ratios (with the stellar mass created in the burst subtracted—typically from 5% to 25%) are significantly suppressed compared to (U)LIRGs in the GOALS sample (Larson et al. 2016)—often by a factor of >5. While molecular gas could have been converted into the atomic phase, the consistency of the DMGRs with nearby galaxies' full DGRs suggests that these are molecular gas dominated. Thus, their low molecular-to-stellar mass ratios support the scenario that much of the ISM was removed in outflows, similar to currently active PSBs such as those in Yesuf et al. (2017). However, these results indicate that even in the most violent quenching events, a significant fraction of the ISM must remain behind, consistent with recent observations of both younger (Alatalo et al. 2016a) and high-redshift (Suess et al. 2017) PSBs.
The rapid decline of star formation (≳100×) since the peak indicates the operation of a strong quenching mechanism sometime in the recent past, while current high molecular gas densities combined with low SFRs indicate that the gas must be continually turbulently supported against collapse—supported by the properties of H2 emission. Assuming that the ISM is relatively smoothly distributed—a good assumption given the near lack of star formation—and with no additional energy input, turbulent energy should be dissipated on timescales much shorter than their post-burst ages (Scoville et al. 2017). By what mechanism, then, is the large-scale turbulence maintained? Though we cannot answer this definitively, we consider the following mechanisms:
- 1.In the case of Arp 220, Scoville et al. (2017) find that turbulence in the dual nuclear molecular gas disks is maintained simply by the continual time variation of the gravitational potential in the merging system. Such merger-induced gravitational torques were also posited as a mechanism for the star formation suppression observed in some HCGs (Alatalo et al. 2015a). In E+A galaxies, if a merger was responsible for quenching of the starburst, significant evolution of the potential likely persists on timescales of order the dynamical time (hundreds of Myr)—similar to many of the post-burst ages. Thus, it seems plausible that after star formation is essentially halted, time variation of the potential may, in many cases, provide the required mechanical energy necessary to maintain the observed turbulent signatures.
- 2.An alternative (or perhaps complimentary) mechanism is that of radio-mode AGN feedback. Terrazas et al. (2016, 2017) suggest that low-level AGN feedback is critical for maintaining star-forming quiescence in already quiescent galaxies—a phenomenon seen in NGC 1266 (Alatalo et al. 2015b). Indeed, in three of the eight sources with existing 1.4 GHz radio continuum measurements, we find evidence for radio excess. Thus, periodic animation of the central SMBH, resulting in kinetic feedback, may be a plausible method for shocking the gas and suppressing star formation and may not necessarily provide clear evidence of its presence in emission diagnostics.
HST imaging obtained for four of the eight confirmed MOHEG sources reveals bright, highly asymmetric tidal substructure in all cases, indicating that these sources have, indeed, all undergone recent major mergers/interactions. Though the greatest changes to the potential in a merger occur during final coalescence, significant fluctuations of the potential likely persist for hundreds of Myr afterward (Bois et al. 2010). If these fluctuations are still present in these E+A galaxies, it may indicate that, as in the case of Arp 220, time variation of the potential can account for much of the observed turbulence. Additionally, work by Lanz et al. (2016) has shown that radio jets appear to drive the H2 emission in many early-type, radio-emitting MOHEGs, leading to star formation suppression characterized by an offset from the KS relation. Many of these galaxies do not display clear AGN indicators in the optical or MIR, typical of purely radio AGNs and similar to our E+A galaxies. Only one of the three galaxies in the sample with confirmed radio excess was observed with Spitzer, and that source is, indeed, a MOHEG. This may also indicate that, in some E+A galaxies, low-duty-cycle radio-mode feedback is a plausible source of continued energy injection.
6. Conclusions
We have presented an analysis of the infrared properties of a sample of 33 E+A PSBs, combining infrared photometry (spanning 3–500 μm) with full Spitzer IRS spectroscopy and Herschel PACS [C ii] and [O i] cooling-line observations. A wide range of physical conditions in the ISM of these E+A galaxies are revealed for the first time, providing a direct probe of their formation mechanism and subsequent evolution. We find the following:
- 1.Significant dust reservoirs (as high as 5 × 10⁸ M⊙), which, when combined with CO-based H2 masses (assuming αCO = 4, as in FYZ15), provide reasonable dust-to-molecular gas ratios of 0.0025 ≤ DMGR ≤ 0.04—consistent with the dust-to-total gas ratios of nearby galaxies, suggesting that the sample may be molecular gas dominated.
- 2.Warm dust, with an average SED peak wavelength of 70–75 μm. The modest UV budget but high central stellar surface brightness suggests that the dust may be heated by an unusual high-intensity, softer ("high-soft") radiation field created by the A-star-dominated population.
- 3.High PAH abundances. Half of the E+A sample possesses qPAH > 4.6%—the highest value for nearby, star-forming galaxies in the SINGS sample. Additionally, if E+A galaxies are dominated by a high-soft radiation field,
 is likely higher still.
 - 4.Unusually strong PAH emission—the mean PAH/TIR is 13.0%, compared to SINGS's 8.7%—but overall weak nebular lines. Where detected, total line emission ([Ne ii] + [Ne iii] + [S iv] + [S iii] 18 μm) is 3× lower than in star-forming galaxies, relative to PAH emission, but most sources are not detected in any nebular lines, indicating that strong PAH emission can persist hundreds of Myr after the bulk of star formation has stopped in galaxies, and cautioning against the use of PAHs as direct star formation tracers.
- 5.A small number of WISE 22 μm selected sources appear to be deeply dust embedded, when considering attenuation curves for Hα versus NUV emission. In these sources, even extinction-corrected Hα likely provides a significant underestimate of the SFR and could lead to extremely discrepant apparent star-forming efficiencies. However, these few obscured sources still display a steep decline in SFR from their past peaks, and current obscuration-tolerant SFRs are generally very modest, thus preserving their PSB classification.
- 6.Compact infrared cores, <1/3 of the optical extent. Physical sizes can approach ULIRG dimensions—8 μm FWHM <1.5 kpc. Their compactness at 8 μm suggests compact star-forming progenitors, with gas densities higher than 90% of normal star-forming galaxies and very comparable to (U)LIRGs.
- 7.Strong H2 pure rotational emission. 75% of sources observed with Spitzer display H2 emission considerably higher than seen in star-forming galaxies, with >50% classifiable as MOHEGs (H2/7.7 μm ≥ 0.04). These galaxies have among the highest fractional H2 luminosities (compared to TIR) of any globally integrated galaxy—comparable to shock-dominated regions such as in SQ. The slopes of their H2 power-law temperature distributions are shallower than found in SINGS and similar to ULIRGs and other turbulent systems. These all suggest that the H2 emission is powered by turbulent heating, though it appears to be a purely low-velocity phenomenon (as opposed to SQ). This is also supported by the dominance of the [O i] 63 μm cooling line over [C ii] 158 μm, in several sources—predicted in molecular cloud shock models.
- 8.Significant [C ii] deficits in most sources, with 85% of sources falling below the KINGFISH mean of 0.48%. These deficits are, however, inconsistent with being star formation driven and, instead, seem to confirm the action of a predominantly "high-soft" radiation field.
- 9.Dust and molecular gas-to-stellar mass ratios that are typically much higher than can be explained by stellar recycling from the aging burst population. This indicates that the dust and gas reservoirs were not entirely expelled during burst truncation.
- 10.Negative trends of PAH/TIR and dust-to-stellar mass ratio as a function of post-burst age, consistent with observations of dusty ETGs, indicating the effect of accumulating grain destruction and an incipient transition to virialized early-type gas conditions.
- 11.Little evidence for significant AGN activity beyond potential low-level activity associated with their existing LINER classifications. The high-ionization emission line [O iv] is only detected in one source (weakly), and PAH band ratios show no evidence of small-grain depletion. One galaxy (2360_167_53728) displays extreme AGN colors in the near-IR WISE bands, with evidence for a very hot dust component to its SED. The presumed AGN is likely deeply embedded. Three sources appear to display an excess at 1.4 GHz, relative to the radio–infrared correlation, potentially indicating the presence of radio AGN activity. One source, in particular, is clearly a radio galaxy—the same source that is detected in [O iv].
- 12.Low star formation rates and efficiencies. Offsets from the star-forming main sequence are typically >10 and reach factors of >100 in some cases, for a variety of tracers, characterizing these galaxies as truly quiescent. Offsets from the KS relation exist for most sources and range from ∼3 to >10 for reliable tracers, depending on the comparison sample considered.

These results paint a compelling picture: one of galaxies whose star formation was, indeed, rapidly truncated, and which are transitioning away from compact starbursting systems, but in which the gas and dust have not been completely expelled and instead are supported against further star formation by turbulent or mechanical heating. The resulting dense, modestly aged burst stellar populations appear to provide a "high-soft" radiation field, which dominates the unusual ISM energetics of galaxies seen after the fall from a prior star-forming peak.
We thank the anonymous referee for helpful comments that substantially improved this paper.
A.S. acknowledges support for this work by the National Science Foundation Graduate Research Fellowship Program under grant No. DGE 1256260. Any opinions, findings, and conclusions or recommendations expressed in this material are those of the author(s) and do not necessarily reflect the views of the National Science Foundation.
J.D.T.S. acknowledges direct support for this project from the Research Corporation for Science Advancement through its Cottrell Scholars program, as well as visiting support from the Alexander von Humboldt Foundation.
K.D.F. is supported by Hubble Fellowship grant HST-HF2-51391.001-A, provided by NASA through a grant from the Space Telescope Science Institute, which is operated by the Association of Universities for Research in Astronomy, Incorporated, under NASA contract NAS5-26555.
A.I.Z. acknowledges support from NASA ADAP grant 09-ADP09-0073.
This work is based in part on observations made with Herschel, a European Space Agency Cornerstone Mission with significant participation by NASA. Support for this work was provided by NASA through an award issued by JPL/Caltech. This work made use of the NASA/IPAC Extragalactic Database (NED), operated by JPL/Caltech, under contract with NASA.
We thank Vanja Šarković for her work on the stellar recycling models used throughout this work, Tim Carleton for his assistance with IRS data reduction, and Eric Pellegrini, Tim Heckman, Katey Alatalo, Roberto Rampazzo, and Phil Appleton for useful discussions that improved this paper. We also thank Ned Wright, Peter Eisenhardt, Sara Petty, and the WISE extragalactic working group for pre-release access to WISE photometry for our Herschel selection.
Appendix A: Photometric Tables and SDSS Spectra
In Tables 5–7 we present the photometry for the sample from the Spitzer, Herschel, and WISE space observatories, respectively. Spitzer photometric data only exist for the original sample of 15 sources, while Herschel and WISE data are shown for the full sample of 33.
Table 5. Spitzer Photometric Data
| IRAC | MIPS | |||||||||
|---|---|---|---|---|---|---|---|---|---|---|
| fν(3.6 μm) | fν(4.5 μm) | fν(5.8 μm) | fν(8.0 μm) | FWHM8 μm | fν(24 μm) | fν(70 μm) | fν(160 μm) | |||
| Galaxy | (mJy) | (mJy) | (mJy) | (mJy) | (arcsec) | fSL | (mJy) | (mJy) | (mJy) | fLL |
| (1) | (2) | (3) | (4) | (5) | (6) | (7) | (8) | (9) | (10) | (11) |
| 0379_579_51789 | 6.52 ± 0.90 | 4.28 ± 0.59 | 2.83 ± 0.39 | 3.03 ± 0.39 | 3.80 | 0.57 | 3.38 ± 0.27 | <26.20 | <26.20 | 0.40 |
| 0413_238_51929 | 4.52 ± 0.62 | 3.15 ± 0.44 | 3.86 ± 0.54 | 7.23 ± 0.95 | 2.62 | 0.66 | 21.62 ± 0.89 | 79.17 ± 6.51 | 72.12 ± 12.23 | 0.55 |
| 0570_537_52266 | 3.22 ± 0.45 | 2.14 ± 0.30 | 1.91 ± 0.27 | 3.63 ± 0.48 | 3.07 | 0.63 | 8.61 ± 0.40 | 15.37 ± 2.47 | <15.37 | 0.56 |
| 0623_207_52051 | 1.97 ± 0.27 | 1.36 ± 0.19 | 1.58 ± 0.22 | 2.78 ± 0.36 | 7.01 | 0.40 | 2.16 ± 0.22 | <20.74 | <20.74 | 0.45 |
| 0637_584_52174 | 4.80 ± 0.66 | 3.28 ± 0.46 | 2.46 ± 0.34 | 3.81 ± 0.50 | 3.48 | 0.56 | 2.83 ± 0.22 | 22.50 ± 2.94 | 20.66 ± 7.09 | 0.47 |
| 0656_404_52148 | 11.46 ± 1.58 | 7.35 ± 1.02 | 6.00 ± 0.82 | 4.60 ± 0.60 | 3.11 | 0.50 | 3.73 ± 0.21 | 31.15 ± 3.68 | 11.91 ± 6.93 | 0.56 |
| 0756_424_52577 | 2.86 ± 0.40 | 1.96 ± 0.28 | 1.88 ± 0.27 | 3.52 ± 0.47 | 2.76 | 0.64 | 4.69 ± 0.22 | 73.39 ± 5.43 | 56.67 ± 7.72 | 0.54 |
| 0815_586_52374 | 7.21 ± 0.99 | 4.68 ± 0.65 | 4.01 ± 0.55 | 4.44 ± 0.58 | 3.77 | 0.53 | 2.64 ± 0.28 | 21.70 ± 3.67 | 29.12 ± 7.87 | 0.36 |
| 0951_128_52398 | 8.16 ± 1.12 | 5.16 ± 0.71 | 4.00 ± 0.55 | 2.46 ± 0.32 | 3.60 | 0.50 | 1.16 ± 0.32 | <29.44 | <29.44 | 0.41 |
| 0962_212_52620 | 4.45 ± 0.62 | 3.75 ± 0.53 | 7.86 ± 1.09 | 18.36 ± 2.42 | 2.65 | 0.70 | 44.31 ± 1.82 | 655.53 ± 46.33 | 288.95 ± 36.63 | 0.47 |
| 1039_042_52707 | 6.66 ± 0.92 | 4.33 ± 0.60 | 3.58 ± 0.50 | 2.68 ± 0.35 | 3.15 | 0.59 | 3.05 ± 0.23 | 24.17 ± 3.31 | <24.17 | 0.46 |
| 1170_189_52756 | 10.99 ± 1.50 | 7.38 ± 1.02 | 6.30 ± 0.85 | 5.33 ± 0.69 | 2.78 | 0.52 | 6.66 ± 0.43 | 103.61 ± 8.47 | 52.89 ± 11.07 | 0.42 |
| 1279_362_52736 | 9.71 ± 1.34 | 6.24 ± 0.87 | 6.32 ± 0.87 | 8.35 ± 1.08 | 3.61 | 0.53 | 6.99 ± 0.38 | 133.61 ± 9.77 | 138.11 ± 19.35 | 0.48 |
| 1616_071_53169 | 7.36 ± 1.01 | 4.38 ± 0.60 | 3.38 ± 0.46 | 2.83 ± 0.37 | 4.28 | 0.35 | 0.87 ± 0.15 | <29.98 | <29.98 | 0.40 |
| 1927_584_53321 | 10.92 ± 1.51 | 6.92 ± 0.97 | 6.26 ± 0.87 | 6.72 ± 0.88 | 3.56 | 0.54 | 7.22 ± 0.37 | 46.51 ± 4.38 | 28.30 ± 7.95 | 0.41 |
Note. Column (1): galaxy ID. Columns (2)–(5): Spitzer IRAC flux densities. Column (6): IRAC 8 μm FWHM. Computed as the geometric mean of the major and minor axes of 2D elliptical Gaussian. Column (7): ratio of synthetic IRAC 8 μm, computed from the IRS spectrum, to global 8 μm; used for spectral scaling of SL. Columns (8)–(10): Spitzer MIPS flux densities. Column (11): synthetic-to-global ratio for MIPS 24 μm; used for spectral scaling of LL.
Download table as: ASCIITypeset image
Table 6. Herschel Photometry
| PACS | SPIRE | |||||||
|---|---|---|---|---|---|---|---|---|
| fν(70 μm) | fν(100 μm) | fν(160 μm) | Iν([C ii] 158 μm) | Iν([O i] 63 μm) | fν(250 μm) | fν(350 μm) | fν(500 μm) | |
| Galaxy | (mJy) | (mJy) | (mJy) | (10−9 W m−2 sr−1) | (10−9 W m−2 sr−1) | (mJy) | (mJy) | (mJy) |
| 0336_469_51999 | 21.41 ± 3.46 | 36.84 ± 3.93 | 36.84 ± 4.25 | <3.34 | ... | ... | ... | ... |
| 0379_579_51789 | 36.62 ± 6.56 | 58.26 ± 7.35 | 58.26 ± 7.81 | <3.47 | ... | ... | ... | ... |
| 0413_238_51929 | 124.88 ± 7.71 | 161.52 ± 7.50 | 161.52 ± 9.60 | <5.67 | <71.56 | ... | ... | ... |
| 0480_580_51989 | 1115.67 ± 56.25 | 1368.93 ± 50.50 | 1368.93 ± 68.95 | 6.86 ± 1.69 | <35.06 | 418.64 ± 32.03 | 182.59 ± 15.87 | 52.22 ± 9.26 |
| 0570_537_52266 | 26.10 ± 4.07 | 33.06 ± 4.71 | 33.06 ± 4.74 | <5.31 | 81.59 ± 14.97 | 22.65 ± 6.31 | <16.34 | <15.69 |
| 0598_170_52316 | 16.81 ± 2.70 | 18.67 ± 2.69 | 18.67 ± 3.12 | 17.67 ± 1.66 | ... | ... | ... | ... |
| 0623_207_52051 | 17.09 ± 5.03 | 66.23 ± 7.15 | 66.23 ± 6.64 | <3.45 | ... | ... | ... | ... |
| 0637_584_52174 | 40.85 ± 4.70 | 62.64 ± 5.93 | 62.64 ± 5.84 | 4.37 ± 1.20 | ... | ... | ... | ... |
| 0656_404_52148 | 43.94 ± 6.21 | 62.11 ± 6.25 | 62.11 ± 7.39 | 4.17 ± 1.18 | ... | ... | ... | ... |
| 0755_042_52235 | 74.80 ± 5.37 | 80.83 ± 6.71 | 80.83 ± 6.00 | <5.64 | <47.27 | 27.62 ± 6.66 | <16.53 | <15.87 |
| 0756_424_52577 | 63.32 ± 4.45 | 100.79 ± 6.27 | 100.79 ± 6.22 | <5.18 | ... | ... | ... | ... |
| 0815_586_52374 | 27.71 ± 5.96 | 59.10 ± 7.47 | 59.10 ± 7.28 | 6.48 ± 1.18 | ... | ... | ... | ... |
| 0870_208_52325 | 7.93 ± 2.23 | 18.27 ± 2.37 | 18.27 ± 2.68 | <3.23 | ... | ... | ... | ... |
| 0951_128_52398 | 9.98 ± 7.11 | 14.67 ± 7.34 | 14.67 ± 3.55 | <3.60 | ... | ... | ... | ... |
| 0962_212_52620 | 614.32 ± 30.98 | 666.23 ± 24.54 | 666.23 ± 33.63 | 7.45 ± 1.87 | <81.59 | 173.82 ± 14.80 | 61.38 ± 7.52 | 12.70 ± 5.77 |
| 0986_468_52443 | 231.27 ± 12.21 | 273.28 ± 9.16 | 273.28 ± 14.40 | 19.57 ± 2.38 | 88.49 ± 25.91 | 79.73 ± 9.72 | <17.22 | <16.53 |
| 1001_048_52670 | 29.70 ± 3.28 | 38.25 ± 3.69 | 38.25 ± 3.89 | 17.25 ± 1.85 | ... | ... | ... | ... |
| 1003_087_52641 | 60.69 ± 3.93 | 60.72 ± 3.23 | 60.72 ± 4.18 | <5.15 | <34.38 | 22.61 ± 4.61 | <10.68 | <10.25 |
| 1039_042_52707 | 31.44 ± 4.58 | 40.59 ± 4.52 | 40.59 ± 5.38 | 8.04 ± 1.13 | ... | ... | ... | ... |
| 1170_189_52756 | 114.85 ± 9.50 | 142.61 ± 9.40 | 142.61 ± 11.26 | 8.79 ± 2.09 | <47.81 | ... | ... | ... |
| 1279_362_52736 | 197.52 ± 11.42 | 298.26 ± 15.92 | 298.26 ± 16.30 | 6.25 ± 1.94 | 155.03 ± 23.60 | 128.22 ± 12.98 | 43.96 ± 7.71 | 10.65 ± 6.68 |
| 1352_610_52819 | 112.25 ± 7.69 | 120.71 ± 8.70 | 120.71 ± 8.55 | 8.93 ± 1.94 | <64.09 | 49.03 ± 9.19 | 17.65 ± 6.73 | <21.74 |
| 1604_161_53078 | 41.65 ± 4.01 | 55.24 ± 5.04 | 55.24 ± 4.82 | <5.53 | <51.02 | 33.85 ± 6.04 | 12.11 ± 4.35 | <14.23 |
| 1616_071_53169 | 15.94 ± 7.21 | 23.84 ± 7.48 | 23.84 ± 8.35 | 4.86 ± 1.27 | ... | ... | ... | ... |
| 1853_070_53566 | 40.50 ± 3.79 | 50.79 ± 3.89 | 50.79 ± 4.49 | <3.47 | ... | ... | ... | ... |
| 1927_584_53321 | 88.27 ± 6.15 | 93.20 ± 6.25 | 93.20 ± 6.78 | <3.42 | ... | ... | ... | ... |
| 2001_473_53493 | 772.05 ± 38.94 | 748.79 ± 24.25 | 748.79 ± 37.90 | <4.89 | <32.60 | 159.44 ± 14.69 | 62.14 ± 8.32 | 19.19 ± 7.11 |
| 2276_444_53712 | 715.96 ± 36.22 | 952.06 ± 40.64 | 952.06 ± 48.03 | 14.79 ± 2.03 | <39.42 | 306.62 ± 24.14 | 114.22 ± 11.41 | 29.06 ± 8.18 |
| 2360_167_53728 | 347.54 ± 17.66 | 277.00 ± 7.34 | 277.00 ± 14.30 | 5.81 ± 1.67 | <35.37 | 30.84 ± 5.48 | <13.46 | <12.92 |
| 2365_624_53739 | 77.00 ± 5.87 | 86.48 ± 7.53 | 86.48 ± 6.67 | 9.77 ± 1.59 | ... | ... | ... | ... |
| 2376_454_53770 | 150.73 ± 8.42 | 197.59 ± 9.58 | 197.59 ± 10.80 | 15.49 ± 1.95 | <25.09 | 81.23 ± 9.95 | 31.37 ± 6.71 | <15.53 |
| 2750_018_54242 | 49.26 ± 3.56 | 32.43 ± 3.01 | 32.43 ± 3.42 | <5.74 | ... | 10.58 ± 4.26 | <11.29 | <10.84 |
| 2777_258_54554 | 975.49 ± 49.44 | 1098.12 ± 40.04 | 1098.12 ± 55.69 | <5.33 | <46.63 | 296.02 ± 24.80 | 120.44 ± 13.14 | 34.43 ± 9.70 |
Note. Herschel photometry and [C ii] spectroscopy for the full sample. Upper limits are prefaced with "<," and "..." denotes a source unobserved with SPIRE.
Download table as: ASCIITypeset image
Table 7. WISE Photometry
| fν(3.4 μm) | fν(4.6 μm) | fν(12 μm) | fν(22 μm) | |
|---|---|---|---|---|
| Galaxy | (mJy) | (mJy) | (mJy) | (mJy) |
| 0336_469_51999 | 1.00 ± 0.02 | 0.54 ± 0.03 | 1.22 ± 0.16 | <4.00 |
| 0379_579_51789 | 6.53 ± 0.08 | 3.38 ± 0.06 | 1.25 ± 0.10 | <2.45 |
| 0413_238_51929 | 4.53 ± 0.05 | 2.80 ± 0.04 | 6.74 ± 0.17 | 14.50 ± 0.84 |
| 0480_580_51989 | 1.41 ± 0.02 | 0.88 ± 0.02 | 2.34 ± 0.16 | 7.72 ± 0.80 |
| 0570_537_52266 | 3.14 ± 0.04 | 1.81 ± 0.03 | 2.30 ± 0.13 | 4.93 ± 0.66 |
| 0598_170_52316 | 0.90 ± 0.02 | 0.60 ± 0.02 | 1.42 ± 0.10 | 4.37 ± 0.52 |
| 0623_207_52051 | 1.90 ± 0.03 | 1.04 ± 0.03 | 1.65 ± 0.07 | <1.75 |
| 0637_584_52174 | 5.47 ± 0.07 | 3.11 ± 0.05 | 2.45 ± 0.13 | <3.20 |
| 0656_404_52148 | 12.05 ± 0.13 | 6.50 ± 0.08 | 2.62 ± 0.13 | <3.25 |
| 0755_042_52235 | 4.46 ± 0.05 | 3.23 ± 0.04 | 5.36 ± 0.17 | 9.43 ± 0.82 |
| 0756_424_52577 | 2.48 ± 0.03 | 1.48 ± 0.03 | 1.64 ± 0.10 | <2.55 |
| 0815_586_52374 | 8.21 ± 0.09 | 4.31 ± 0.06 | 3.02 ± 0.08 | 2.97 ± 0.53 |
| 0870_208_52325 | 1.48 ± 0.02 | 0.86 ± 0.02 | 0.80 ± 0.13 | <3.20 |
| 0951_128_52398 | 8.12 ± 0.09 | 4.46 ± 0.06 | 1.25 ± 0.08 | <2.35 |
| 0962_212_52620 | 4.17 ± 0.05 | 3.32 ± 0.05 | 13.02 ± 0.25 | 32.39 ± 1.64 |
| 0986_468_52443 | 6.29 ± 0.07 | 3.63 ± 0.05 | 8.34 ± 0.29 | 15.85 ± 1.33 |
| 1001_048_52670 | 4.00 ± 0.05 | 2.28 ± 0.04 | 1.37 ± 0.12 | <2.90 |
| 1003_087_52641 | 3.19 ± 0.04 | 2.00 ± 0.04 | 3.28 ± 0.15 | 5.16 ± 0.73 |
| 1039_042_52707 | 6.66 ± 0.07 | 3.92 ± 0.05 | 1.35 ± 0.08 | <2.15 |
| 1170_189_52756 | 11.65 ± 0.13 | 6.76 ± 0.08 | 3.12 ± 0.09 | 3.56 ± 0.42 |
| 1279_362_52736 | 9.79 ± 0.11 | 5.50 ± 0.07 | 6.54 ± 0.16 | 4.50 ± 0.76 |
| 1352_610_52819 | 3.92 ± 0.05 | 2.31 ± 0.04 | 5.80 ± 0.18 | 12.11 ± 0.88 |
| 1604_161_53078 | 9.32 ± 0.11 | 5.73 ± 0.08 | 4.66 ± 0.17 | 8.95 ± 0.78 |
| 1616_071_53169 | 7.15 ± 0.09 | 3.75 ± 0.07 | 0.83 ± 0.12 | ... |
| 1853_070_53566 | 6.45 ± 0.07 | 3.64 ± 0.05 | 2.28 ± 0.20 | 2.46 ± 0.41 |
| 1927_584_53321 | 11.09 ± 0.12 | 6.20 ± 0.08 | 4.04 ± 0.17 | <4.20 |
| 2001_473_53493 | 0.64 ± 0.01 | 0.42 ± 0.02 | 1.89 ± 0.12 | 12.61 ± 0.86 |
| 2276_444_53712 | 5.02 ± 0.06 | 3.25 ± 0.07 | 11.51 ± 0.43 | 18.67 ± 2.08 |
| 2360_167_53728 | 0.43 ± 0.01 | 1.50 ± 0.03 | 3.34 ± 0.17 | 13.53 ± 1.06 |
| 2365_624_53739 | 2.63 ± 0.04 | 1.72 ± 0.04 | 3.18 ± 0.14 | <3.50 |
| 2376_454_53770 | 1.63 ± 0.02 | 1.17 ± 0.03 | 2.94 ± 0.19 | 7.60 ± 0.92 |
| 2750_018_54242 | 1.08 ± 0.02 | 0.72 ± 0.02 | 2.23 ± 0.10 | 6.16 ± 0.61 |
| 2777_258_54554 | 1.53 ± 0.02 | 0.97 ± 0.03 | 3.91 ± 0.15 | 16.60 ± 1.12 |
Note. WISE photometry. 5σ upper limits are prefaced with "<." Nondetections are denoted by "...."
Download table as: ASCIITypeset image
The Spitzer photometry and Herschel spectrophotometry are divided by the respective instruments: IRAC and MIPS for Spitzer, PACS and SPIRE for Herschel. Targets were chosen for Herschel SPIRE coverage based on the 250 μm flux density of their Spitzer or WISE-extrapolated SEDs. In addition to the Spitzer photometry, we also provide the slit-loss corrections for the IRS spectra and the derived 8 μm FWHMs used for analysis.
In Figure 20 we show the SDSS spectrum for each object in the sample. Spectra were downloaded from the SDSS Data Release 12 (DR12) Science Archive Server (SAS; https://dr12.sdss.org).

Figure 20. SDSS spectra for the sample. Each galaxy's ID is shown in the upper left corner, with spectra sorted by plate ID.
Download figure:
Standard image High-resolution imageAppendix B: PAHFIT Decomposition Results
In Figure 21 we present the spectral decompositions of each galaxy's IRS spectrum, using PAHFIT (see SDD07; Section 4.5.1). In Tables 8, 9, and 10 we present the integrated PAH strengths, nebular emission line fluxes, and H2 pure rotational emission line fluxes derived from this decomposition. Note that only 15 of the 33 galaxies in the sample have IRS coverage and thus PAHFIT-derived results.

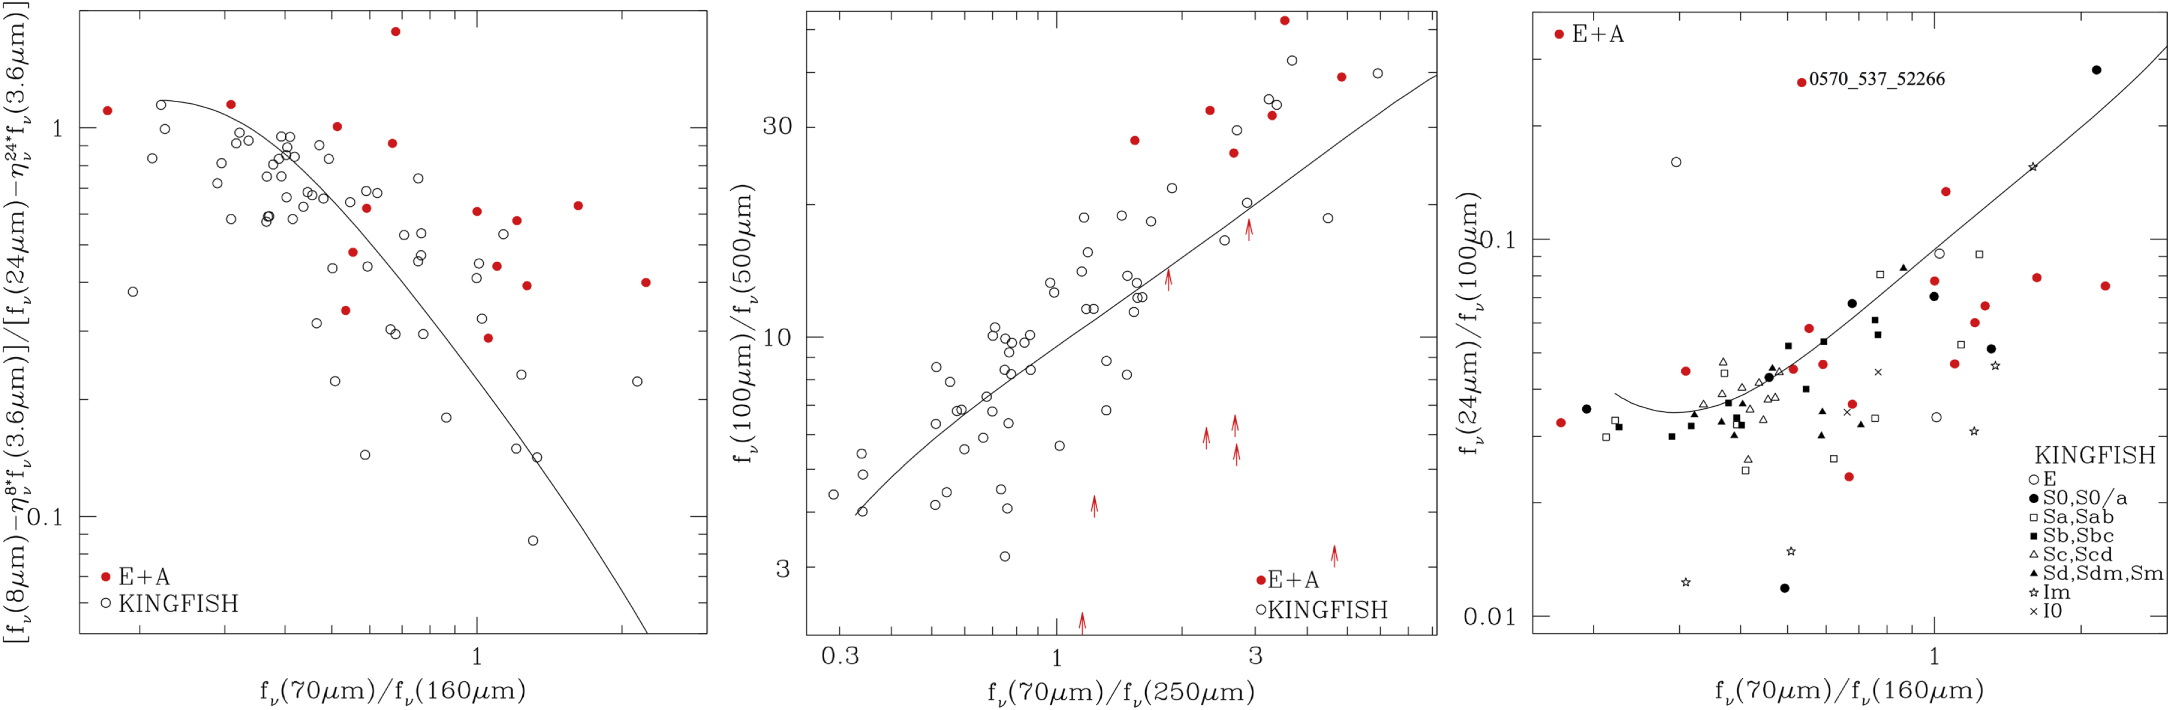
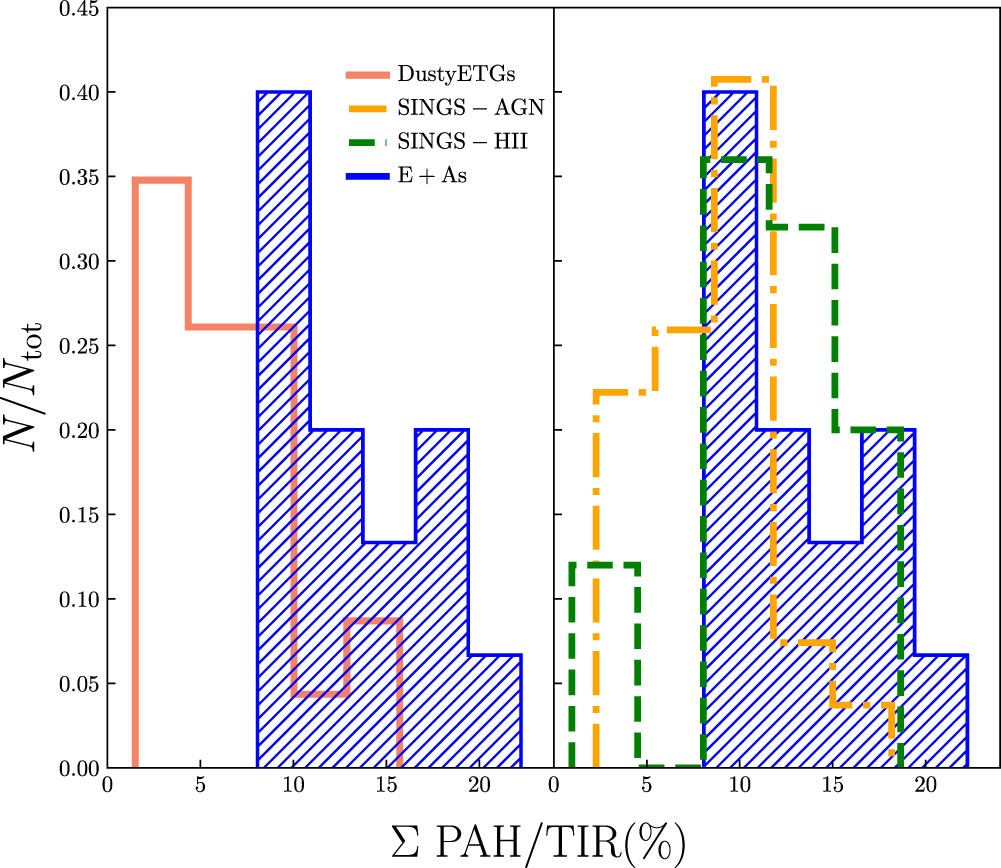
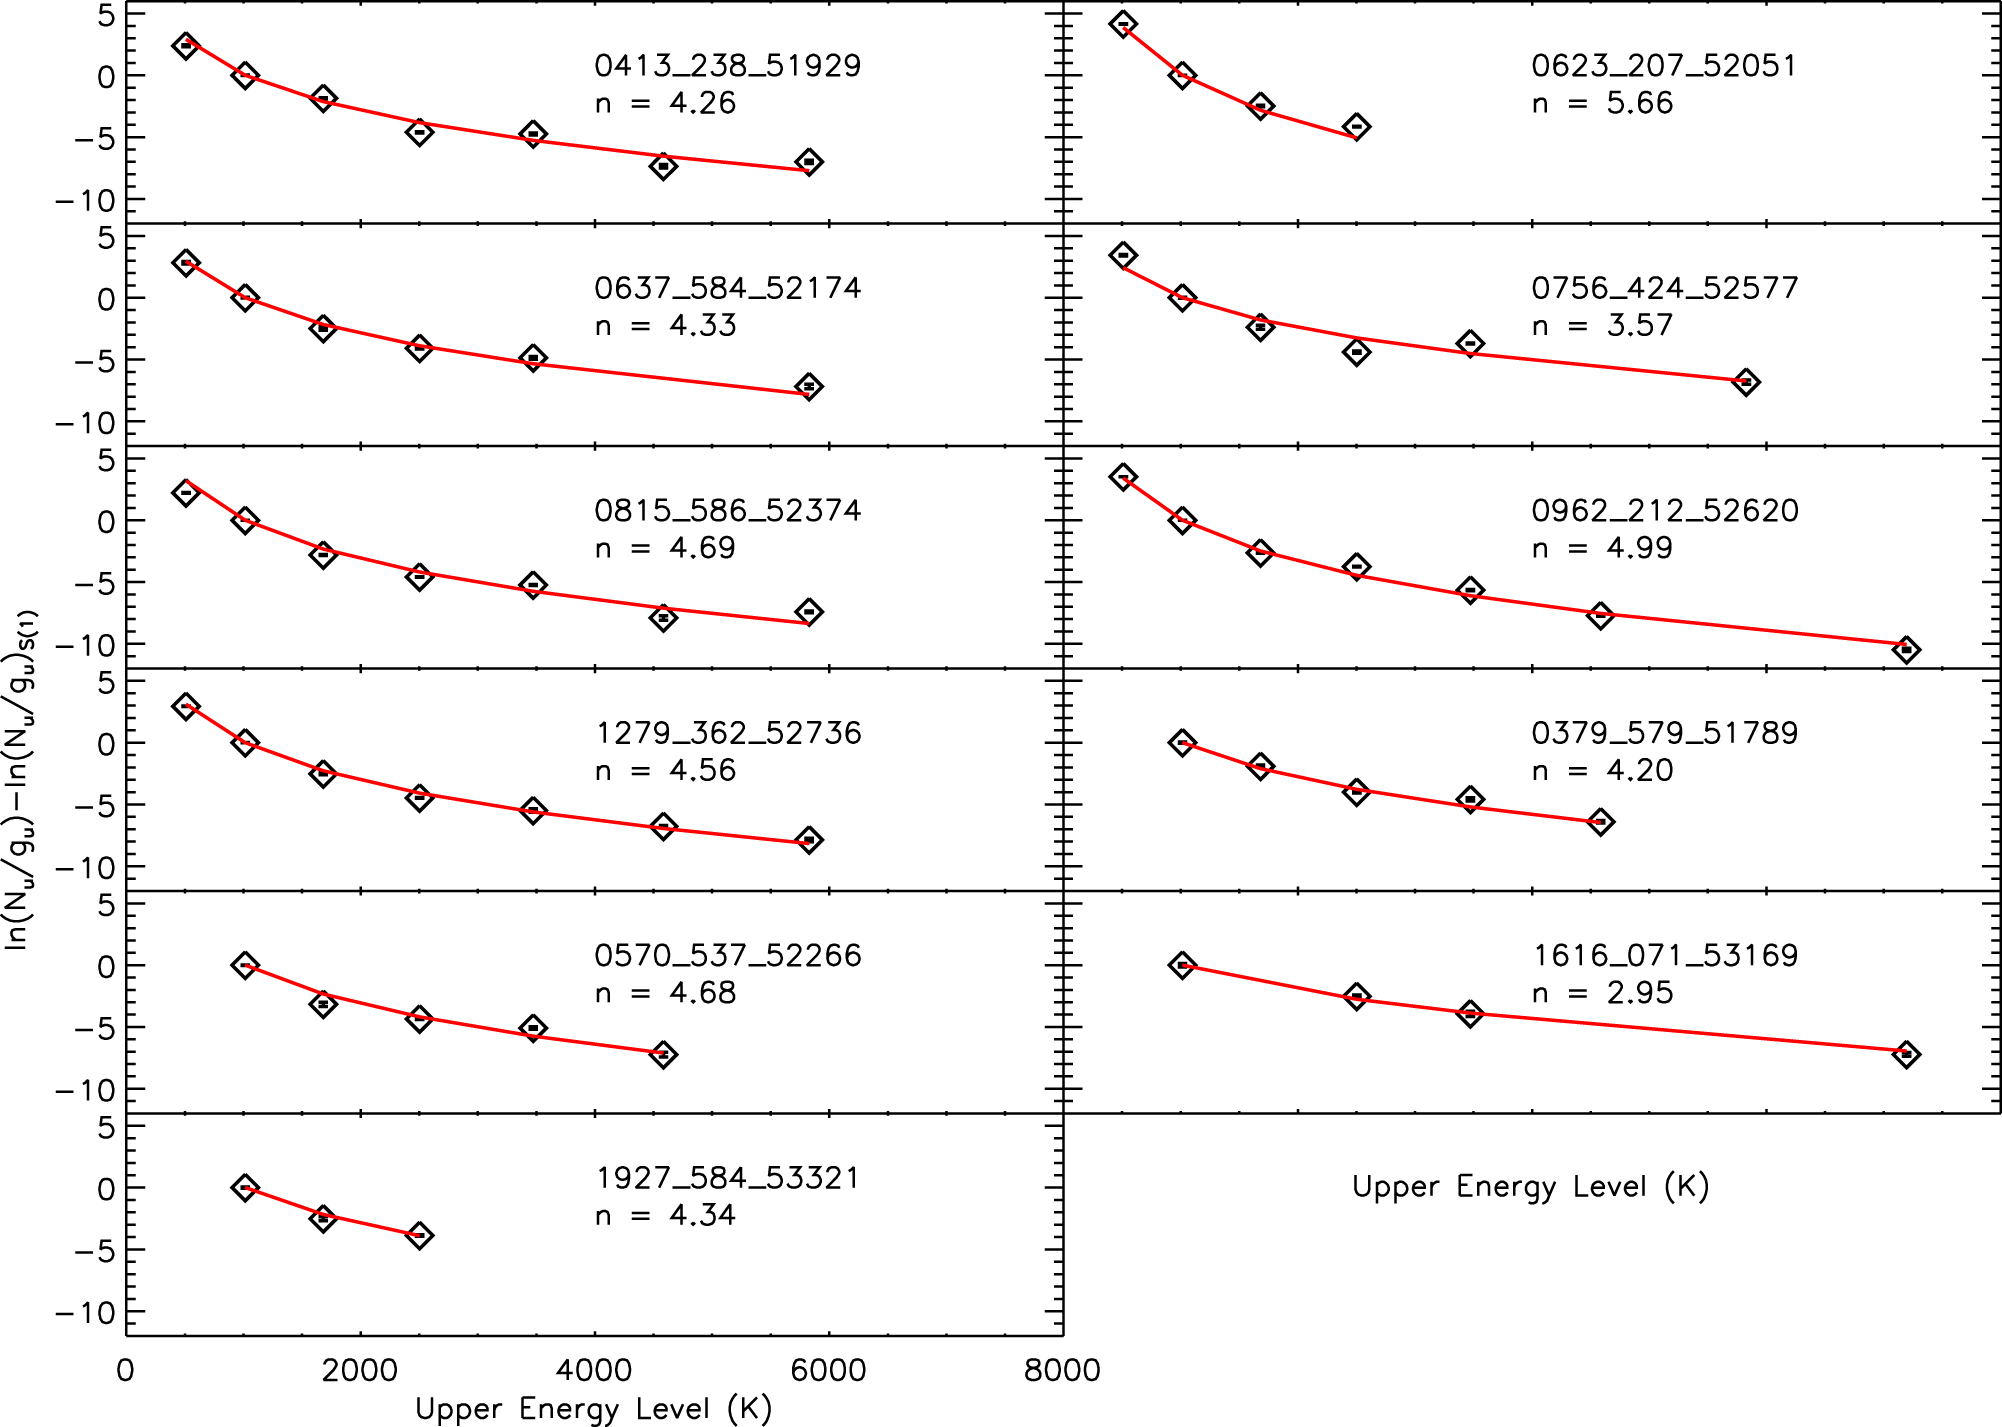
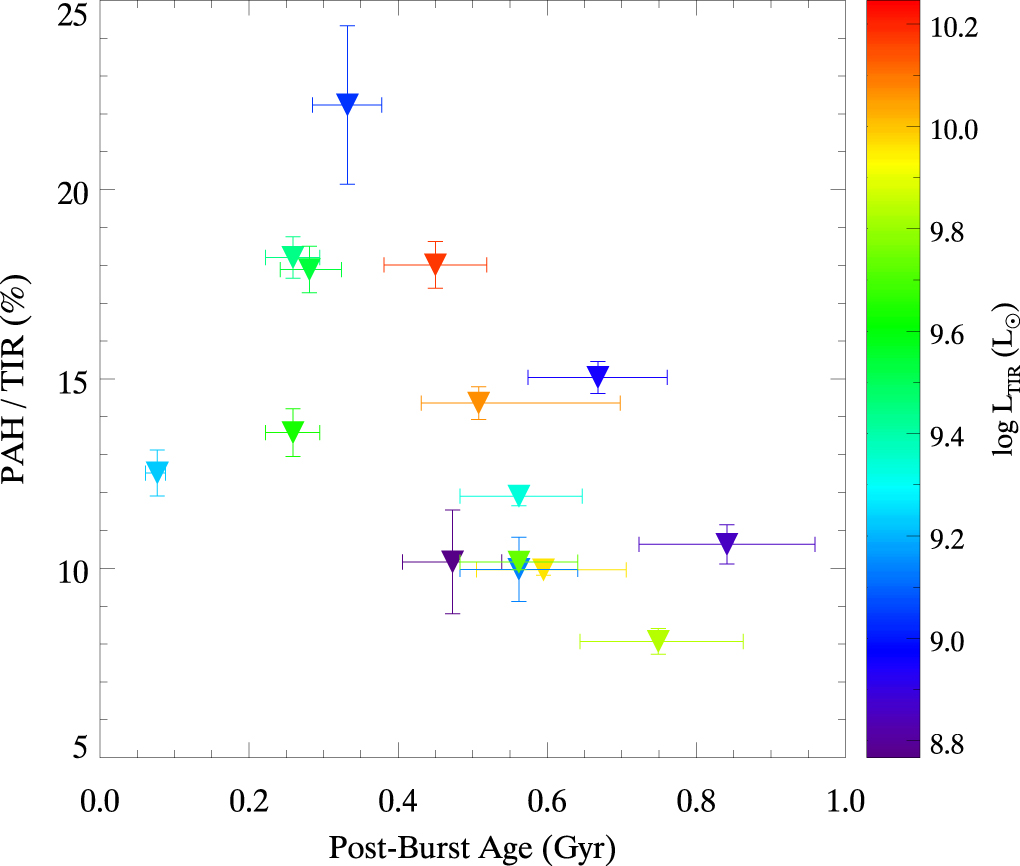
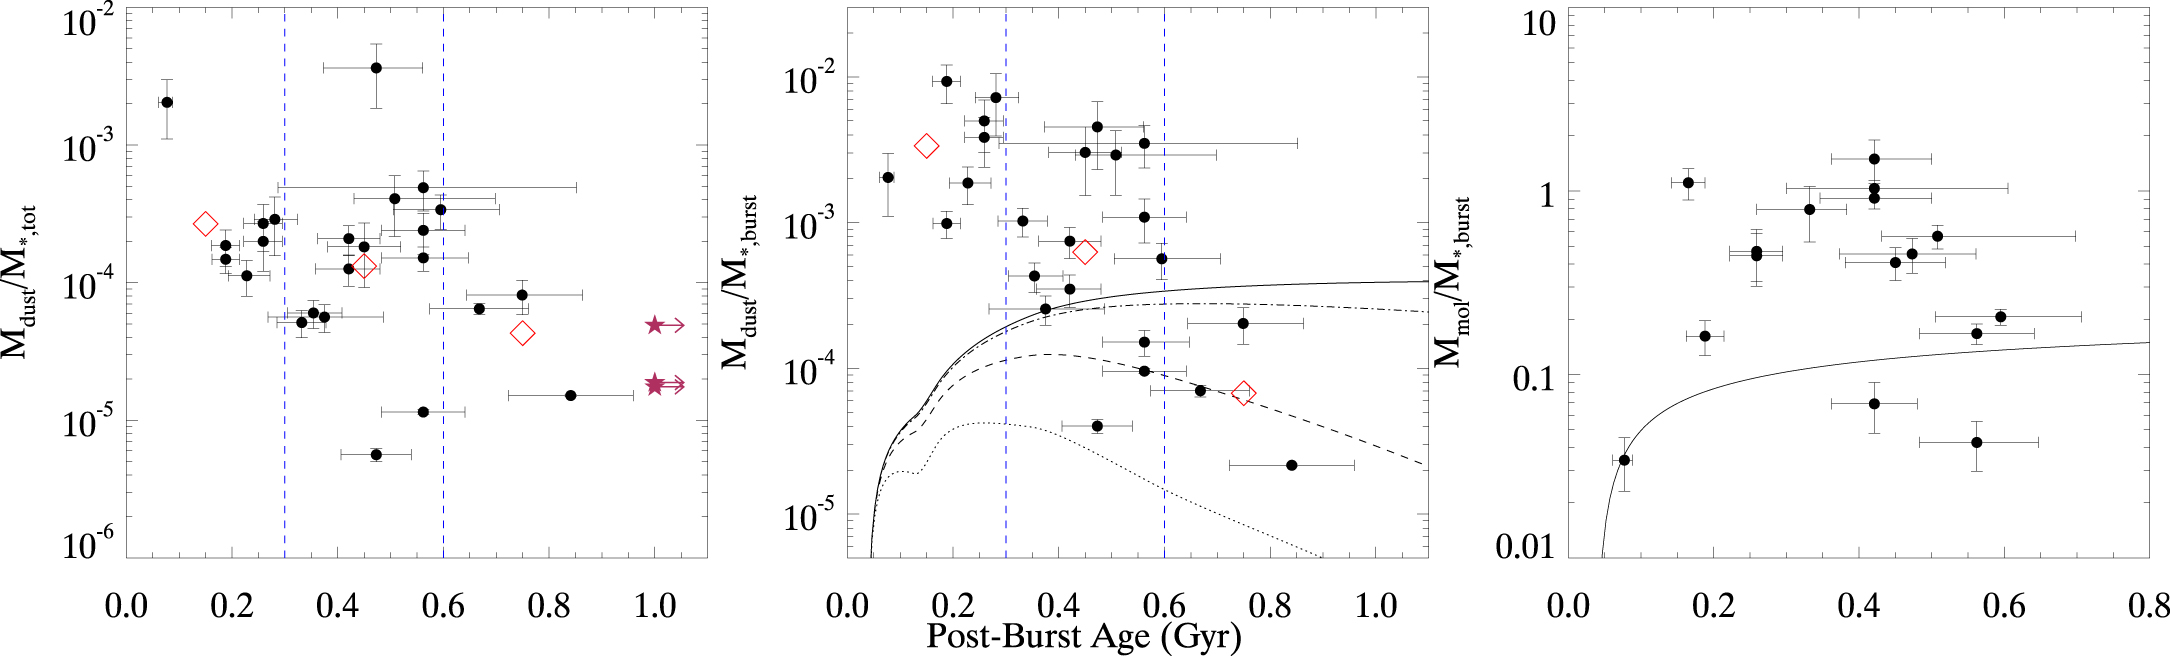
Figure 21. PAHFIT decompositions of the IRS spectra for each of the remaining Spitzer sources (minus 0962), ordered by plate number. The cyan curve represents the stellar continuum, the red curve the various dust continua, and the gray curve the total continuum. The blue curves indicate PAH emission features, while the magenta curves indicate atomic and molecular emission lines. The green curve shows the total fit. The silicate optical depth has been set to 0 for these sources, for the purpose of a more reliable fit. No silicate extinction can be seen by eye in the spectra, except for 0962_212_52620 (see Section 4.5.1).
Download figure:
Standard image High-resolution image
Table 8. PAH Feature Strengths
| Galaxy | 6.2um | 7.7 μm Complex | 8.6 μm | 11.3 μm Complex | 12.6 μm Complex | 17 μm Complex |

|
|---|---|---|---|---|---|---|---|
| (1) | (2) | (3) | (4) | (5) | (6) | (7) | (8) |
| 0379_579_51789 | 0.44 ± 0.03 | 1.45 ± 0.09 | 0.28 ± 0.02 | 0.59 ± 0.02 | 0.32 ± 0.02 | 0.29 ± 0.03 | 3.96 ± 0.17 |
| 0413_238_51929 | 1.18 ± 0.04 | 5.39 ± 0.15 | 0.79 ± 0.03 | 1.47 ± 0.02 | 0.92 ± 0.03 | 0.82 ± 0.03 | 13.32 ± 0.24 |
| 0570_537_52266 | 0.68 ± 0.03 | 2.43 ± 0.07 | 0.48 ± 0.02 | 0.98 ± 0.02 | 0.49 ± 0.02 | 0.35 ± 0.03 | 6.39 ± 0.15 |
| 0623_207_52051 | 0.43 ± 0.03 | 1.82 ± 0.09 | 0.39 ± 0.02 | 0.57 ± 0.01 | 0.21 ± 0.02 | 0.27 ± 0.01 | 4.19 ± 0.19 |
| 0637_584_52174 | 0.60 ± 0.04 | 2.47 ± 0.09 | 0.50 ± 0.03 | 1.21 ± 0.02 | 0.59 ± 0.03 | 0.43 ± 0.04 | 6.67 ± 0.20 |
| 0656_404_52148 | 0.45 ± 0.05 | 1.02 ± 0.04 | 0.12 ± 0.03 | 0.55 ± 0.02 | 0.27 ± 0.03 | 0.23 ± 0.04 | 3.56 ± 0.17 |
| 0756_424_52577 | 0.65 ± 0.03 | 2.41 ± 0.08 | 0.44 ± 0.03 | 1.18 ± 0.02 | 0.60 ± 0.02 | 0.55 ± 0.04 | 7.27 ± 0.18 |
| 0815_586_52374 | 0.66 ± 0.03 | 2.32 ± 0.10 | 0.43 ± 0.03 | 0.85 ± 0.02 | 0.32 ± 0.02 | 0.75 ± 0.02 | 6.61 ± 0.22 |
| 0951_128_52398 | <0.15 | 0.22 ± 0.04 | <0.06 | 0.17 ± 0.01 | 0.05 ± 0.02 | 0.10 ± 0.03 | 0.86 ± 0.12 |
| 0962_212_52620 | 4.44 ± 0.04 | 16.66 ± 0.21 | 4.33 ± 0.06 | 4.60 ± 0.04 | 1.79 ± 0.03 | 4.71 ± 0.07 | 40.04 ± 0.36 |
| 1039_042_52707 | 0.17 ± 0.03 | 0.43 ± 0.09 | 0.08 ± 0.02 | 0.42 ± 0.01 | 0.13 ± 0.02 | 0.18 ± 0.02 | 2.19 ± 0.18 |
| 1170_189_52756 | 0.60 ± 0.04 | 2.44 ± 0.15 | 0.37 ± 0.03 | 0.60 ± 0.02 | 0.31 ± 0.02 | 0.56 ± 0.03 | 5.85 ± 0.24 |
| 1279_362_52736 | 1.26 ± 0.04 | 5.32 ± 0.10 | 0.86 ± 0.02 | 2.56 ± 0.02 | 1.22 ± 0.02 | 1.26 ± 0.02 | 14.74 ± 0.21 |
| 1616_071_53169 | <0.21 | 0.57 ± 0.06 | 0.28 ± 0.05 | 0.48 ± 0.04 | 0.22 ± 0.04 | <0.06 | 2.39 ± 0.22 |
| 1927_584_53321 | 0.86 ± 0.04 | 3.58 ± 0.12 | 0.65 ± 0.03 | 1.42 ± 0.02 | 0.62 ± 0.02 | 0.92 ± 0.05 | 9.25 ± 0.24 |
Note. Column (1): galaxy ID. Columns (2)–(7): integrated fluxes of the primary PAH emission features returned by PAHFIT, in units of 10−16 W m−2. Column (8): total integrated PAH flux returned by PAHFIT, including minor emission features, in units of 10−16 W m−2. 3σ upper limits are prefaced by <.
Download table as: ASCIITypeset image
Table 9. PAHFIT Emission-line Fluxes
| [Ar ii] | [S iv] | [Ne ii] | [Ne iii] | [S iii] | [O iv] | [Fe ii] | [S iii] | [Si ii] | |
|---|---|---|---|---|---|---|---|---|---|
| Galaxy | 7.0 μm | 10.5 μm | 12.8 μm | 15.6 μm | 18.7 μm | 25.9 μm | 26.0 μm | 33.5 μm | 34.9 μm |
| 0379_579_51789 | <5.86 | <3.34 | <2.16 | <2.86 | <3.45 | ... | ... | <4.69 | <5.59 |
| 0413_238_51929 | <6.52 | ... | 5.18 ± 0.72 | 2.08 ± 0.40 | ... | <4.15 | <3.09 | <2.73 | <3.30 |
| 0570_537_52266 | 8.03 ± 0.96 | <2.29 | <2.16 | <2.55 | ... | ... | <2.25 | 4.06 ± 0.67 | <5.08 |
| 0623_207_52051 | ... | ... | <3.15 | ... | <1.89 | ... | <0.71 | <1.83 | 5.26 ± 0.74 |
| 0637_584_52174 | <9.29 | <3.05 | 5.32 ± 0.58 | ... | <3.48 | ... | <2.41 | <5.29 | ... |
| 0656_404_52148 | <14.61 | <3.70 | <3.81 | <2.65 | ... | <1.61 | ... | <2.57 | <3.45 |
| 0756_424_52577 | ... | <2.64 | 5.77 ± 0.50 | <4.27 | <3.11 | 1.61 ± 0.29 | ... | <4.04 | <6.97 |
| 0815_586_52374 | <7.91 | <2.52 | 2.90 ± 0.48 | 2.69 ± 0.35 | ... | <1.96 | <2.54 | ... | 5.24 ± 0.68 |
| 0951_128_52398 | ... | <2.14 | <1.70 | <2.91 | ... | <1.22 | ... | <2.41 | <3.41 |
| 0962_212_52620 | 13.29 ± 1.34 | ... | 18.15 ± 0.51 | 10.84 ± 0.70 | 8.53 ± 1.05 | ... | 4.84 ± 0.43 | ... | ... |
| 1039_042_52707 | ... | <1.94 | <1.56 | <1.10 | ... | <1.68 | <1.61 | <2.62 | <3.19 |
| 1170_189_52756 | <7.41 | ... | <5.86 | <2.53 | <2.76 | <1.89 | ... | 4.08 ± 0.57 | 3.58 ± 0.65 |
| 1279_362_52736 | <8.20 | 2.72 ± 0.48 | 7.45 ± 0.47 | <2.14 | ... | <4.66 | <3.83 | <2.55 | <2.93 |
| 1616_071_53169 | <10.96 | ... | <6.76 | <3.55 | ... | <4.00 | <3.69 | ... | <4.66 |
| 1927_584_53321 | <8.60 | <5.12 | 6.55 ± 0.50 | 6.29 ± 0.62 | <2.60 | <4.37 | <5.55 | <3.51 | <4.21 |
Note. Integrated fine-structure emission-line fluxes from PAHFIT, reported in units of 10−18 W m−2. 5σ upper limits are prefaced with "<." Nondetections are denoted by "... ."
Download table as: ASCIITypeset image
Table 10. PAHFIT H2 Rotational Line Fluxes
| H2S(0) | H2S(1) | H2S(2) | H2S(3) | H2S(4) | H2S(5) | H2S(6) | H2S(7) | |
|---|---|---|---|---|---|---|---|---|
| Galaxy | 28.2 μm | 17.0 μm | 12.3 μm | 9.7 μm | 8.0 μm | 6.9 μm | 6.1 μm | 5.5 μm |
| 0379_579_51789 | ... | 0.35 ± 0.011 | 0.18 ± 0.018 | 0.36 ± 0.019 | 0.26 ± 0.035 | 0.38 ± 0.037 | ... | ... |
| 0413_238_51929 | 0.08 ± 0.006 | 0.86 ± 0.012 | 0.46 ± 0.022 | 0.49 ± 0.025 | 0.55 ± 0.041 | 0.36 ± 0.051 | 0.42 ± 0.054 | ... |
| 0570_537_52266 | <0.04 | 0.81 ± 0.014 | 0.12 ± 0.020 | 0.59 ± 0.029 | 0.36 ± 0.038 | 0.38 ± 0.071 | ... | <0.18 |
| 0623_207_52051 | 0.28 ± 0.003 | 0.50 ± 0.005 | 0.14 ± 0.009 | 0.45 ± 0.013 | <0.14 | ... | ... | ... |
| 0637_584_52174 | 0.10 ± 0.011 | 0.68 ± 0.014 | 0.19 ± 0.027 | 0.65 ± 0.028 | 0.38 ± 0.042 | <0.25 | 0.28 ± 0.052 | 0.53 ± 0.053 |
| 0656_404_52148 | ... | 0.17 ± 0.019 | ... | 0.15 ± 0.029 | ... | <0.36 | <0.25 | <0.27 |
| 0756_424_52577 | 0.14 ± 0.007 | 0.49 ± 0.014 | 0.15 ± 0.026 | 0.35 ± 0.031 | 0.88 ± 0.038 | <0.41 | 0.29 ± 0.048 | ... |
| 0815_586_52374 | 0.14 ± 0.005 | 1.75 ± 0.006 | 0.36 ± 0.014 | 1.01 ± 0.019 | 0.68 ± 0.034 | 0.42 ± 0.077 | 0.57 ± 0.045 | ... |
| 0951_128_52398 | ... | 0.14 ± 0.009 | <0.08 | <0.12 | ... | 0.25 ± 0.048 | 0.70 ± 0.065 | <0.41 |
| 0962_212_52620 | 1.80 ± 0.010 | 5.67 ± 0.022 | 1.36 ± 0.046 | 12.59 ± 0.207 | 1.03 ± 0.084 | 1.50 ± 0.075 | ... | 0.54 ± 0.069 |
| 1039_042_52707 | ... | <0.03 | <0.09 | 0.23 ± 0.019 | 0.19 ± 0.031 | ... | ... | ... |
| 1170_189_52756 | 0.04 ± 0.004 | 0.11 ± 0.008 | <0.06 | <0.09 | ... | ... | 0.45 ± 0.060 | ... |
| 1279_362_52736 | 0.23 ± 0.004 | 1.38 ± 0.008 | 0.38 ± 0.027 | 0.91 ± 0.025 | 0.42 ± 0.059 | 1.03 ± 0.071 | 0.29 ± 0.039 | ... |
| 1616_071_53169 | ... | 0.13 ± 0.013 | ... | 0.61 ± 0.025 | 0.19 ± 0.036 | <0.22 | <0.21 | 0.34 ± 0.038 |
| 1927_584_53321 | <0.03 | 0.47 ± 0.014 | 0.13 ± 0.021 | 0.56 ± 0.030 | <0.24 | <0.38 | <0.25 | ... |
Note. Integrated H2 pure rotational emission-line fluxes from PAHFIT, reported in units of 10−18 W m−2. 5σ upper limits are prefaced with "<." Nondetections are denoted by "... ."
Download table as: ASCIITypeset image
Footnotes
- 16
Calibration version 65.
- 17
Increasing dust column both removes Hα and NUV power and contributes additional infrared emission, making the slope of the extinction curve valid, but amplifying absolute extinction values.
- 18
- 19
Local extinction may be higher or lower depending on clumpiness of the ISM.
- 20
While in many systems low-velocity molecular shocks and fast, radiative shocks may be connected via a turbulent cascade (e.g., Stephan's Quintet; P. Appleton 2018, private communication), sustained turbulent heating, resulting in significant localized gas dispersions (e.g., ≳20 km s−1), is all that is required to excite H2 rotational emission.
- 21
CLOUDY models emission from H ii regions only and does not include shock emission.