


Abstract
The product of the  differential production cross-section and the branching fraction of the decay
  is measured as a function of the beauty hadron transverse momentum, pT, and rapidity, y. The kinematic region of the measurements is pT < 20 GeV/c and 2.0 < y < 4.5. The measurements use a data sample corresponding to an integrated luminosity of 3fb−1 collected by the LHCb detector in pp collisions at centre-of-mass energies
  in 2011 and
  in 2012. Based on previous LHCb results of the fragmentation fraction ratio the branching fraction of
  the decay
  is measured to be

where the first uncertainty is statistical, the second is systematic, the third is due to the uncertainty on the branching fraction of the decay B̅0 → J/ψK̅*(892)0, and the fourth is due to the knowledge of  . The sum of the asymmetries in the production and decay between
  and
and  is also measured as a function of pT and y. The previously published branching fraction of
  , relative to that of
  , is updated. The branching fractions of
  are determined.
Export citation and abstract BibTeX RIS

Content from this work may be used under the terms of the Creative Commons Attribution 3.0 licence. Any further distribution of this work must maintain attribution to the author(s) and the title of the work, journal citation and DOI.
1. Introduction
In quantum chromodynamics (QCD) the production process of b hadrons can be divided into two steps, assuming factorisation: a hard process for b production and a soft process to describe hadronisation. The hard process can be predicted by perturbative calculations in QCD; the soft process is parameterised by the fragmentation function, which has large uncertainties due to non-perturbative QCD contributions. The study of the production of b hadrons tests the factorisation ansatz. The ground state of the b-baryon family,  , has a wide range of decay modes. The study of its production and decays can offer complementary information to that obtained from the study of B mesons. The kinematic dependence of the production of
  baryons relative to that of B mesons can test differences in the b quark hadronisation process between the two [1,2]. Furthermore, the asymmetry of heavy flavoured baryons and antibaryons produced in pp collisions is an important input for various asymmetry measurements. Leading-order QCD calculations predict equal production cross-sections for heavy baryons and heavy anti-baryons, while measurements at the ISR showed that
  production is favoured in pp collisions at forward rapidity, y [3,4]. The CMS experiment measured the
  and
and  production ratio in pp collisions at 7 TeV, and no asymmetry was observed, but the large uncertainties preclude definitive conclusions [5]. Measurements at LHCb can provide further tests of existing mechanisms, e.g., the string drag effect or the leading quark effect [6].
Measurements of  production to date have mostly been based on semileptonic decays and the hadronic decays
  and
and  (charge-conjugation is implied throughout the paper unless otherwise specified). Using semileptonic decays, the LHCb experiment measured the ratio of
  baryon production to light B meson production,
  [7]. The kinematic dependence of the ratio of
  to B̅° production,
  , was measured using
  and B̅° → D+π decays, and the absolute branching fraction
  was determined [8].
In this paper, the  candidates are reconstructed in the decay channel
  , which was first observed by LHCb in 2013 [9]. Compared with the open-charm decays of
  baryons, this channel has higher trigger efficiencies, especially in the region of low transverse momentum, pT. Two pentaquark-charmonium states Pc(4380)+ and Pc(4450)+ were observed by LHCb [10] in the amplitude analysis of the
  decay. The measurement of the absolute branching fraction of
  in the current paper allows the pentaquark branching fractions to be determined. Other
  decays with a charmonium meson in the final state, such as the Cabibbo-suppressed decay
  [11], can use the
  decay as a reference to measure their absolute branching fractions.
The product of the  differential production cross-section and the branching fraction of the
  decay is measured as a function of pT and y, where K̅*0 indicates the K̅*(892)0 meson throughout the text. The kinematic region of these measurements is pT<20 GeV/c and 2.0<y<4.5 for the b hadron. The production ratio of the two b hadrons, defined as

is determined, taking advantage of the cancellation of some uncertainties in both experimental measurements and theoretical calculations. Here,  and σ(B̅0) represent the production cross-sections of
  and B̅0 hadrons in pp collisions. The branching fraction
  is calculated from this result using previous measurements of
  [7,8] and
  [12]. The kinematic dependence of the sum of the asymmetries in the production and decay, ap+d ≡ aprod + adecay, between
  and
and  is studied using
  and
and  decays. Furthermore, using the measurement of
  , the branching fractions of the decays
  and
and  are determined.
The measurements in this paper are based on a data sample corresponding to an integrated luminosity of 3fb−1, collected by the LHCb experiment in pp collisions at centre-of-mass energies  TeV in 2011 and
  TeV in 2012. Separate measurements are performed for each of the two centre-of-mass energies.
2. Detector and simulation
The LHCb detector [13,14] is a single-arm forward spectrometer covering the pseudorapidity range 2<η <5, designed for the study of particles containing b or c quarks. The detector includes a high-precision tracking system consisting of a silicon-strip vertex detector surrounding the pp interaction region [15], a large-area silicon-strip detector located upstream of a dipole magnet with a bending power of about 4 Tm, and three stations of silicon-strip detectors and straw drift tubes [16] placed downstream of the magnet. The tracking system provides a measurement of momentum, p, of charged particles with a relative uncertainty that varies from 0.5% at low momentum to 1.0% at 200 GeV/c. The minimum distance of a track to a primary vertex (PV), the impact parameter (IP), is measured with a resolution of (15 + 29/pT)μm, where pT is the component of the momentum transverse to the beam, in GeV/c. Different types of charged hadrons are distinguished using information from two ring-imaging Cherenkov detectors [17]. Photons, electrons and hadrons are identified by a calorimeter system consisting of scintillating-pad and preshower detectors, an electromagnetic calorimeter and a hadronic calorimeter. Muons are identified by a system composed of alternating layers of iron and multiwire proportional chambers [18]. The online event selection is performed by a trigger [19], which consists of a hardware stage, based on information from the calorimeter and muon systems, followed by a software stage, which applies a full event reconstruction. In the hardware trigger, events are selected by requiring at least one high-pT track that is consistent with a muon hypothesis. In the software trigger, two well-reconstructed muons are required to form a vertex with good fit χ2 and to have an invariant mass consistent with that of the J/ψ meson [20]. The trigger also requires a significant displacement between the J/ψ vertex and the associated PV of the pp collision.
In the simulation, pp collisions are generated using Pythia [21,22] with a specific LHCb configuration [23]. Decays of hadronic particles are described by EvtGen [24], in which final-state radiation is generated using Photos [25]. The interaction of the generated particles with the detector, and its response, are implemented using the Geant4 toolkit [26,27] as described in Ref. [28]. The physics models used by LHCb in Geant4 for hadronic interactions have been tested against experimental data from COMPAS [20], and good agreement was observed.*
3. Event selection
Candidates for  hadrons are reconstructed in the
  decay channel, where the J/ψ mesons are reconstructed in the dimuon final state, and K̅*0 candidates are reconstructed from
  decays. Since the
  and B̅0 → J/ψK̅*0 decays have the same topology, a similar event selection is adopted for both.
An offline selection is applied after the trigger and is divided into two steps: a preselection and a multivariate selection based on a boosted decision tree (BDT) [29–32].
In the preselection, each track of the  candidate is required to be of good quality [14,33–35]. Identified muons are required to have pT greater than 550 MeV/c, while hadrons are required to have pT greater than 250 MeV/c. The muons should be inconsistent with originating from any PV, as determined by their impact parameter. Each J/ψ candidate is required to have a good vertex fit χ2 and an invariant mass within
  of the known J/ψ mass [20]. Particle identification (PID) requirements are imposed on the final-state tracks. For the kaon and proton in the
  decay, the sum of the kaon and proton pT should be larger than 1 GeV/c. Each K̅*0 candidate is required to have a good vertex fit χ2 and to have pT greater than 1 GeV/c. The invariant mass of the reconstructed K̅*0 is required to be within ±70 MeV/c2 of the K̅*0 mass [20]. Each b hadron candidate must have a good vertex fit χ2, be consistent with originating from the PV, and have a decay time greater than 0.2 ps.
Some non-combinatorial backgrounds exist in the  data sample, originating from
 and
and  decays with the π+ and K+ misidentified as a proton. In order to suppress these events, the invariant mass is recalculated by interpreting the proton candidate as a pion or a kaon, and the two relevant invariant mass regions are vetoed: m(J/ψK−π+)∈[5250,5310] MeV/c2 and m(J/ψK+K−)∈[5340,5400] MeV/c2. After the mass vetoes these background contributions are reduced to a negligible level.
After the preselection, the  candidates are filtered with the BDT to further suppress combinatorial background. For the decays
  and B̅0 → J/ψK̅*0, the same BDT classifier is applied. Independent BDT classifiers are used for the 2011 and 2012 samples. In the BDT training a simulated
  sample is used as the signal. The background is taken from the lower, (5420,5560) MeV/c2, and upper, (5680,5820) MeV/c2, sidebands of the
  invariant mass distribution in data. Events in the sidebands are randomly divided into two parts, one for the training and the other for the test. No overtraining is observed. The following information is used by the BDT classifier: the kinematic properties and the impact parameters of the tracks; and the vertex quality, the decay length and the impact parameter of the reconstructed b hadron candidate. The variables used for the training are chosen based on their power to discriminate signal from background and on the similarity of their distributions for
  and B̅0 → J/ψK̅*0 decays. The threshold for the BDT response is chosen to maximise
  , where B represents the number of background events estimated from the sideband region and S the number of signal events in the mass peak.
4. Cross-section and branching fraction determination
The product of the differential production cross-section of each b hadron and the corresponding branching fraction is calculated as

where N(pT,y) and ε(pT,y) are respectively the signal yield and the efficiency as functions of pT and y of the b hadron, ΔpT and Δy are the bin widths,  is the integrated luminosity,
  is the absolute branching fraction of the
  decay, and
  represents the branching fractions of the intermediate decays:

The luminosity is measured with van der Meer scans and a beam-gas imaging method [36]. The 2011 and 2012 data samples correspond to 1019±17 pb−1 and 2056±23 pb−1, respectively. The branching fraction  [20], while
  is taken to be 2/3 assuming isospin symmetry. The branching fraction
  as measured by Belle [12] is used in preference to the world average value, since in the Belle result the S-wave component is subtracted.
5. Signal determination
The signal yields of the  and B̅ → J/ψK*0 decays are determined from unbinned extended maximum likelihood fits to the invariant mass distributions of the reconstructed b hadron candidates in each pT and y bin. In order to improve the mass resolution, the b hadron is refitted with constraints [37] that it originates from the PV and that the reconstructed J/ψ mass equals its known mass [20].
Figure 1 shows, as an example of one of the fit results, the invariant mass distributions of  and B̅0 candidates in the kinematic region pT∈[6,7] GeV/c and y∈[3.0,3.5] for the 2012 data sample. The signal shape in the fits is modelled by a double-sided Crystal Ball (DSCB) function, an empirical function comprising a Gaussian core together with power-law tails on both sides. The mean and the mass resolution of the DSCB function are free in the fits, while the tail parameters are determined from simulation in each kinematic bin according to the empirical function given in Ref. [38]. The combinatorial background is modelled by an exponential function whose parameters are left free in the fits.
In the fits to the  mass distribution, there is a contribution from the
  decay in which the proton is misidentified as a kaon and the kaon is misidentified as a proton. This background is denoted as the doubly misidentified background, and it is modelled by a DSCB function. All parameters of this DSCB function are fixed from the simulation study, including: the difference between the mean of this DSCB function and that of the signal shape; the ratio of the mass resolution between these two DSCB; the yield fraction relative to the
  signal channel; and the tail parameters.
In the B̅ → J/ψK̅*0 sample, in addition to the combinatorial background, there are two further sources of background. One is the decay  , which populates the upper sideband of the invariant mass distribution, and is modelled with a DSCB function. The tail parameters of this DSCB function are the same as those of the
  0 signal shape and the remaining parameters are free in the fits. The other comes from partially reconstructed B mesons and is described by the tail of a Gaussian function. The associated mean and width are free parameters in the fits.
According to a previous LHCb measurement [39], the fraction of the K̅*0 meson contribution in the B̅0 → J/ψK̅*0 decay is calculated as (89.9±0.4±1.3)%, where the remainder is due to the S-wave component in the K−π+ system and its interference with the K̅*0 meson. The fitted B̅0 yields are subtracted with this number to remove the components from S-wave and its interference.

Download figure:
Standard image High-resolution image
Fig. 1. Fit to the (left) J/ψpK− and (right) J/ψK̅*0 invariant mass distributions with pT ∈ [6,7] GeV/c and y ∈ [3.0,3.5] for the 2012 data sample. The hatched (red) area represents the signals, the filled (green) area  , and the dashed (magenta) lines the combinatorial background. The dot-dashed (black) lines indicate the doubly misidentified background (left) and partially reconstructed background (right). The solid (blue) lines represent the sum of the above components and the points with error bars show the data.
Download figure:
Standard image High-resolution image6. Efficiencies
The efficiency  consists of the geometrical acceptance of the detector, the trigger efficiency, the reconstruction and preselection efficiency, the hadron PID efficiency, and the BDT selection efficiency. All the efficiencies are determined from a sample of simulated signal events, except the hadron PID efficiency, which is determined from data with tracks from the decays J/ψ → μ+μ−, D*+ → D0(→K−π+)π+ and
  .
.
The rich resonance structure observed in decays of  in data [10] is not modelled in the simulation. The simulated sample is weighted to reproduce the distributions of the BDT training variables and the two-dimensional distribution of m(pK−) and m(J/ψp) observed in the background-subtracted data sample, which has been obtained using the sPlot technique [40], with the b-hadron invariant mass as the discriminating variable. It is found that the correlations between the discriminating variable and the control variables are negligible.
7. Asymmetry determination
The observed (raw) asymmetry for  and
and  is defined as

The symbol N(x) is the signal yield in the given bin of x from the fits to the invariant mass distribution of the  sample, where x denotes pT or y. The observed asymmetry is a sum of several contributions: the asymmetry between the numbers of the produced
  and
and  baryons in pp collisions, aprod(x); the decay asymmetry between the
  and
and  channels, adecay(x); the asymmetry between the p and p̅ detection efficiencies,
  the asymmetry between the K− and K+ detection efficiencies,
  and the asymmetry between the PID efficiencies for
  and
and  baryons, aPID(x). Other possible asymmetries are neglected. Assuming that all these asymmetries are small, the asymmetries ap+d(x) of
  and
and  baryons can be calculated as

The value Araw(x)−aPID(x) can be calculated as

where  and
and  represent the PID efficiencies for
  and
and  . The kaon detection asymmetry
  as a function of pT and y is obtained from a previous LHCb study [41]. The proton detection asymmetry
  as a function of pT or y is estimated from simulation, which uses the Geant4 model as described in Section 2. The proton detection asymmetry as a function of pT or y is calculated with the proton and antiproton track reconstruction efficiencies in the corresponding kinematic bin. It is checked that the kinematic distributions of protons and
  baryons in the simulation sample are consistent with those in the data sample. As a crosscheck, the proton detection asymmetries are also estimated through a simulation sample, where the
  signals are partially reconstructed without using the proton information, and the results are consistent.
8. Systematic uncertainties
Several sources of systematic uncertainties are studied in the analysis and are summarised in Tables 1 and 2. For the production cross-section measurements, the uncertainties originate from the determination of the signal yields, efficiencies, branching fractions and luminosities. The total systematic uncertainties are obtained from the sum in quadrature of all components.
Table 1. Summary of the systematic uncertainties (%) for the production cross-sections of  and 0. The large uncertainties affect the bins with very few candidates.
 |
 |
0(8 TeV) |
0(7 TeV) |
|
|---|---|---|---|---|
| Uncorrelated between bins | ||||
| Signal shape | 0.4-15.4 | 0.2-6.2 | 0.2-1.5 | 0.2-1.5 |
| Background shape | 0.0-1.9 | 0.0-4.3 | 0.0-0.9 | 0.0-0.9 |
| Simulation sample size | 4.1-16.5 | 3.9-14.3 | 1.7-9.5 | 2.2-14.9 |
| BDT efficiency | 0.4-2.5 | 0.4-2.8 | 0.1-0.5 | 0.1-0.5 |
| Trigger efficiency | 0.0-4.6 | 0.0-14.9 | 0.0-2.1 | 0.0-4.0 |
| PID efficiency | 0.4-8.4 | 0.4-15.8 | 0.2-4.6 | 0.2-2.7 |
| Resonance | 0.0-1.0 | 0.0-1.8 | ||
| Correlated between bins | ||||
| Tracking efficiency | 3.0 | 3.0 | 3.0 | 3.0 |
| Mass veto efficiency | 1.3 | 1.9 | ||
| Luminosity | 1.7 | 1.2 | 1.7 | 1.2 |
| B(J/ψ → μ+μ−) | 0.6 | 0.6 | 0.6 | 0.6S |
| S-wave and interference in K−π+ | 1.4 | 1.4 |
Table 2. Summary of the absolute systematic uncertainties (%) for the asymmetry of  and
and  . The large uncertainties affect the bins with very few candidates.
| 2011 | 2012 | |
|---|---|---|
| PID efficiency | 0.4-4.4 | 0.0-2.6 |
| Signal shape | 0.0-0.8 | 0.0-0.9 |
| Background shape | 0.0-0.1 | 0.0-0.3 |
| MC statistics | 0.7-5.4 | 0.3-4.2 |
| Tracking asymmetry of proton | 0.1-1.9 | 0.1-1.9 |
Imperfect knowledge of the mass distributions for the signal and backgrounds causes systematic uncertainties in the signal yield determination. For the signal shape, the Apollonios function [42] and the sum of a Gaussian function and a Crystal Ball function are tried as alternatives to the DSCB. The largest deviation to the nominal result is taken as the uncertainty due to the model of the signal shape.
The fits are repeated with a linear function substituted for the exponential model for the combinatorial background. The fits are also repeated without the double misidentified components. The maximum differences of the signal yields from the nominal results are quoted as systematic uncertainties due to the background shape.
Most efficiencies are estimated from simulation. The limited size of the simulation sample leads to systematic uncertainties on the efficiencies ranging from 1.7% to 16.5%.
The tracking efficiency is estimated from simulation and calibrated by data [43]. The uncertainty of the calibration is 0.4% per track. Additional systematic uncertainties are assigned to hadrons due to imperfect knowledge of hadron interactions in the detector, 1.1% for kaons, 1.4% for pions and 1.4% for protons.
The BDT efficiency is estimated with the weighted simulation sample to ensure that the distributions of the two training variables, the kinematic properties of the tracks and the vertex quality, agree with those in data. The uncertainties on the weights are propagated to the final results to give the corresponding systematic uncertainty.
The trigger efficiency is determined in the simulation and validated in a control sample of J/ψ → μ+μ− decays [19]. The difference of the central values of this determination in data and the simulation in each bin is taken as the systematic uncertainty. Uncertainties due to the limited sample size of the simulation are added in quadrature.
The PID efficiency is estimated with a data-driven method. A sample of J/ψ → μ+μ−, D*+ → D0(→ K−π+)π+ and  decays obtained without using PID information is used to evaluate the PID efficiency. The limited sample size used to calculate the PID efficiency introduces a systematic uncertainty in each kinematic bin. To study the bin-by-bin migration effect, the number of the bins is doubled or halved and the PID efficiency is recalculated. The largest deviation from the nominal result is taken as the uncertainty.
To account for the rich and complex structure of multiple intermediate resonances in the  decay, the simulation sample is weighted in two-dimensional bins of m(K−p) and m(J/ψp) to match the data. Pseudoexperiments are performed to estimate the systematic uncertainties due to the weights. The weight in each bin is varied according to its uncertainty and the total efficiency is recalculated. The RMS of the distribution obtained from the pseudoexperiments is taken as the systematic uncertainty. As mentioned in Section 3, the preselection includes mass vetoes. The preselection efficiencies are estimated from the simulation sample. A fit to the
  invariant mass distribution in the vetoed data sample is performed, which gives the number of
  signal events rejected by the vetoes. The fraction of the vetoed signal events in the data sample is compared with that in the simulation sample. A difference of 1.3% (1.9%) is observed for the 2011 (2012) sample, and this is taken as the systematic uncertainty.
The uncertainty in the determination of the integrated luminosity is 1.7% (1.2%) for the 2011 (2012) data sample [36]. An uncertainty of 0.6% is taken on  [20]. The fractions of the S-wave component in the K−π+ system and their interference were determined by a previous LHCb measurement, and their 1.4% uncertainty [39] is taken as a systematic uncertainty for the B̅0 → J/ψ
 *0 decay.
In the  and
and  asymmetry measurement, all of the uncertainties mentioned above cancel in the ratio, except for those due to the signal shape, the background shape, the limited sample size and the PID efficiency. Since a data-driven determination of proton detection asymmetries is not available, the difference in the determination of the kaon detection asymmetries in data and simulation is taken as a systematic uncertainty for the proton detection asymmetry. The uncertainties vary from 0.1% to 1.9% in kinematic bins, with large values occurring in bins of low pT or low signal yields. In the LHCb Geant4 physics models, the cross-sections of interactions between particles and the material are checked with test beam data as discussed in Section 2. There are more data for protons than for kaons. Therefore, these uncertainties can be considered to be conservative.
9. Cross-section results
The product of the  double-differential cross-section and the branching fraction of the decay
  is shown in Fig. 2, and the values are listed in Tables 3, 4, 5 and 6 in the Appendix. By integrating over y or pT, the single differential production cross-sections, shown in Fig. 3, are obtained. Figure 3 shows the pT distribution of the
  production, fitted by a power-law function with the Tsallis parameterisation [44,45]:

where T is a temperature-like parameter, N determines the power-law behaviour at large Ek┴, and  with M the mass of the hadron. The fit results are

For the 7 TeV (8 TeV) sample, the fit χ2 is 21.0 (10.7) for 7 (9) degrees of freedom. The parameters T and N obtained from the 7 TeV and 8 TeV samples are consistent with each other and with the values found by CMS [5]. Other functions suggested in Ref. [46] do not give acceptable fits to the data. In Fig. 4 the data points are placed in the bin according to the prescription of Ref. [47].

Download figure:
Standard image High-resolution image
Download figure:
Standard image High-resolution image
Download figure:
Standard image High-resolution image
Fig. 2. Products of production cross-sections and branching fractions as functions of pT in y bins for (left)  and (right) B̅0 → J/ψK̅*0. The top (bottom) plots represent the 2011 (2012) sample. The error bars represent the total uncertainties.
Download figure:
Standard image High-resolution image
Download figure:
Standard image High-resolution image
Download figure:
Standard image High-resolution image
Download figure:
Standard image High-resolution image
Fig. 3. Products of production cross-sections and branching fractions as functions of (top) pT or (bottom) y. The left (right) plots represent  hadrons. The error bars indicate the statistical uncertainties and the hatched areas represent the total uncertainties.
Download figure:
Standard image High-resolution image
Fig. 4. Fit to the  distribution with the Tsallis function.
Download figure:
Standard image High-resolution imageThe integrated cross-sections of the b hadrons with 0<pT<20 GeV/c and 2.0<y<4.5 are measured to be

Taking the branching fraction  from Belle [12], the measured B̅0 production cross-section at 7 TeV is consistent with the previous LHCb measurement [38]. The ratios of the
  and B̅0 integrated production cross-sections between 8 TeV and 7 TeV, in the kinematic range 0<pT<20 GeV/c and 2.0 < y < 4.5, are

where the first uncertainties are statistical and the second systematic. Many systematic uncertainties cancel totally or partially in these ratios: the ratio of the luminosities is known with a precision of 1.44% [36]; the tracking efficiency is considered to be fully correlated, due to the fact that the associated systematic uncertainty is dominated by hadronic interactions of the tracks in the detector; the mass veto efficiency, the branching fraction of the J/ψ → μ+μ− decay, and the S-wave contribution in the K−π+ system are also fully correlated. All other sources are considered uncorrelated. The ratio of the integrated production cross-sections agrees with FONLL predictions [48–50]. Figure 5 shows the pT and y dependence of the ratios for  and B̅0 production cross-sections at 8 TeV with respect to those at 7 TeV, together with linear fits to the distributions:

where ⟨pT⟩ = 6.7 (6.9) GeV/c is the mean pT of  hadrons in the data sample, ⟨y⟩ = 3.1 is the mean y, and ndf is the number of degrees of freedom. The pT dependence of the ratio agrees with FONLL predictions, while the y dependence does not.

Download figure:
Standard image High-resolution image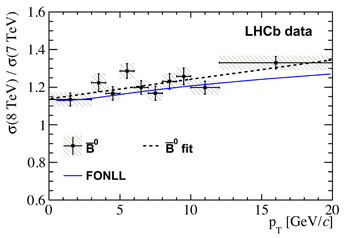
Download figure:
Standard image High-resolution image
Download figure:
Standard image High-resolution image
Fig. 5. Production ratios of (left)  and (right) B̅0 at 8 TeV and 7 TeV as functions of the (top) pT and (bottom) y of the b hadron. The blue lines are FONLL predictions. The error bars represent uncorrelated uncertainties, while the hatched areas show the total uncertainties. Linear fits are also shown.
Download figure:
Standard image High-resolution imageThe measured values of the ratio  , defined in Eq. (1), as a function of pT and y are shown in Fig. 6. In the region pT < 5 GeV/c, no pT dependence of the ratio
  is observed, while the ratio decreases for pT > 5 GeV/c. No dependence with rapidity is observed. In Fig. 6 the pT dependence of the ratio
  is fitted with the fragmentation function ratio
  given in Ref. [8], which is only defined in the range pT > 3 GeV/c.

Download figure:
Standard image High-resolution image
Fig. 6. Ratio  as a function of (left) pT and (right) y for the 2011 and 2012 samples, where the error bars indicate statistical uncertainties and the hatched areas the total uncertainties. The red solid (blue dashed) line in the left plot represents the fit to the ratio
  from Ref. [8] for the 2011 (2012) data sample.
Download figure:
Standard image High-resolution image
Download figure:
Standard image High-resolution image
Fig. 7. Asymmetries ap + d between  and
and  as functions of (left) pT and (right) y. The error bars indicate statistical uncertainties, and the hatched areas the total uncertainties.
Download figure:
Standard image High-resolution image
The asymmetry ap+d between  and
and  is shown in Fig. 7. The values are listed in Table 7 in the Appendix. The data points are fitted with linear functions. The slope fitted to the asymmetry as a function of pT is consistent with zero, (2.3 ± 3.0) × 10−3/(MeV/c) for 7 TeV and (3.5 ± 2.0) × 10−3/(MeV/c) for 8 TeV. The fit to ap+d(y) gives a non-zero slope, and a combination of the results for 7 TeV and 8 TeV gives

where ⟨y⟩ = 3.1 is the average rapidity of  hadrons in the data sample. The non-zero slope suggests some baryon number transport from the beam particles to the less centrally produced
  , which leads to a
  cross-section ratio that increases with rapidity and which can be interpreted as, for example, a string drag effect or leading quark effect [6,51].
10. Branching fraction results
The ratio  can be calculated in bins of pT as:

It is related to the fragmentation fraction ratio  through

where  is a constant factor, which can be determined from the fit in Fig. 6. The absolute branching fraction of the decay
  can then be measured as

The average of the fit results for the 7 and 8 TeV samples gives S = 0.2458 ± 0.0030, which results in

The first uncertainty is statistical, the second is systematic, the third is due to the uncertainty on the branching fraction of the B̅0 → J/ψK̅*0 decay, and the fourth is due to the knowledge of  .
.
In Ref. [11] the ratio  was reported. Combining this with the value of
  above, the branching fraction of
  is determined as

where the first uncertainty is statistical, the second is due to the systematic uncertainty on  , and the third is due to systematic uncertainty on
  .
.
Two pentaquark-charmonium states, Pc(4380)+ and Pc(4450)+, were observed by LHCb in the amplitude analysis of the  decay [10], and the fractions
  of the two pentaquark-charmonium states in the
  decay were measured. Using these fractions and the value of
  obtained in this analysis, the branching fractions
  are calculated as

where the first uncertainty is statistical, the second is due to the systematic uncertainty on  , and the third is due to the systematic uncertainty on
  .
.
11. Conclusion
Using a data sample corresponding to an integrated luminosity of 3fb−1 collected by the LHCb detector in 2011 and 2012, the product of the  differential production cross-section and the branching fraction of the decay is measured as a function of the
  baryon's transverse momentum and rapidity. The product of the B̅0 differential production cross-section and the branching fraction of the decay B̅0 → J/ψK̅*0 is also measured. The kinematic region of the measurements is pT < 20 GeV/c and 2.0 < y < 4.5.
The ratios of the cross-sections at  to those at
  are calculated for
  and B̅0 hadrons and are compared with FONLL predictions. The pT dependence of the ratios is consistent with the FONLL calculations, while the y dependence is not consistent. The production ratios of the
  and B̅0 hadrons are given for the 2011 and 2012 samples separately, and are consistent with the dependence on pT and y of the b hadron observed in a previous LHCb analysis. The asymmetry ap+d between
  and
and  is also measured as a function of pT and y. The result suggests some baryon number transport from the beam particles to the
  baryons.
Using information on the fragmentation ratio  from a previous LHCb measurement, the absolute branching fraction
  is obtained. Using previous LCHb measurements, the branching fractions
  and
and  are determined.
We thank J. L. Rosner for interesting discussions of asymmetry in beauty baryon production. We express our gratitude to our colleagues in the CERN accelerator departments for the excellent performance of the LHC. We thank the technical and administrative staff at the LHCb institutes. We are indebted to the communities behind the multiple open source software packages on which we depend. We are also thankful for the computing resources and the access to software R&D tools provided by Yandex LLC (Russia).
Appendix
Table 3. Products of  production cross-sections (pb) and the branching fraction
  in bins of pT and y in the 2011 data sample. The first uncertainties are statistical and the second are systematic.
| pT/(GeV/c) | 2.0<y<2.5 | 2.5<y<3.0 | 3.0<y<3.5 |
|---|---|---|---|
| 0–3 | 326±42±44 | 354±18±23 | 319±14±20 |
| 3–4 | 439±58±54 | 503±27±33 | 486±22±31 |
| 4–5 | 445±48±48 | 425±21±27 | 376±17±22 |
| 5–6 | 411±39±45 | 297±15±17 | 296±13±17 |
| 6–7 | 224±23±24 | 235±12±14 | 203±10±12 |
| 7–8 | 162±17±16 | 175± 9±11 | 145±7.4±9.2 |
| 8–9 | 100±12± 9 | 109±6.5±7.0 | 92.7±5.5±6.3 |
| 9–10 | 83.2±9.7±8.1 | 93.6±6.0±6.4 | 63.6±4.4±4.6 |
| 10–12 | 53.6±4.6±4.3 | 39.5±2.3±2.4 | 29.0±1.8±1.9 |
| 12–20 | 11.4±0.8±0.7 | 11.3±0.6±0.6 | 8.6±0.6±0.6 |
| 3.5 < y < 4.0 | 4.0 < y < 4.5 | ||
| 0–3 | 244±13±19 | 221±26±35 | |
| 3–4 | 371±21±32 | 231±29±38 | |
| 4–5 | 294±16±22 | 138±18±19 | |
| 5–6 | 229±12±17 | 95±14±16 | |
| 6–7 | 151± 9±12 | 61±11± 8 | |
| 7–8 | 99.0±6.5±8.1 | 38.4±0.8±6.2 | |
| 8–9 | 69.0±5.3±5.9 | 37.7±7.7±5.9 | |
| 9–10 | 43.3±4.1±4.2 | 22.8±5.8±4.0 | |
| 10–12 | 20.4±1.9±1.7 | 7.8±1.8±1.2 | |
| 12–20 | 4.0±0.4±0.4 | 2.2±0.6±0.5 |
Table 4. Products of  production cross-sections (pb) and the branching fraction
  in bins of pT and y in the 2012 data sample. The first uncertainties are statistical and the second are systematic.
| pT/(GeV/c) | 2.0<y<2.5 | 2.5<y<3.0 | 3.0<y<3.5 |
|---|---|---|---|
| 0–1 | 100±29±33 | 159±20±27 | 157±15±22 |
| 1–2 | 465±64±88 | 487±29±50 | 433±24±46 |
| 2–3 | 661±63±120 | 648±30±58 | 541±22±41 |
| 3–4 | 706±51±94 | 715±25±52 | 559±18±38 |
| 4–5 | 579±39±68 | 624±20±39 | 417±12±27 |
| 5–6 | 463±28±47 | 446±14±28 | 356±10±23 |
| 6–7 | 318±20±29 | 322±10±20 | 210± 7±12 |
| 7–8 | 248±15±23 | 236± 8±15 | 159± 5±10 |
| 8–9 | 173±11±18 | 140.7±5.4±9.2 | 118.4±4.4±7.8 |
| 9–10 | 130± 9±13 | 92.6±3.9±6.3 | 65.4±2.9±4.4 |
| 10–12 | 81.3±4.5±7.0 | 57.1±2.1±3.4 | 38.1±1.5±2.4 |
| 12–20 | 15.2±0.7±1.0 | 13.7±0.5±0.8 | 9.5±0.4±0.6 |
| 3.5 < y < 4.0 | 4.0 < y < 4.5 | ||
| 0–1 | 141±18±33 | 108±29±51 | |
| 1–2 | 269±20±41 | 222±36±52 | |
| 2–3 | 427±21±48 | 234±28±43 | |
| 3–4 | 393±17±34 | 256±25±45 | |
| 4–5 | 324±12±27 | 195±17±26 | |
| 5–6 | 229± 9±16 | 111±11±16 | |
| 6–7 | 152± 7±11 | 99±10±14 | |
| 7–8 | 114± 5± 9 | 51.3±5.8±6.4 | |
| 8–9 | 74.7±4.2±6.1 | 30.8±5.0±5.0 | |
| 9–10 | 55.4±3.5±5.4 | 17.4±3.5±2.9 | |
| 10–12 | 27.7±1.7±2.3 | 10.3±1.6±1.4 | |
| 12–20 | 6.1±0.4±0.5 | 1.4±0.4±0.2 |
Table 5. Products of B̅0 production cross-sections (pb) and  in bins of pT and y in the 2011 data sample. The first uncertainties are statistical and the second are systematic.
| pT/(GeV/c) | 2.0<y<2.5 | 2.5<y<3.0 | 3.0<y<3.5 |
|---|---|---|---|
| 0–3 | 2850±130±200 | 2870±50±140 | 2580±30±110 |
| 3–4 | 4420±220±340 | 4350±80±220 | 3740±60±170 |
| 4–5 | 3540±160±250 | 3570±60±160 | 3310±50±150 |
| 5–6 | 2620±100±170 | 2920±50±130 | 2330±40±100 |
| 6–7 | 2290± 80±150 | 2150±40±100 | 1820±30± 80 |
| 7–8 | 1790± 70±110 | 1630±30± 80 | 1320±20± 60 |
| 8–9 | 1260± 50± 80 | 1150±20± 60 | 877±17± 42 |
| 9–10 | 853± 34± 53 | 862±19± 43 | 613±14± 31 |
| 10–12 | 581± 17± 32 | 540±10± 25 | 411± 8± 20 |
| 12–20 | 172± 4± 8 | 141± 2± 6 | 102± 2± 5 |
| 3.5 < y < 4.0 | 4.0 < y < 4.5 | ||
| 0–3 | 2110±30± 90 | 1450±40± 80 | |
| 3–4 | 2660±50±130 | 1790±70±130 | |
| 4–5 | 2310±40±110 | 1460±60±110 | |
| 5–6 | 1750±30± 80 | 1050±40± 80 | |
| 6–7 | 1190±30± 60 | 608±30± 48 | |
| 7–8 | 853±20± 45 | 573±29± 51 | |
| 8–9 | 650±18± 37 | 385±21± 38 | |
| 9–10 | 424±14± 27 | 207±15± 23 | |
| 10–12 | 258± 7± 15 | 96± 6± 9 | |
| 12–20 | 64± 2± 4 | 26± 2± 3 |
Table 6. Products of B̅0 production cross-sections (pb) and  in bins of pT and y in the 2012 data sample. The first uncertainties are statistical and the second are systematic.
| pT/(GeV/c) | 2.0<y<2.5 | 2.5<y<3.0 | 3.0<y<3.5 |
|---|---|---|---|
| 0–1 | 1260±110±200 | 1240±40± 80 | 1100±30± 60 |
| 1–2 | 3340±170±340 | 3360±60±170 | 3200±50±150 |
| 2–3 | 5860±220±600 | 4930±70±240 | 4100±50±180 |
| 3–4 | 6650±200±550 | 5010±60±240 | 4150±50±180 |
| 4–5 | 4560±120±310 | 4340±50±190 | 3400±40±140 |
| 5–6 | 4260±100±280 | 3550±40±160 | 2730±30±120 |
| 6–7 | 2830± 60±170 | 2560±30±110 | 1960±20± 80 |
| 7–8 | 2270± 50±140 | 1810±20± 80 | 1460±20± 70 |
| 8–9 | 1650± 40±100 | 1460±20± 70 | 1100±10± 50 |
| 9–10 | 1180± 30± 70 | 1070±20± 50 | 696±10± 34 |
| 10–12 | 707± 13± 38 | 614± 7± 27 | 489± 6± 23 |
| 12–20 | 246± 3± 11 | 180± 2± 8 | 129± 2± 6 |
| 3.5 < y < 4.0 | 4.0 < y < 4.5 | ||
| 0–1 | 1010±30± 60 | 754±45± 73 | |
| 1–2 | 2830±50±150 | 1720±60±140 | |
| 2–3 | 3200±50±160 | 2460±80±200 | |
| 3–4 | 3180±40±150 | 1770±50±130 | |
| 4–5 | 2610±30±120 | 1650±50±120 | |
| 5–6 | 1900±30± 90 | 1280±40±100 | |
| 6–7 | 1500±20± 70 | 816±26± 60 | |
| 7–8 | 1030±20± 50 | 621±22± 52 | |
| 8–9 | 711±13± 38 | 390±15± 34 | |
| 9–10 | 478±10± 28 | 301±13± 31 | |
| 10–12 | 312± 6± 18 | 137± 5± 12 | |
| 12–20 | 82± 2± 5 | 36± 2± 3 |
Table 7. Asymmetries ap+d (%) of  and
and  in bins of pT and y for the 2011 and 2012 samples. The first uncertainties are statistical and the second are systematic.
| 2011 | 2012 | |
|---|---|---|
| pT/(GeV/c) | ||
| 0–1 | –5.9±9.4±7.0 | –14.5±6.4±5.0 |
| 1–2 | +2.7±4.9±4.4 | –4.9±3.4±3.5 |
| 2–3 | –0.1±3.6±3.3 | –0.6±2.5±2.4 |
| 3–4 | –4.5±2.9±2.6 | –4.2±2.0±1.9 |
| 4–5 | –1.3±2.7±2.2 | –1.1±1.8±1.7 |
| 5–6 | –1.3±2.7±2.3 | –0.5±1.8±1.3 |
| 6–7 | +2.7±2.9±1.9 | –2.7±1.9±1.2 |
| 7–8 | +5.3±3.1±1.7 | –1.3±2.0±1.0 |
| 8–9 | –4.4±3.5±1.9 | –0.3±2.3±1.6 |
| 9–10 | –5.8±4.0±1.2 | +1.6±2.6±0.9 |
| 10–12 | +1.1±3.6±2.1 | +2.3±2.2±2.0 |
| 12–20 | +2.7±3.4±0.8 | +0.6±2.2±0.5 |
| y | ||
| 2.0<y<2.5 | –6.0±3.3±3.1 | –7.6±2.0±1.2 |
| 2.5<y<3.0 | –0.3±1.7±2.1 | –0.3±1.1±0.9 |
| 3.0<y<3.5 | –1.0±1.6±1.1 | +0.7±1.1±1.0 |
| 3.5<y<4.0 | +4.3±2.1±1.1 | +2.4±1.5±1.2 |
| 4.0<y<4.5 | +7.3±5.4±2.2 | +8.4±3.7±1.9 |
Footnotes
- *
Supported by CERN and national agencies: CAPES, CNPq, FAPERJ and FINEP (Brazil); NSFC (China); CNRS/IN2P3 (France); BMBF, DFG, HGF and MPG (Germany); INFN (Italy); FOM and NWO (The Netherlands); MNiSW and NCN (Poland); MEN/IFA (Romania); MinES and FANO (Russia); MinECo (Spain); SNSF and SER (Switzerland); NASU (Ukraine); STFC (United Kingdom); NSF (USA). The Tier1 computing centres are supported by IN2P3 (France), KIT and BMBF (Germany), INFN (Italy), NWO and SURF (The Netherlands), PIC (Spain), GridPP (United Kingdom). Individual groups or members have received support from EPLANET, Marie Skłodowska-Curie Actions and ERC (European Union), Conseil général de Haute-Savoie, Labex ENIGMASS and OCEVU, Région Auvergne (France), RFBR (Russia), XuntaGal and GENCAT (Spain), Royal Society and Royal Commission for the Exhibition of 1851 (United Kingdom).
- †
Data files are courtesy of the COMPAS Group, IHEP, Protvino, Russia.