


ABSTRACT
We complete our census of low-level nuclear activity in Virgo Cluster early-type galaxies by searching for obscured emission using Spitzer Space Telescope mid-infrared (MIR) imaging at 24 μm. Of a total sample of 95 early-type galaxies, 53 objects are detected, including 16 showing kiloparsec-scale dust in optical images. One-dimensional and two-dimensional surface photometry of the 37 detections without extended dust features reveals that the MIR light is more centrally concentrated than the optical light as traced by Hubble Space Telescope F850LP-band images. No such modeling was performed for the sources with dust detected in the optical images. We explore several possible sources of the MIR excess emission, including obscured nuclear emission. We find that radial metallicity gradients in the stellar population appear to be a natural and most likely explanation for the observed behavior in a majority of the sources. Alternatively, if the concentrated MIR emission were due to nuclear activity, it would imply a MIR-to-X luminosity ratio ∼5–10 for the low-luminosity active galactic nucleus (AGN) detected in X-rays by our survey. This ratio is an order of magnitude larger than that of typical low-luminosity AGNs and would imply an unusual spectral energy distribution. We conclude that the black holes found by our survey in quiescent early-type galaxies in Virgo have low bolometric Eddington ratios arising from low accretion rates and/or highly radiatively inefficient accretion.
Export citation and abstract BibTeX RIS
1. INTRODUCTION
Perhaps the most traditional technique to identify accretion-powered activity in galactic nuclei relies on identifying sources with an ultraviolet excess, i.e., sources whose spectral energy distribution (SED) does not steeply decline on the blue side of the stellar spectrum peak (e.g., Schmidt & Green 1983). Albeit successful, this method fails to detect both obscured and high-redshift active galactic nuclei (AGNs), which disappear from the UV due to absorption from local dust and the Lyman forests, respectively. This shortcoming is not negligible, since the presence of a large population of heavily obscured AGNs seems required by the hard spectrum of the X-ray background (Gilli et al. 2007).
More generally, optical, UV, and X-ray observations, which are traditionally employed to detect unobscured AGN activity, are still known to miss a large fraction of the obscured AGN population, and nearly all of the Compton-thick AGNs that are thought to dominate AGN number counts at high redshifts (Daddi et al. 2007).
The obscuring dust that hides AGNs from ultraviolet, optical, and soft X-ray surveys should be a strong, largely isotropic emitter in the mid-to-far-infrared. Inactive galaxies and AGNs have different SEDs at short infrared wavelengths, while the composite blackbody spectra of the stellar population of normal galaxies produce an SED that peaks at approximately 1.6 μm (in Fν), AGNs have roughly power-law-shaped SEDs. Searching for AGNs at these wavelengths suffers very modestly from extinction by dust or gas, as demonstrated, for example, by studies based on the Two Micron All Sky Survey (e.g., Glikman et al. 2004).
More recently, observations taken with the Multiband Imaging Photometer (MIPS; Rieke et al. 2004) and Infrared Array Camera (Fazio et al. 2004) on board Spitzer have been successfully employed to select AGN candidates independently of their optical and/or X-ray properties. In addition, they have proven capable of identifying heavily obscured AGNs that are missed even in the deepest X-ray fields, making IR selection a viable alternative to traditional AGN selection methods (e.g., Lacy et al. 2004; Hatziminaoglou et al. 2005; Polletta et al. 2006; Fiore et al. 2009).
Analyzing a 24 μm selected sample in GOODS-S, Donley et al. (2008) found that the fraction of MIR sources dominated by an AGN decreases with decreasing flux density, but only down to a 24 μm flux density of about 300 μJy. Below this limit, the AGN fraction levels out at 10%, indicating that a substantial fraction of faint 24 μm sources are primarily powered by mechanisms other than star formation. Furthermore, the majority of AGNs with low 24 μm flux densities are missed by X-ray surveys, suggesting that X-ray emission alone cannot be used to unambiguously pinpoint AGN activity.
Unfortunately, direct measurements of MIR Eddington ratios are mostly limited to samples of known AGNs—here loosely defined as emitting above a few percent of their Eddington luminosity. At fainter levels of nuclear luminosity, disentangling accretion powered and star formation powered MIR emission becomes a challenge. While contamination can be reduced by focusing on quiescent (in terms of their star formation) early-type galaxies, pushing the threshold to the lowest accretion rates/luminosities—that is, below a few thousandths of the Eddington limit in terms of nuclear, accretion-powered activity—necessarily means facing additional sources of contamination. Those include the stellar population itself, mainly made of photospheric emission in the Rayleigh–Jeans tail, and emission from dust produced in the atmospheres and outflows of evolved stars (e.g., Bressan et al. 1998).
The AMUSE-Virgo (AGN Multiwavelength Survey of Early-Type Galaxies in the Virgo Cluster; see URL http://tartufo.physics.ucsb.edu/~amuse/) project set out to effectively bridge the gap between formally inactive galactic nuclei and "traditional" AGNs. In order to detect and characterize supermassive black holes accreting at extremely sub-Eddington rates over a broad range in host stellar masses, we were awarded Chandra and Spitzer observations (SPITZER PID-30958, PI: T. Treu) of the 100 early-type galaxies which compose the Virgo Cluster Survey (VCS; Côté et al. 2004). The VCS sample is selected from the 163 Virgo spheroids brighter than BT < 16 (including 44% of all Virgo spheroids to this limit). It is complete to BT = 12 (i.e., MB ∼ −18) and it is a random subsample for fainter magnitudes, unbiased with respect to the nuclear properties. The sample covers over 4 orders of magnitude in black hole mass, as estimated from the MBH–σ relation and MBH–LB relation.
Archival F475W and F850LP band (hereafter g and z) Hubble ACS (Advanced Camera for Surveys) images are available for each target (see Ferrarese et al. 2006 for a detailed isophotal analysis), while Chandra observations of the same sample have been presented in Paper I and II of this series (Gallo et al. 2008, 2010). In this paper, we present the results of the MIPS Spitzer 24 μm observations.
2. OBSERVATIONS AND DATA REDUCTION
Out of 100 ACS-VCS galaxies, 56 have been observed in photometry mode as part of our survey. Archival Spitzer images covering the galaxy nucleus were available for 39 out of the remaining 44 objects (the nuclear position fell just off the observed fields for VCC 0140, VCC 0654, VCC 0751, VCC 1192, and VCC 1199—none of which was detected in X-rays). This yields a total of 95 objects out of 100 composing the original VCS sample for which MIPS 24 μm data are available.
The new and archival Spitzer MIPS data have been reduced in the same fashion: first, a second-order flat was created by median-combining all frames (excluding the first frame). The individual files were then corrected using this second-order flat. The flat-corrected frames were then subject to an overlap correction (to adjust background levels) and mosaicking, both performed using the Mopex software package. The final pixel size of the mosaics was chosen to be 1 275 pixel−1.
Archival Hubble Space Telescope (HST)/ACS z-band images were re-analyzed using standard data reduction procedures within IRAF/STSDAS. The images were drizzled onto a 0049 pixel−1 grid: the plate scales for MIPS and ACS were chosen to be integer multiples of each other, to allow for an easy comparison of the galaxies' radial profiles while still adequately representing the instrumental resolution.
3. ANALYSIS AND RESULTS
3.1. Aperture Photometry
First we performed aperture photometry to identify detections for further study and determine upper flux limits for the non-detections. We used an aperture with a diameter of 12'' (which corresponds to about twice the size of the FWHM of MIPS at 24 μm) and a sky annulus between 20''and 32''. The noise level was determined by the distribution of fluxes in 1000 apertures randomly placed in empty parts of the sky.
The flux distribution was then fitted by a Gaussian. The resulting standard deviation, appropriately corrected for point-spread function (PSF) losses, was taken as the 1σ photometric uncertainty for this mosaic. Sources detected at less than 3σ significance are considered non-detections (with typical 3σ upper limits of ∼0.3 mJy). In total we detect 53/95 sources observed at 24 μm. Upper limits for the non-detected sources are given in Table 2. We note that the upper limits determined here are by design point-source upper limits (i.e., for a nuclear MIR excess, see below) rather than upper limits for the total galaxy emission.
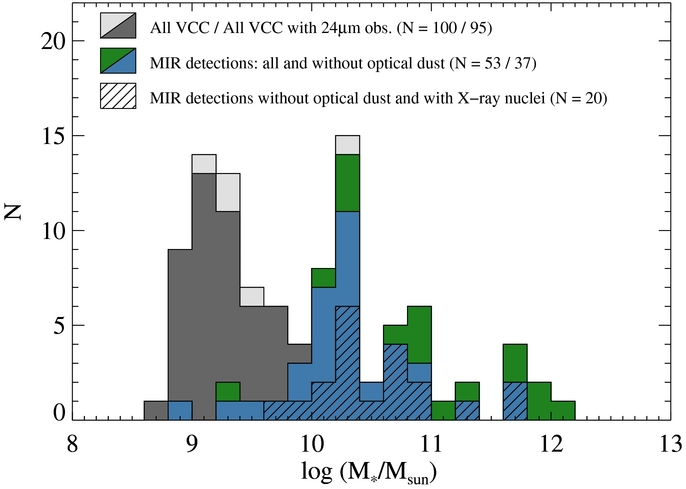
Figure 1 shows that all the objects undetected at 24 μm have stellar masses log M*/M☉ < 10. Stellar masses were taken from Gallo et al. (2010, see also Table 2).

Figure 1. VCC sources as a function of their stellar mass.
Download figure:
Standard image High-resolution image3.2. Sources with Extended Dust
One of the goals of this project is to detect possible nuclear MIR emission which may point toward obscured low-level AGN activity. However, in such a scenario, diffuse dust in the host galaxy becomes a significant source of contamination. In order to isolate any faint excess of nuclear dust emission, we must first account for possible diffuse dust emission originating from the host galaxy itself.
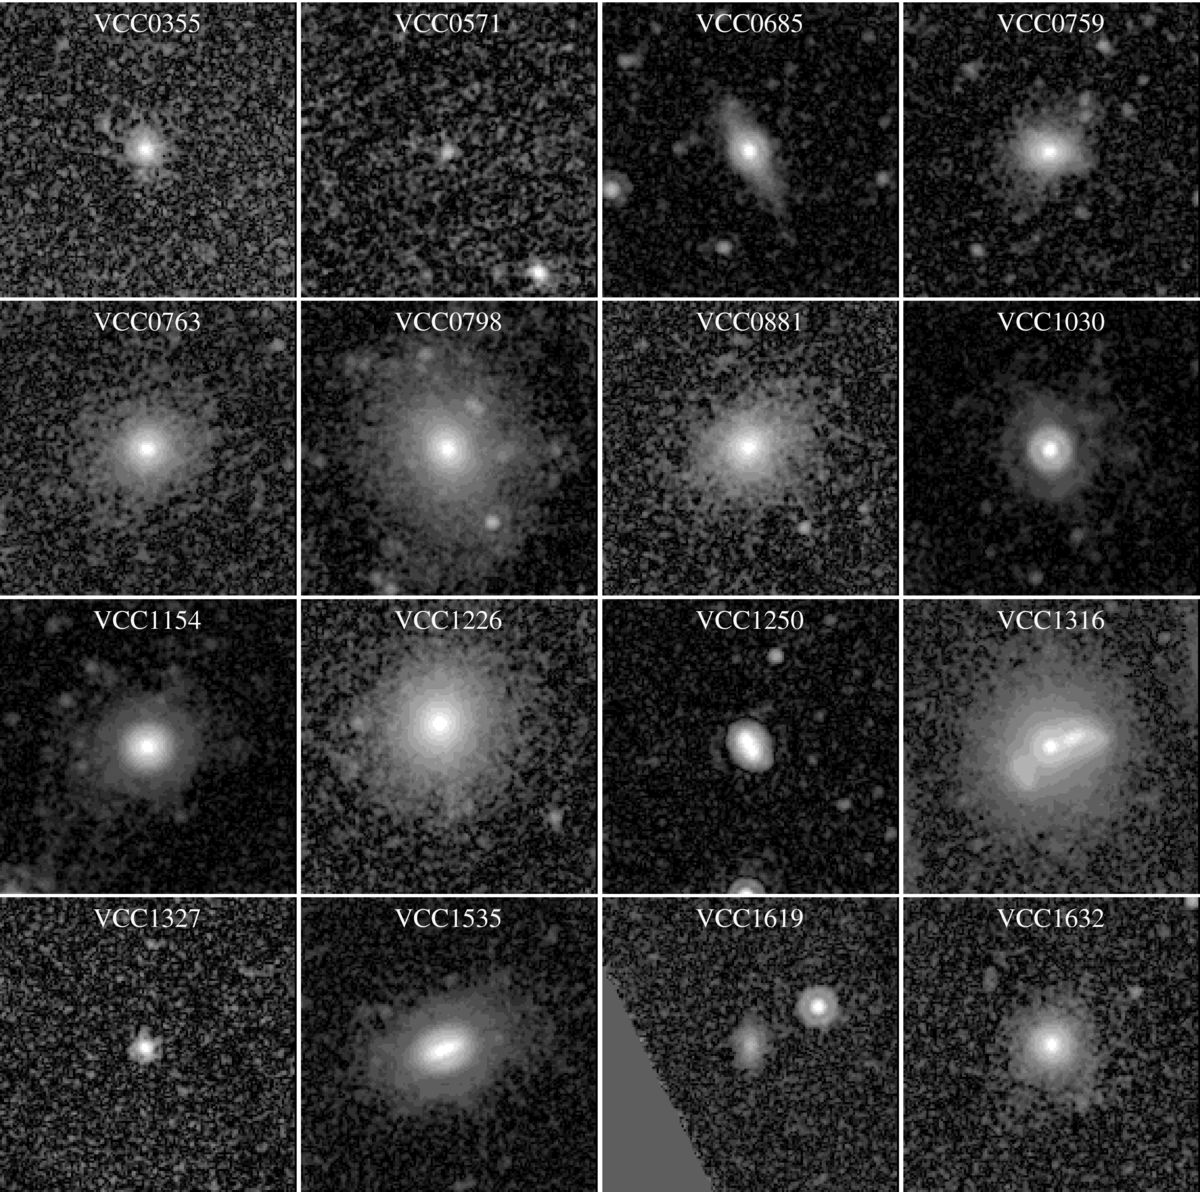
Some galaxies in our sample have extended (kpc-scale) dust features clearly detectable from the optical images (hereafter often called "optical dust," Ferrarese et al. 2006). The spatial resolution of Spitzer is not sufficient to resolve MIR emission from this dust in most of our objects. In such cases we cannot disentangle how much of the unresolved MIR flux comes from diffuse dusty structures or from a putative nuclear source. Therefore, we exclude any objects with optically detected dust in the host galaxy from further analysis. For reference, there are 18 objects with optically detected dust in our sample and we detect most of them at 24 μm, with the exception of VCC 1422 and VCC 1779. Thus, for this sample sources with optical dust have a higher incidence of MIR detections than sources lacking optical dust features. The MIR images of the 16 detected sources are shown in Figure 2.

Figure 2. MIPS 24 μm images of sources with dust in their host galaxy as detected optically. The images are 3 arcmin on a side, north is up, east is to the left.
Download figure:
Standard image High-resolution imageFor 11 of the 18 sources with optical dust, MIR spectra are available in the literature (Bressan et al. 2006; Bregman et al. 2006; Smith et al. 2007; Leipski et al. 2009) or in the Spitzer archive. Six of these show clear signs for recent (star formation) activity as inferred from the presence of polycyclic aromatic hydrocarbon (PAH) features (VCC 0759, VCC 0763, VCC 1030, VCC 1154, VCC 1535, and VCC 1619). In addition, and conceivably as a result of the on-going star formation, those sources are typically also detected at FIR wavelengths (e.g., Temi et al. 2009). One additional source is M 87 (VCC 1316) for which the MIR is dominated by non-thermal emission (e.g., Perlman et al. 2007; Buson et al. 2009). The remaining four sources do not show any particular features hinting at activity in their MIR spectra. We note that the fraction of X-ray detections for MIR-detected objects is roughly comparable for sources with and without optical dust (∼60%, see Table 1).
Table 1. Combinations of Detections
| Optical | MIR | X-ray | Number of |
|---|---|---|---|
| Dust | Detection | Nucleus | Sources |
| + | + | + | 10 |
| + | + | − | 6 |
| + | − | − | 2 |
| + | − | + | 0 |
| − | + | − | 17 |
| − | + | + | 20 |
| − | − | + | 2 |
| − | − | − | 38 |
| − | No MIR data | − | 5 |
Download table as: ASCIITypeset image
3.3. Radial Profiles
After excluding the 16 sources mentioned above, the remaining 37 sources with clear MIR detections show no indications of host galaxy dust in the optical from their HST images. Twenty of these also show a nuclear X-ray source as detected by Chandra (Gallo et al. 2010, see also Table 1).
It has been shown that for early-type galaxies the total luminosity at 24 μm correlates well with the optical luminosity (e.g., Temi et al. 2007). Furthermore, the mid-infrared radial light profiles follow the optical light profiles very closely (e.g., Knapp et al. 1992; Temi et al. 2007, 2008). In addition, the MIR spectra of quiescent early-type galaxies reveal emission in excess of photospheric Rayleigh–Jeans predictions (e.g., Bressan et al. 2006). This is generally interpreted as emission from dust produced in the photospheres and circumstellar regions of evolved mass-losing stars, mainly on the asymptotic giant branch (AGB). These findings argue that most of the MIR emission in early-type galaxies is directly associated with the stellar population. This provides a valuable tool in this study, because the optical light profiles (scaled appropriately) can be used as a proxy for the bulk of MIR emission which is associated with the stellar population.
For the 37 MIR-detected objects without optical dust detection we produced and analyzed azimuthally averaged radial surface brightness profiles at 24 μm. Radial light profiles were created using the task ellipse within IRAF. The central question is whether these galaxies require an additional nuclear component to explain their MIR light profiles or if the observed MIR emission is in accordance with emission from the host galaxy (stellar light and dust emission associated directly with the stellar population).
In order to use the optical light profiles as a proxy for the MIR emission expected from the stellar populations, we also created radial profiles from the re-reduced ACS z-band images, which we convolved with an observed MIPS PSF, after aligning them to the MIPS images to ACS-pixel accuracy. Because only few MIR maps included a sufficiently bright star to serve as a MIPS PSF for our analysis, we chose to create an average PSF from 12 individual stars on our maps which were reasonably bright, not close to the edges of the maps, and also fairly isolated. The radial surface brightness profile for the MIR PSF was derived in the same manner as for the ACS and MIPS images.
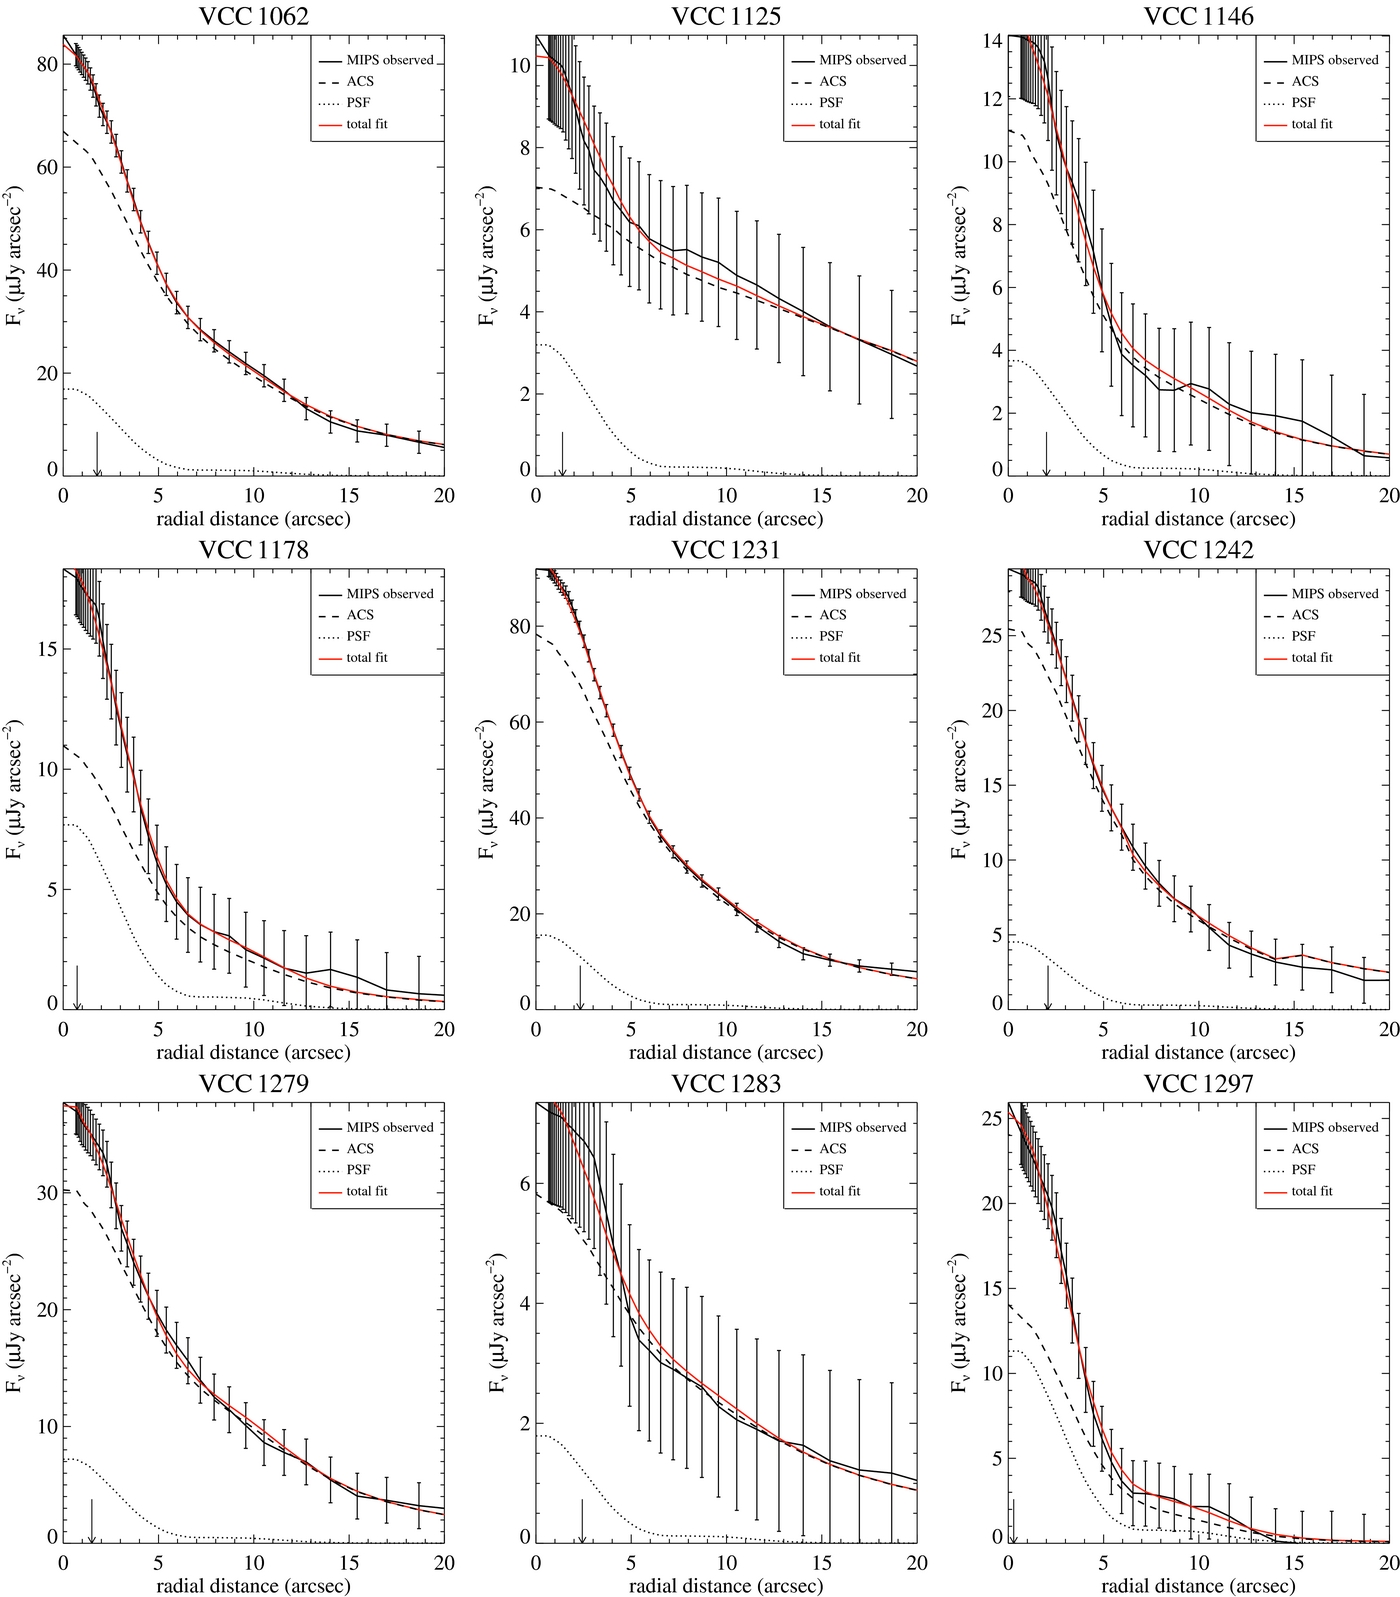
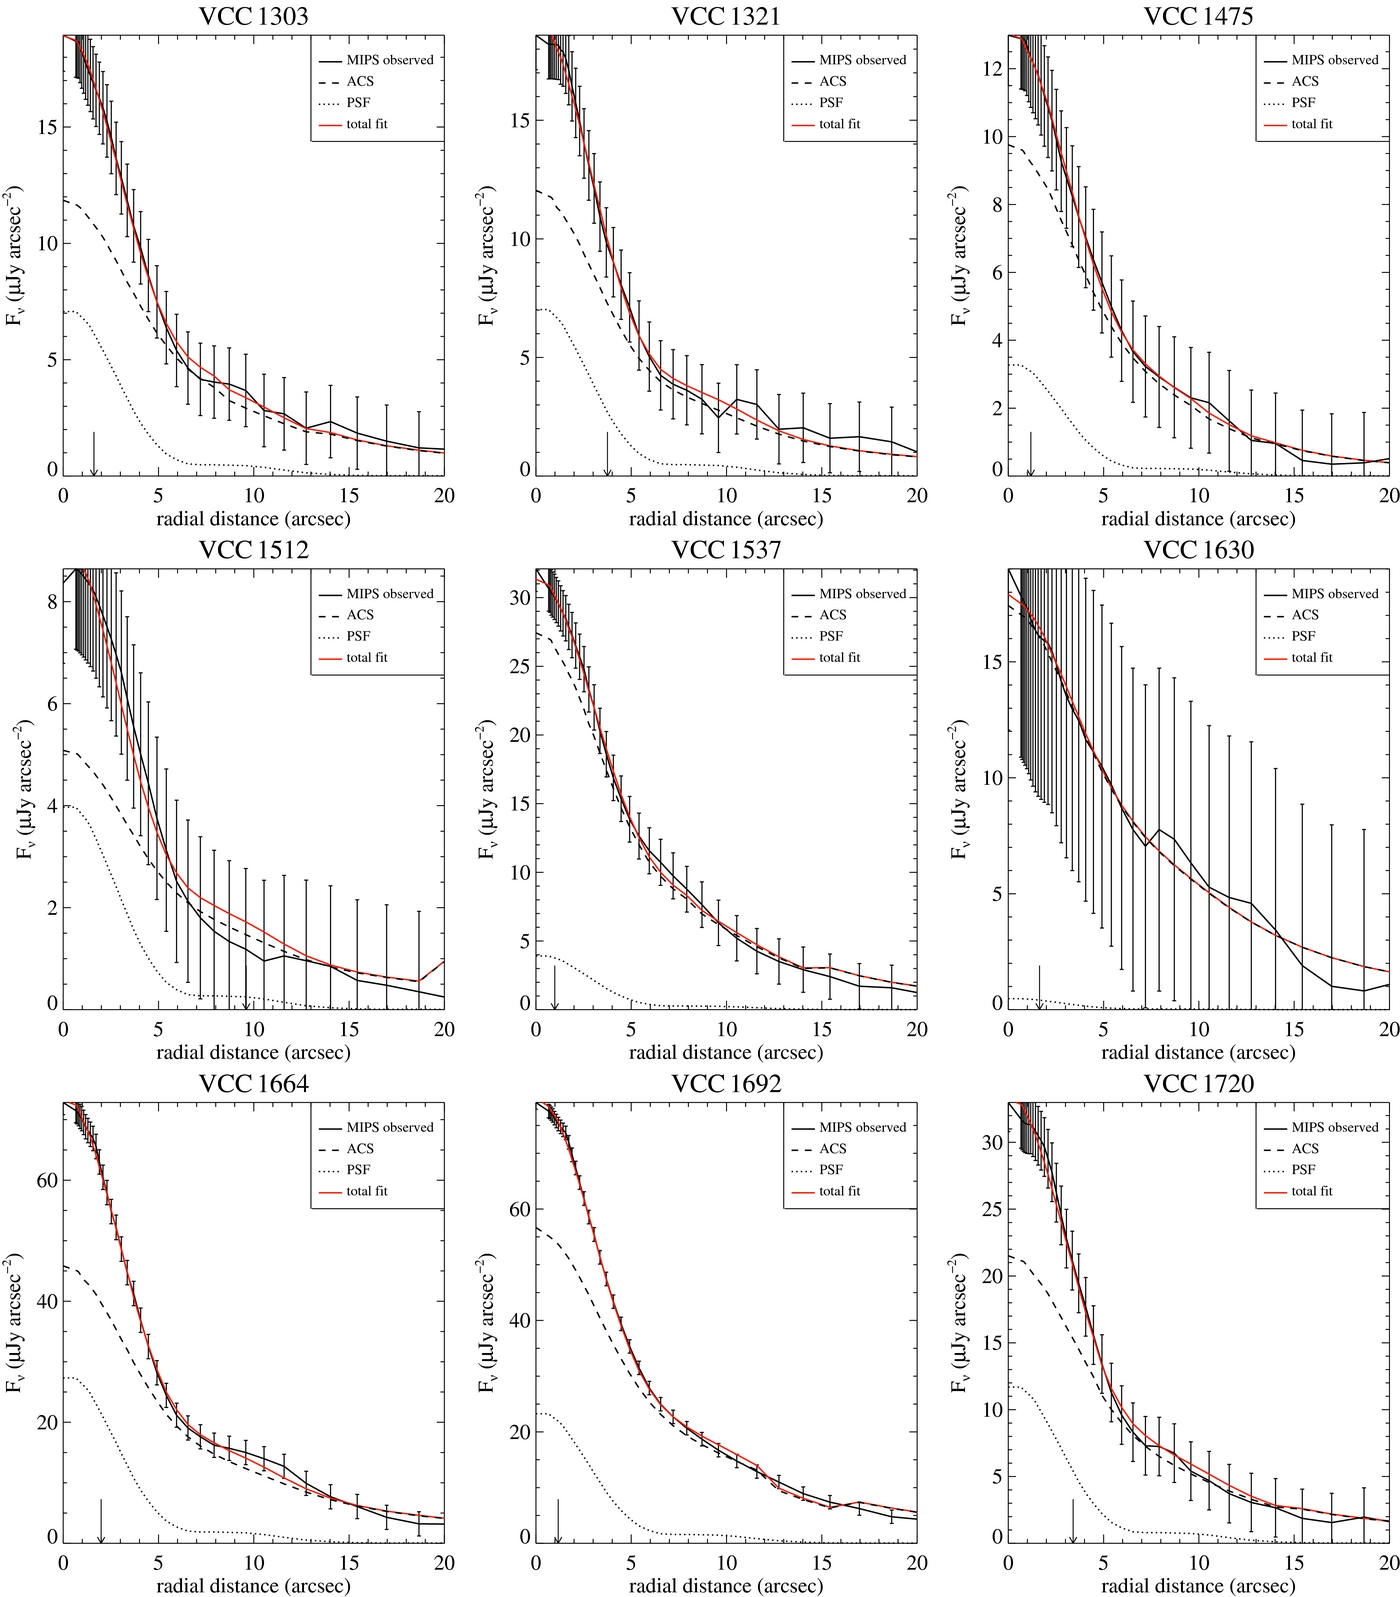
The observed MIR surface brightness profiles were then fitted as the linear combination of the radial profile of the MIR-PSF convolved optical images (i.e., stellar host galaxy contributions) and the radial profile of the average MIR PSF (i.e., a possible nuclear excess of unresolved dust). We show the radial profile fits in Figure 3. In most objects an additional PSF component is required to match the optical light profile with the MIR light profile. This nuclear MIR excess can be small (e.g., VCC 1537), of medium strength (e.g., VCC 0731), or quite substantial (e.g., VCC 2092). We will discuss the likely origin of this nuclear excess emission in Section 4.

Download figure:
Standard image High-resolution image
Download figure:
Standard image High-resolution image
Download figure:
Standard image High-resolution image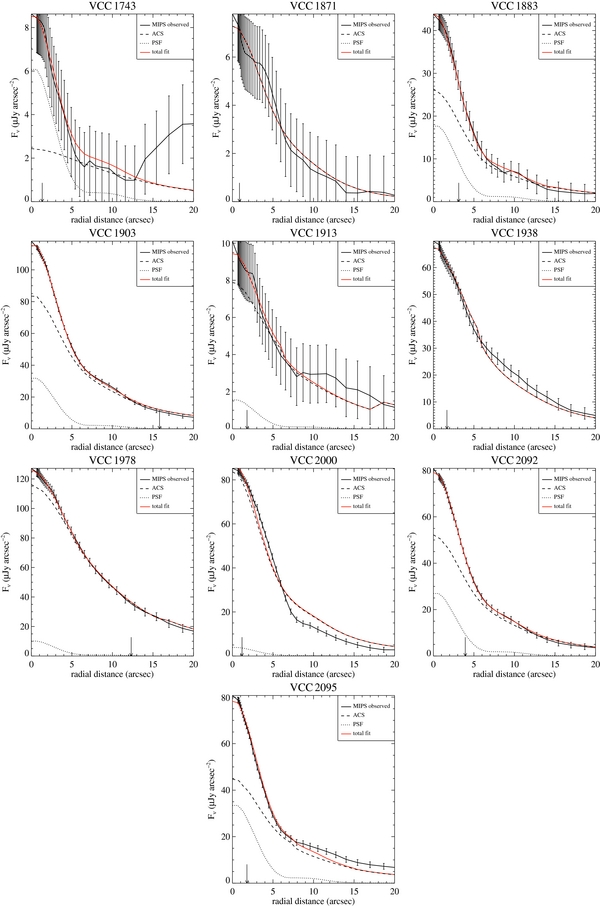
Figure 3. Radial profiles of the 37 detected VCC early-type galaxies without optical signatures for host dust. The black solid line shows the observed MIR emission. The dashed and the dotted lines represent the scaled radial profiles of the MIR-PSF convolved z-band emission and of the additional point-source contribution needed to fit the data, respectively. The red solid line gives the combination of these two components and corresponds to the total fit. The small arrow in each panel indicates Reff/8. Some radial profiles have larger errors due to the faintess of the sources. In the case of VCC 0778 and VCC 1743, the rise of the profile at radii > 10'' is due to a bright nearby star (see Figure 4).
Download figure:
Standard image High-resolution image3.4. Image Fitting
As a second step in our analysis we modeled the observed MIR images using GALFIT (Peng et al. 2002). As we have seen in the previous section, a two-component model is well suited to describe the MIR radial profiles of the early-type galaxies in our sample. Therefore, we chose to fit the two-dimensional images also with two components: one component representing the host contributions, plus a PSF component representing a possible nucleus. As tracers for the host galaxy light distribution we again used the HST z-band images, which have been modeled previously by Ferrarese et al. (2006). We fixed the shape parameters (e.g., effective radius, Sersic index, axis ratio, and orientation) describing the host component to those determined by Ferrarese et al. (2006), leaving the absolute scaling and centroid as the only free parameters. For the PSF component we provided the same average PSF used in Section 3.3. For the vast majority of objects this two-component model provided a very good description of the MIR images. In a few individual cases we added an additional PSF to account for nearby stars. In the cases of VCC 1125 and VCC 2095 an additional disk component was needed to archive a satisfactory model of the galaxy. The model for VCC 1938 was more complex and required a second Sersic profile and an additional (off nuclear) PSF. The MIPS 24 μm images and the residuals after subtracting the best-fit model for all 37 sources for which the fitting was performed are presented in Figure 4.

Download figure:
Standard image High-resolution image
Download figure:
Standard image High-resolution image
Download figure:
Standard image High-resolution image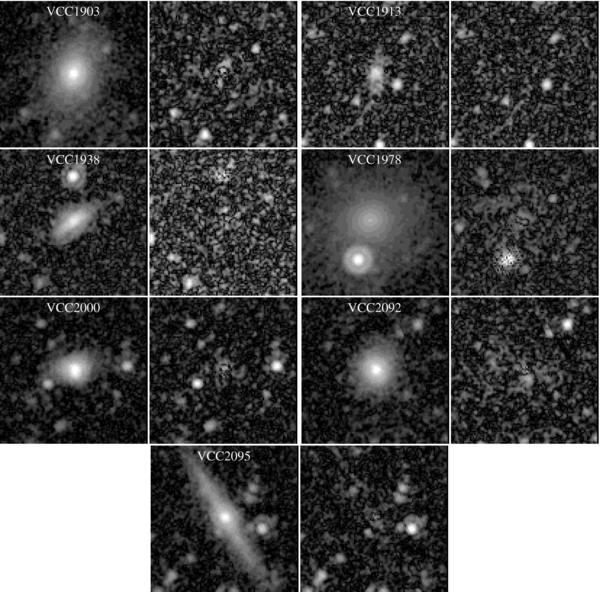
Figure 4. Observed 24 μm images of the 37 detected VCC early-type galaxies without optical signatures for host dust. To the right of the image we show the residual after subtracting the galaxy model (see Section 3.4). The images are 2 arcmin on the side and north is up with east to the left.
Download figure:
Standard image High-resolution imageThe significance of PSF components in the individual objects was tested using similar techniques as described earlier for the aperture photometry: we placed 1000 random apertures in the residual images (i.e., after subtraction of the best-fit model) and fitted the resulting distribution of flux values with a Gaussian. The value of three times the sigma of this Gaussian (including an aperture correction) was converted into an AB magnitude limit for the PSF component. For six sources the fitted PSF component was fainter than the 3σ magnitude limit for the respective image and, thus, the limiting magnitude was taken as the bright limit for the PSF component in these cases. For the remaining 31 objects the nuclear PSF component is significant at a >3σ level.
4. RESULTS AND DISCUSSION
4.1. Origin of the Nuclear MIR Ecxcess
The additional nuclear PSF required to fit the 24 μm radial profiles and images could be due to processes like star formation or low-luminosity AGN activity. However, radial variations in the age and/or metallicity of the stellar population can also result in a modified optical/MIR light ratio toward the center of the galaxies (e.g., Bressan et al. 1998; Piovan et al. 2003; Temi et al. 2005; Bressan et al. 2006). Since our method assumes that the stellar host component has a fixed z/24 μm ratio throughout the galaxy, part of the nuclear PSF component could in fact be due to a variation in the central properties of the stellar populations. In the following we will discuss such effects.
4.1.1. Residual Star Formation
One possible process to boost the MIR emission in the core would be residual star formation. In fact, the UV/optical colors of z < 0.1 early-type galaxies indicate that 10%–30% of them have experienced recent star formation with 1%–3% of the stellar mass having ages ⩽ 1–2 Gyr (e.g., Treu et al. 2005; Yi et al. 2005; Kaviraj et al. 2007). However, if this is the case for our objects, then the accompanying dust has to be located on very small scales (or be very diffuse) because it is not detected in the high-resolution ACS optical images.
This aspect can be explored further by studying MIR spectra of sufficient quality, which are available for 12 out of 37 objects in which no dust is visible from optical imaging. Genuinely quiescent early-type galaxies usually do not show aromatic features (like PAHs, strong indicators of recent activity) in their MIR spectra and have very low levels of FIR emission (e.g., Bressan et al. 2006; Temi et al. 2009; Clemens et al. 2010). This is consistent with the findings for the objects in our sample (e.g., Bressan et al. 2006; Bregman et al. 2006; Temi et al. 2009).
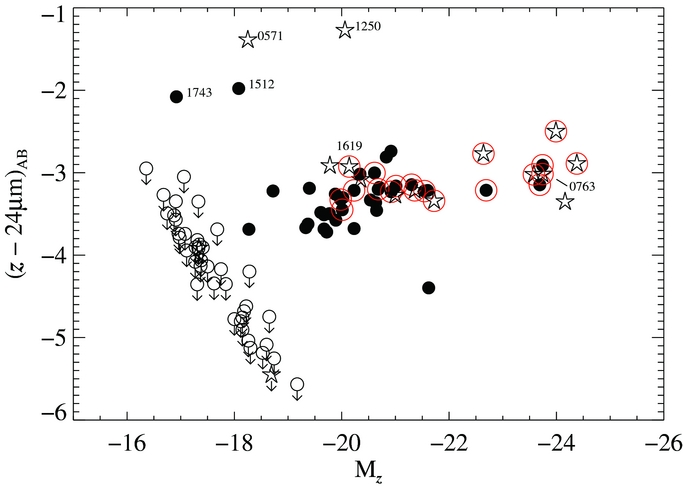
Clemens et al. (2009) report a number of "MIR excess" sources in their color–magnitude diagram (Ks−16 μm versus  , their Figure 3) of early-type galaxies, which they interpret as objects being younger (or rejuvenated). We find only a few sources showing significant offset from most other galaxies in our sample for a comparable diagram in z−24 μm versus Mz (Figure 5). From the four sources falling noticeably above the rest of the sample, two show dust in the optical images which possibly boosts the 24 μm emission.

Figure 5. Optical/IR color–magnitude relation for the sample objects. Solid circles represent objects without dust in the optical and open stars objects with dust visible in the optical. Open circles are MIR upper limits. Objects with MIR spectra are marked with red circles. Interestingly, two objects with MIR spectra show PAH emission (VCC 0763 and VCC 1619) but still fall onto the "sequence" defined by the MIR-detected sources. Note that the upper limits shown here are appropriate for point sources and not necessarily for resolved objects (see Section 3.1).
Download figure:
Standard image High-resolution imageWhile residual star formation may contribute some nuclear flux in a few individual objects, it appears unlikely to be responsible for the bulk of the nuclear MIR excess observed (to varying degrees) in almost all of our MIR-detected objects.
4.1.2. Stellar Age Gradients
The single stellar population (SSP) models of, e.g., Bressan et al. (1998) and Piovan et al. (2003), which include the effects of dust from AGB stars, predict a strong decline of the MIR emission with the age of the stellar populations. A younger stellar population in the centers of the galaxies would then translate into increased MIR emission. However, radial age gradients in early-type galaxies are usually small or negligible. This can be explored further on an individual basis using the results from the optical spectroscopic study of Spolaor et al. (2010), which has eight objects in common with our sample of MIR-detected sources. For this small number of objects we do not find any correlation between the strength of the nuclear MIR component (relative to the host magnitude) and age, metallicity, and/or the radial gradients thereof. If age gradients would play a significant role, we would expect that the sources showing strong age gradients also show stronger nuclear MIR excess, which is not observed. On the contrary, the three objects with the strongest age gradients (VCC 0828, VCC 1025, and VCC 1630) only have 3σ upper limits on the strength of the nuclear MIR component. The remaining five sources with measured age gradients show nuclear MIR emission at a level >3σ but the radial age gradients of the stellar population are flat within the errors. In particular, VCC 1297 shows a clear nuclear MIR excess which accounts for about 45% of the flux in the central 6'' but the galaxy has a flat radial age gradient. From these examples it appears that radial variations in the age of the stellar population are not the main driver of the nuclear MIR emission in these objects.
A similar result was obtained by Clemens et al. (2011) for some early-type galaxies in the Virgo Cluster in which they also find that the MIR light profiles are more centrally concentrated than the NIR or optical light profiles. Based on a near-to-mid-infrared color–magnitude diagram (Ks−16 μm versus  ) they demonstrate that age gradients are incompatible with the observed trends for lower mass objects to have smaller Ks−16 μm colors. We also see the same trends in our color–magnitude diagram using z−24 μm versus Mz (Figure 5).
4.1.3. Stellar Metallicity Gradients
Unlike age gradients, negative metallicity gradients are commonly reported for early-type galaxies (e.g., Mehlert et al. 2003; Sánchez-Blázquez et al. 2007; Spolaor et al. 2010; Pipino et al. 2010), but the SSP models mentioned above show only a mild dependence of the MIR emission on metallicity. In Figure 6, we present an optical/MIR color–color diagram which shows the colors predicted by the GRASIL SSP models (Silva et al. 1998; Bressan et al. 1998) for our filters in an age–metallicity grid. For most objects in our sample the host metallicities range from about solar to half-solar values. In addition, the coding of the symbols reveals the well-known mass–metallicity relation where more massive galaxies show higher (average) metallicities than less massive objects (e.g., Spolaor et al. 2010).

Figure 6. Color–color diagram for our sample galaxies. The g magnitudes were taken from the same reference as the z-magnitudes (Ferrarese et al. 2006). The MIR magnitude corresponds to the host (i.e., Sersic) component only. The dotted (age) and solid (metallicity) lines connect the colors expected for a representative set of SSP model SEDs taken from the GRASIL webpage (Silva et al. 1998). The symbols for the VCC objects have been color and size coded according to their stellar masses.
Download figure:
Standard image High-resolution imageWe can use these models to predict the color changes owing to metallicity gradients and compare them with the observed nuclear colors. Using the median metallicity gradient for the high-mass objects in Spolaor et al. (2010) of ![${\rm grad}\,[{\rm {\rm \textit {Z}}/{\rm \textit {H}}}]$](https://content.cld.iop.org/journals/0004-637X/744/2/152/revision1/apj412598ieqn3.gif) = −0.23 (and using their definition of the gradient), we estimate an increase of the metallicity Z by a factor of ∼1.5 between 15'' and 2'' (using the relation between [Z/H] and Z given in Cassisi & Salaris 1997). These radii were chosen for the calculation because at 15'' distance from the center we exclude any significant contributions from a nuclear PSF component and the colors are dominated by the host. At 2'' we are able to sample nuclear PSF emission (if present), while avoiding the very centers of the radial profiles, which are also not sampled by the optical spectra (Spolaor et al. 2010). For the models shown in Figure 6, an increase in metallicity by a factor of 1.5 results in a z−24 μm color change of about 0.3 mag in the metallicity range ∼0.008–0.02.
= −0.23 (and using their definition of the gradient), we estimate an increase of the metallicity Z by a factor of ∼1.5 between 15'' and 2'' (using the relation between [Z/H] and Z given in Cassisi & Salaris 1997). These radii were chosen for the calculation because at 15'' distance from the center we exclude any significant contributions from a nuclear PSF component and the colors are dominated by the host. At 2'' we are able to sample nuclear PSF emission (if present), while avoiding the very centers of the radial profiles, which are also not sampled by the optical spectra (Spolaor et al. 2010). For the models shown in Figure 6, an increase in metallicity by a factor of 1.5 results in a z−24 μm color change of about 0.3 mag in the metallicity range ∼0.008–0.02.
To estimate the observed nuclear color excess we use our radial profile fits presented in Section 3.3. The integration of the scaled z-band profile and the 24 μm profile in the inner 3'' in radius (which corresponds to the approximate size of the MIPS PSF at 24 μm) yields a measure of the color excess in the nucleus over the host galaxy z−24 μm color. The results are presented in Figure 7 in the form of a histogram of the nuclear color excess caused by the additional point source. In Table 2, we collect the fractional contribution of this additional nuclear point source to the flux within the inner 3'' radius. The histogram (Figure 7) reflects the impression from the radial profile plots and demonstrates that the nuclear MIR excess can change the nuclear colors significantly. The median of this (fairly broad) distribution falls close to the value we estimate from the models for a median metallicity gradient. Thus, the nuclear MIR excess for many of our objects with less prominent nuclear MIR PSFs is consistent with the metallicity gradient derived from optical observations. We emphasize that we only used a median value for the metallicity gradient to calculate the typical color change of about 0.3 mag. However, the large dispersion in measured metallicity gradients can in principle also explain the objects with more prominent nuclear MIR excess emission. At higher galaxy masses, metallicity gradients in a range of approximately 0.0 to −0.4 are observed (Spolaor et al. 2010, their Figure 4). This converts into a nuclear color change between zero, and ∼0.4 or up to a magnitude for lower metallicities (∼0.008) or higher metallicities (∼0.02), respectively, in the models shown in Figure 6. In addition, we see no dependency of the nuclear color excess on the stellar mass of the host galaxy.

Figure 7. Histogram of the nuclear color excess as determined from the radial profiles when integrating the inner 3'' (see the text). The dashed vertical line indicates the median value (0.3 mag).
Download figure:
Standard image High-resolution imageTable 2. AMUSE-Virgo III: Source Properties
| VCC | ID | d | log M* | log MBH | z | log LX |  |
mPSF | fPSF | F24 μm |
|---|---|---|---|---|---|---|---|---|---|---|
| (Mpc) | (M☉) | (M☉) | (mag) | (erg s−1) | (mag) | (mag) | (mJy) | |||
| (1) | (2) | (3) | (4) | (5) | (6) | (7) | (8) | (9) | (10) | (11) |
| 0009 | 53 | 17.14 | 9.7 | 7.20 | 12.43 | <38.15 | ... | ... | ... | <0.31 |
| 0021 | 73 | 16.50 | 9.0 | 6.70 | 13.74 | <38.11 | ... | ... | ... | <0.33 |
| 0033 | 70 | 15.07 | 8.9 | 6.60 | 13.93 | <38.25 | ... | ... | ... | <0.31 |
| 0140 | 58 | 16.37 | 9.4 | 7.00 | 12.86 | <38.13 | ... | ... | ... | ... |
| 0200 | 71 | 18.20 | 9.2 | 6.80 | 13.55 | <38.42 | ... | ... | ... | <0.30 |
| 0230 | 85 | 17.78 | 8.9 | 6.50 | 14.34 | <38.62 | ... | ... | ... | <0.31 |
| 0355 | 28 | 15.42 | 10.3 | 8.00 | 10.59 | 38.77 | ... | ... | ... | 12.4a |
| 0369 | 16 | 15.85 | 10.4 | 7.80 | 10.66 | 39.26 | 13.80 | 16.10 | 0.28 | 12.28 |
| 0437 | 68 | 17.14 | 9.6 | 7.20 | 12.52 | <38.17 | ... | ... | ... | <0.45 |
| 0538 | 90 | 22.91 | 8.9 | 6.50 | 14.74 | <38.41 | ... | ... | ... | <0.28 |
| 0543 | 63 | 15.70 | 9.4 | 4.10 | 12.83 | <38.27 | ... | ... | ... | <0.29 |
| 0571 | 72 | 23.77 | 9.4 | 7.10 | 13.63 | <38.46 | ... | ... | ... | 3.57 |
| 0575 | 54 | 22.08 | 10.8 | 6.60 | 10.10 | <38.39 | 14.52 | >18.02 | 0.40b | 5.87 |
| 0654 | 23 | 16.50 | 10.4 | 7.00 | 10.54 | <38.46 | ... | ... | ... | ... |
| 0685 | 21 | 16.50 | 10.6 | 8.20 | 10.09 | 39.14 | ... | ... | ... | 29.8a |
| 0698 | 49 | 18.71 | 10.0 | 6.40 | 11.69 | <38.44 | 15.47 | 18.04 | 0.05 | 2.58 |
| 0731 | 7 | 23.33 | 11.7 | 8.80 | 8.15 | 39.00 | 11.31 | 16.06 | 0.14 | 110.01 |
| 0751 | 88 | 15.78 | 9.4 | 6.70 | 13.12 | <38.29 | ... | ... | ... | ... |
| 0759 | 17 | 16.98 | 10.8 | 7.30 | 9.79 | <38.18 | ... | ... | ... | 13.6a |
| 0763 | 6 | 18.45 | 11.7 | 9.10 | 7.59 | 39.73 | ... | ... | ... | 66.6a |
| 0778 | 34 | 17.78 | 10.2 | 7.50 | 11.27 | 38.56 | 14.73 | 16.94 | 0.00c | 5.26 |
| 0784 | 32 | 15.85 | 10.3 | 6.80 | 10.77 | 38.62 | 14.55 | 17.06 | 0.23 | 6.04 |
| 0798 | 5 | 17.86 | 11.6 | 8.30 | 7.68 | <38.43 | ... | ... | ... | 52.4a |
| 0828 | 36 | 17.95 | 10.2 | 6.70 | 11.25 | <38.63 | 14.59 | >17.56 | 0.00b | 5.64 |
| 0856 | 57 | 16.83 | 9.5 | 4.50 | 12.91 | <38.16 | ... | ... | ... | <0.35 |
| 0881 | 4 | 16.83 | 11.9 | 8.60 | 6.97 | <38.64 | ... | ... | ... | 27.5a |
| 0944 | 24 | 16.00 | 10.4 | 7.20 | 10.39 | <38.53 | 13.80 | 17.18 | 0.28 | 13.85 |
| 1025 | 40 | 22.44 | 10.4 | 7.10 | 11.22 | 38.92 | 14.65 | 17.20 | 0.28 | 5.49 |
| 1030 | 19 | 16.75 | 10.8 | 7.90 | ... | 38.72 | ... | ... | ... | 111a |
| 1049 | 56 | 16.00 | 9.0 | 6.70 | 13.71 | <38.08 | ... | ... | ... | <0.35 |
| 1062 | 14 | 15.28 | 10.7 | 8.20 | 9.62 | 38.47 | 12.78 | 17.46 | 0.19 | 28.43 |
| 1075 | 81 | 16.14 | 9.2 | 6.60 | 13.54 | <38.12 | ... | ... | ... | <0.31 |
| 1087 | 60 | 16.67 | 9.6 | 4.80 | 12.51 | <38.15 | ... | ... | ... | <0.33 |
| 1125 | 44 | 16.50 | 9.9 | 7.00 | 11.69 | <38.46 | 16.11 | >18.11 | 0.29b | 4.22 |
| 1146 | 39 | 16.37 | 10.0 | 7.00 | 11.46 | <38.33 | 15.14 | 16.89 | 0.24 | 3.83 |
| 1154 | 13 | 16.07 | 10.9 | 7.90 | 9.31 | 39.03 | ... | ... | ... | 107a |
| 1178 | 46 | 15.85 | 9.9 | 7.20 | 11.67 | 38.66 | 15.50 | 17.47 | 0.41 | 2.66 |
| 1185 | 96 | 16.90 | 9.1 | 6.50 | 13.81 | <38.36 | ... | ... | ... | <0.29 |
| 1192 | 79 | 16.50 | 9.5 | 6.40 | 12.98 | <38.68 | ... | ... | ... | ... |
| 1199 | 93 | 16.50 | 9.0 | 6.30 | 14.18 | <38.14 | ... | ... | ... | ... |
| 1226 | 1 | 17.14 | 12.0 | 9.10 | 6.79 | <38.49 | ... | ... | ... | 747a |
| 1231 | 11 | 15.28 | 10.8 | 8.10 | 9.38 | 38.60 | 12.67 | 15.66 | 0.16 | 33.02 |
| 1242 | 31 | 15.56 | 10.3 | 6.60 | 10.73 | <38.50 | 14.19 | 15.68 | 0.14 | 9.60 |
| 1250 | 37 | 17.62 | 10.2 | 7.80 | 11.17 | 38.73 | ... | ... | ... | 35.7a |
| 1261 | 48 | 18.11 | 9.8 | 5.10 | 12.12 | <38.42 | ... | ... | ... | <0.31 |
| 1279 | 26 | 16.98 | 10.5 | 7.60 | 10.47 | <38.73 | 13.71 | 17.30 | 0.19 | 12.35 |
| 1283 | 47 | 17.38 | 10.1 | 6.30 | 11.53 | 38.54 | 15.06 | >17.96 | 0.22b | 3.67 |
| 1297 | 61 | 16.29 | 9.7 | 7.80 | 12.34 | 38.42 | 16.21 | 16.43 | 0.45 | 2.16 |
| 1303 | 41 | 16.75 | 10.1 | 6.90 | 11.35 | <38.15 | 14.96 | 17.36 | 0.36 | 4.18 |
| 1316 | 2 | 17.22 | 11.8 | 9.40 | 7.19 | 41.20 | ... | ... | ... | 154a |
| 1321 | 35 | 15.42 | 10.1 | 7.70 | 11.05 | <38.33 | 14.82 | 16.59 | 0.36 | 5.12 |
| 1327 | 43 | 18.28 | 10.1 | 7.60 | 11.53 | 38.68 | ... | ... | ... | 6.06 |
| 1355 | 59 | 16.90 | 9.4 | 6.90 | 13.02 | 38.58 | ... | ... | ... | <0.27 |
| 1407 | 91 | 16.75 | 9.1 | 6.60 | 13.74 | <38.35 | ... | ... | ... | <0.27 |
| 1422 | 50 | 15.35 | 9.6 | 7.20 | 12.24 | <38.08 | ... | ... | ... | <0.30 |
| 1431 | 64 | 16.14 | 9.5 | 6.90 | 12.86 | <38.66 | ... | ... | ... | <0.35 |
| 1440 | 84 | 16.00 | 9.2 | 6.70 | 13.40 | <38.27 | ... | ... | ... | <0.29 |
| 1475 | 45 | 16.60 | 9.9 | 6.60 | 11.73 | <38.34 | 15.48 | 17.75 | 0.24 | 2.62 |
| 1488 | 74 | 16.50 | 9.0 | 4.10 | 13.78 | <38.14 | ... | ... | ... | <0.20 |
| 1489 | 99 | 16.50 | 8.7 | 6.30 | 14.73 | <38.14 | ... | ... | ... | <0.31 |
| 1499 | 77 | 16.50 | 8.8 | 6.70 | 14.18 | 38.42 | ... | ... | ... | <0.29 |
| 1512 | 98 | 18.37 | 9.2 | 7.30 | 13.24 | <38.23 | 15.32 | 17.84 | 0.42 | 2.97 |
| 1528 | 65 | 16.29 | 9.3 | 6.90 | 13.06 | <38.13 | ... | ... | ... | <0.27 |
| 1535 | 8 | 16.50 | 11.0 | 9.20 | ... | <38.21 | ... | ... | ... | 267a |
| 1537 | 33 | 15.85 | 10.1 | 7.00 | 11.12 | 38.52 | 14.53 | 16.60 | 0.12 | 6.43 |
| 1539 | 95 | 16.90 | 8.9 | 6.60 | 14.06 | <38.16 | ... | ... | ... | <0.27 |
| 1545 | 78 | 16.83 | 9.2 | 6.80 | 13.45 | <38.16 | ... | ... | ... | <0.51 |
| 1619 | 29 | 15.49 | 10.2 | 6.60 | 10.81 | 38.68 | ... | ... | ... | 9.8a |
| 1627 | 83 | 15.63 | 9.1 | 6.60 | 13.64 | <38.34 | ... | ... | ... | <0.58 |
| 1630 | 38 | 16.14 | 10.2 | 6.80 | 11.03 | <38.29 | 14.57 | >17.13 | 0.03b | 5.91 |
| 1632 | 10 | 15.85 | 11.3 | 8.70 | 8.36 | 39.58 | ... | ... | ... | 58.5a |
| 1661 | 100 | 15.85 | 9.0 | 6.80 | 13.63 | <38.12 | ... | ... | ... | <0.29 |
| 1664 | 22 | 15.85 | 10.6 | 7.70 | 10.08 | 39.95 | 13.43 | 15.77 | 0.36 | 17.20 |
| 1692 | 18 | 17.06 | 10.6 | 8.00 | 10.15 | 38.45 | 13.36 | 16.72 | 0.28 | 17.19 |
| 1695 | 66 | 16.52 | 9.5 | 7.00 | 12.83 | <38.14 | ... | ... | ... | <0.26 |
| 1720 | 27 | 16.29 | 10.4 | 7.70 | 10.41 | <38.54 | 13.99 | 16.29 | 0.34 | 10.31 |
| 1743 | 94 | 17.62 | 8.9 | 6.50 | 14.31 | <38.20 | 16.75 | 17.76 | 0.69c | 1.01 |
| 1779 | 75 | 16.50 | 9.0 | 6.70 | 13.75 | <38.14 | ... | ... | ... | <0.31 |
| 1826 | 97 | 16.22 | 8.8 | 6.40 | 14.37 | <38.12 | ... | ... | ... | <0.32 |
| 1828 | 89 | 16.83 | 9.1 | 6.60 | 13.72 | <38.16 | ... | ... | ... | <0.32 |
| 1833 | 67 | 16.22 | 9.3 | 6.90 | 13.21 | <38.11 | ... | ... | ... | <0.34 |
| 1857 | 80 | 16.50 | 9.0 | 6.70 | 13.81 | <38.14 | ... | ... | ... | <0.30 |
| 1861 | 62 | 16.14 | 9.5 | 6.90 | 12.74 | <38.12 | ... | ... | ... | <0.26 |
| 1871 | 52 | 15.49 | 9.5 | 6.90 | 12.68 | <38.08 | 16.66 | 17.93 | 0.00 | 1.03 |
| 1883 | 30 | 16.60 | 10.4 | 6.80 | 10.40 | 38.35 | 13.68 | 16.20 | 0.39 | 13.45 |
| 1886 | 92 | 16.50 | 8.8 | 6.50 | 14.21 | <38.14 | ... | ... | ... | <0.29 |
| 1895 | 76 | 15.85 | 9.0 | 6.60 | 13.73 | <38.10 | ... | ... | ... | <0.27 |
| 1903 | 9 | 14.93 | 11.3 | 8.50 | 8.18 | 39.11 | 11.42 | 15.43 | 0.26 | 100.62 |
| 1910 | 55 | 16.07 | 9.5 | 7.00 | 12.75 | <38.30 | ... | ... | ... | <0.60 |
| 1913 | 42 | 17.38 | 10.1 | 6.50 | 11.48 | <38.46 | 15.24 | >18.05 | 0.17b | 3.13 |
| 1938 | 25 | 17.46 | 10.5 | 7.30 | 10.38 | 38.97 | 13.49 | 16.85 | 0.00 | 19.24 |
| 1948 | 82 | 16.50 | 8.8 | 6.40 | 14.34 | <38.14 | ... | ... | ... | <0.27 |
| 1978 | 3 | 17.30 | 11.7 | 9.40 | 7.45 | 39.05 | 10.37 | 15.62 | 0.07 | 342.10 |
| 1993 | 87 | 16.52 | 9.0 | 6.40 | 14.11 | <38.14 | ... | ... | ... | <0.25 |
| 2000 | 20 | 15.00 | 10.4 | 8.30 | 10.27 | 38.65 | 13.43 | 15.45 | 0.04 | 17.82 |
| 2019 | 69 | 17.06 | 9.4 | 6.90 | 13.01 | <38.17 | ... | ... | ... | <0.28 |
| 2048 | 51 | 16.50 | 9.6 | 6.30 | 12.56 | <38.12 | ... | ... | ... | <0.29 |
| 2050 | 86 | 15.78 | 9.0 | 6.50 | 13.88 | <38.10 | ... | ... | ... | <0.27 |
| 2092 | 15 | 16.14 | 10.9 | 8.20 | 9.44 | 38.59 | 12.73 | 15.60 | 0.33 | 31.47 |
| 2095 | 12 | 16.50 | 10.6 | 7.60 | 10.17 | 38.71 | 13.73 | 15.75 | 0.41 | 24.89 |
Notes. Columns: (1) VCC source name; (2) ACS/VCS target number; (3) distance; (4) stellar mass of the host galaxy, in M☉; (5) black hole mass; (6) HST/ACS z-band model AB magnitudes (taken from Ferrarese et al. 2006); (7) nuclear luminosity between 0.3 and 10 keV, corrected for absorption; (8) and (9) Sersic and PSF AB magnitudes from the image fitting at 24 μm; (10) fractional contribution of the additional PSF component to the nuclear MIR flux within the inner 3'' in radius as determined from the radial profiles; (11) total 24 μm flux, calculated as the sum of all the fitted components. Upper limits were determined as described in the text. Data for (3), (4), (5), and (7) taken from Gallo et al. (2010). aMIR aperture fluxes for dusty sources taken from Temi et al. (2009). bThese fractional contributions should be considered upper limits as their significance is low (see Figure 3) and the presence of a nuclear MIR excess is not supported from the two-dimensional images at a 3σ level. cSpurious result due to the influence of a strong, nearby point source (see Figures 3 and 4).
In order to explore further the distinction between color gradients and nuclear point sources, we re-fitted the MIR images treating the effective radius as a free parameter and not including a point source. The effective radii from the new fits turn out to be smaller on average than in the optical, which is not surprising given the additional MIR light in the center of the objects. The visual inspection of the residuals from these fits compared with the results from the fixed Reff (plus an additional nuclear PSF) fitting does not reveal significant differences in most cases. The model chi-square values for the fits also remain virtually unchanged. We conclude that the resolution of the data is insufficient to distinguish a true point source from a color gradient. However, the known stellar population gradients appear to be a more natural explanation than true MIR nuclear emission.
As mentioned in the previous section, our findings are consistent with those of Clemens et al. (2011) who also argue (based on a color–magnitude diagram) that the stronger concentration of the MIR light compared to the NIR or optical light is due to metallicity gradients.
4.2. Comparison with X-Ray Nuclei
Gallo et al. (2010) detect nuclear X-ray emission in 32 out of the 100 VCS objects (with a limiting 3σ flux limit of 3.7 × 1038 erg s−1 over 0.5–7 keV) and, after accounting for contamination from low-mass X-ray binaries, conclude that for most of them the X-ray emission originates from a low-luminosity AGN. SED studies find that weak-line galaxies and LINERs typically have (in νLν) MIR/X-ray ratios ∼1 (Ho 1999; Nemmen et al. 2010). For type-1 AGNs this ratio is typically around 5 (Elvis et al. 1994; Silva et al. 2004; Richards et al. 2006; LaMassa et al. 2009). For type-2 and increasingly obscured sources the ratio can go up to 103–4 (e.g., Silva et al. 2004; Zakamska et al. 2008; LaMassa et al. 2009).
In Figure 8, we compare the nuclear X-ray luminosity of the MIR-detected sources with the luminosity of the 24 μm PSF component. The left panels shows that for almost all the sources the MIR component is more luminous than the X-ray emission by a factor of ∼5–10. Assuming that both originate from nuclear activity, this ratio would require an SED typical of largely unabsorbed (or only very mildly absorbed) luminous AGNs. In contrast, allowing for a (possibly dominating) contribution of the stellar population to the nuclear MIR excess (see Section 4.1.3) would move the objects closer to the 1:1 line which is expected for low-luminosity AGNs. In addition, we cannot identify any correlation between the nuclear color excess and the X-ray luminosity of the sources. Thus, the observed MIR/X-ray ratio adds further circumstantial evidence in favor of metallicity gradients as the dominant contribution to the excess of unresolved MIR emission.

Figure 8. Nuclear X-ray luminosity (0.3–10 keV) plotted versus the luminosity of the PSF component at 24 μm (left) and after both measures have been normalized to the Eddington luminosity of the source (right). Filled symbols represent X-ray-detected objects while open symbols identify the X-ray non-detections. Only the 77 sources with 24 μm observations and no optical dust are shown. The objects circled in red indicate detections of compact radio emission at 8.4 GHz (Capetti et al. 2009). All other objects are either undetected at cm wavelengths or were not observed. Among the MIR-detected objects, only VCC 1512 and VCC 1743 were not observed at radio wavelengths. The hashed region in the left panel shows the typical MIR/X-ray luminosity ratio for unobscured type-1 AGNs (Silva et al. 2004; LaMassa et al. 2009), while the arrows indicate the direction in which this ratio changes with increasing obscuration. The 1:1 relation is typical for low-luminosity AGNs.
Download figure:
Standard image High-resolution image
More robustly, however, the observed MIR/X-ray ratio points to an important conclusion. There are no heavily obscured AGNs lurking at the center of these Virgo early-type galaxies which would exhibit large MIR/X-ray ratios. The black holes found by our survey in the X-rays have truly low bolometric Eddington ratios arising from low accretion rates and/or highly radiatively inefficient accretion.
5. SUMMARY
We presented MIR imaging at 24 μm of 95 early-type galaxies in the VCS, 53 of which are detected. Of these, 16 show evidence for dust from optical images. The radial profiles and two-dimensional images of the remaining 37 detected sources were modeled as a combination of a convolved optical z-band images and an observed PSF. Our findings can be summarized as follows.
- 1.Virtually all the sources show unresolved excess MIR emission in their central regions compared to the optical light profiles of up to ∼0.6 mag at 24 μm.
- 2.Star formation or radial stellar age gradients do not provide a convincing explanation for the MIR excess in the majority of the sources.
- 3.Negative radial metallicity gradients seem to be a likely and natural explanation of the nuclear MIR emission for the vast majority of the sources. The typical observed metallicity gradients of early-type galaxies can account for the nuclear color change we observe for our objects.
- 4.A comparison of the observed MIR excess with X-ray nuclear emission reveals that the level of excess emission is higher than expected for low-luminosity AGNs, and would require SEDs more typical of quasars or moderately obscured but intrinsically luminous AGNs. This is no longer the case once the stellar populations are taken into account.
- 5.Highly obscured nuclear activity is largely ruled out.
- 6.The black holes found by our survey in the X-rays have truly low bolometric Eddington ratios arising from low accretion rates and/or highly radiatively inefficient accretion.
Support for this work was provided by NASA through Chandra Award no. 08900784 (C.L. and T.T.) and 11112A (B.P.M.), issued by the Chandra X-ray Observatory Center. T.T. acknowledges support from the Packard Foundation through a Packard Research Fellowship. J.H.W. acknowledges support by the Basic Science Research Program through the National Research Foundation of Korea funded by the Ministry of Education, Science and Technology (2010-0021558). We thank the referee for a constructive report which helped to improve the paper.
Facilities: Spitzer - Spitzer Space Telescope satellite, HST (ACS) - Hubble Space Telescope satellite, CXO - Chandra X-ray Observatory satellite