Abstract
Free full text

Analyses of 123 Peripheral Human Immune Cell Subsets: Defining Differences with Age and between Healthy Donors and Cancer Patients Not Detected in Analysis of Standard Immune Cell Types
Abstract
Recent advances in human immunology have led to the identification of novel immune cell subsets and the biological function of many of these subsets has now been identified. The recent US Food and Drug Administration approval of several immunotherapeutics for the treatment of a variety of cancer types and the results of ongoing immunotherapy clinical studies requires a more thorough interrogation of the immune system. We report here the use of flow cytometry-based analyses to identify 123 immune cell subsets of peripheral blood mononuclear cells. The use of these panels defines multiple differences in younger (< 40 years) vs. older (≥ 40 years) individuals and between aged-matched apparently healthy individuals and metastatic cancer patients, aspects not seen in the analysis of the following standard immune cell types: CD8, CD4, natural killer, natural killer-T, regulatory T, myeloid derived suppressor cells, conventional dendritic cells (DCs), plasmacytoid DCs and B cells. The use of these panels identifying 123 immune cell subsets may aid in the identification of patients who may benefit from immunotherapy, either prior to therapy or early in the immunotherapeutic regimen, for the treatment of cancer or other chronic or infectious diseases.
1. Introduction
With the recent US Food and Drug Administration approvals of immunotherapeutics such as the checkpoint inhibitor anti-cytotoxic T lymphocyte-associated protein-4 (CTLA-4) and anti-programmed cell death-1 (PD-1)/programmed cell death ligand-1 (PD-L1) monoclonal antibodies (MAbs), and the sipuleucel-T prostate cancer vaccine, as well as results emerging from ongoing clinical studies with other immunotherapeutics, immunotherapy is emerging as a modality for many cancer types and stages. It has long been believed that an individual's immune system can play a role in both the development and control of cancer. It is known that the tumour itself can produce a spectrum of molecules such as immunomodulating cytokines, which can alter the patient's immune system. [1] Moreover, the incidence rates for many cancers increase with age and prior studies have shown that the immune system in older individuals (usually ≥ 65 years) differs from that of younger individuals. [2, 3]
Most prior studies have evaluated changes in an individual's immune system by quantifying so-called “standard parental immune cell types” in the periphery such as CD4, CD8, regulatory T cells (Tregs), B cells, natural killer (NK) cells, NK-T cells, conventional dendritic cells (cDCs) and plasmacytoid DCs (pDCs), and myeloid derived suppressor cells (MDSCs). Recent advances in cellular immunology have identified numerous subsets within each of the above immune cell types via the identification of new markers on immune cells and the use of polychromatic flow cytometry; prior studies have also identified the function(s) of many of these immune cell subsets. [4, 5]
In the studies reported here, we employed MAbs directed against immune cell markers and multi-laser flow cytometry analyses to identify 123 unique immune cell subsets in the peripheral blood of individuals. Since the incidence of cancer rises sharply at the age of 40 and more cancers are being seen recently in younger individuals [6, 7], we have investigated whether changes exist in peripheral immune cell subsets between apparently healthy individuals < 40 and those ≥ 40 years of age; several immune cell subsets were found to be statistically different between these two age groups. We also found that numerous peripheral immune cell subsets can be differentiated between age-matched healthy individuals and patients with a range of advanced human carcinomas. Moreover, we have identified differences among immune cell subsets expressing molecules on their surface that are the targets of existing checkpoint inhibitor therapies such as CTLA-4, PD-1 and PD-L1, as well as other potential targets for which immunotherapies are being developed. To further investigate the differences in peripheral immune cell subsets between healthy donors and advanced cancer patients, microarray analysis was performed on an additional small cohort of healthy donors and cancer patients. While gene pathway analysis demonstrated the regulation of multiple pathways previously associated with cancer, several genes implicated in the regulation of immune cells, including MDSCs and B cells, were also identified as differentially expressed between advanced cancer patients and healthy donors, corroborating the flow cytometry analysis.
2. Materials and Methods
2.1 Healthy donors and cancer patients
The flow cytometry analysis included 11 healthy donors under the age of 40, 15 healthy donors over the age of 40 and 30 patients with a variety of metastatic solid tumours over the age of 40. The median age of the healthy donor group < age 40 was 26 (range 18–31), with six males and five females. The median age of the healthy donor group > age 40 was 56 (range 46–78), with 12 males and three females. Peripheral blood mononuclear cells (PBMCs) from the healthy donors were obtained from the NIH Clinical Center Blood Bank (NCT00001846), as previously described. [8] The median age of the cancer patients was 64 (range 42–77), with 17 males and 13 females. The cancer patients all had metastatic solid tumours and were enrolled in a Phase I clinical trial (NCT01772004), with PBMCs that were examined in this study obtained prior to the initiation of therapy. The National Cancer Institute Institutional Review Board approved the trial procedures and informed consent was obtained in accordance with the Declaration of Helsinki. Patients had 13 different types of cancer including adrenocortical (n=2), breast (n=3), chordoma (n=1), gastrointestinal (GI) (n=6), lung (n=1), medullary thyroid (n=1), mesothelioma (n=3), neuroendocrine (n=1), ovarian (n=1), pancreatic (n=6), prostate (n=1), renal cell (n=3) and spindle cell (n=1) cancer, and the median number of prior anti-cancer therapies was 3 (range 1–15).
In an additional cohort of samples assessed by microarray, PBMCs were obtained from five healthy donors (median age: 54, three male, two female) from the NIH Clinical Center Blood Bank, as well as four patients with advanced GI cancer (median age: 56.5, two male, two female) enrolled in a Phase I study at the NCI (NCT00088413) [9]; PBMCs used in this study were isolated prior to treatment.
2.2 Antibodies and flow cytometry
Multicolour flow cytometry was performed on frozen PBMCs as previously described. [10] One vial of PBMCs was thawed per cancer patient or healthy donor. Cells were counted and plated in five different wells per subject in a 96-well plate with one million PBMCs per well. Each of the five wells was used to stain a different panel with a maximum of 11 colours per panel in each well. Staining was performed using five panels (Supplemental Table 1) to identify markers involved in PD-1 signalling (panel 1) and in subsets of CD4+ T cells, CD8+ T cells and B cells (panel 2), Tregs (panel 3), NKs, NK-T, cDCs and pDCs (panel 4), and MDSCs (panel 5). Using the outlined gating strategy (Figure 1), these five staining panels with up to 11 antibodies per panel identified a total of 123 peripheral immune cell subsets (Supplemental Table 2), which included nine parental immune cell types and 114 subsets related to maturation and function within the parental types. Optimal amounts of antibodies for staining were determined by titration experiments. Briefly, one million PBMCs per test were incubated for 15 minutes at 4°C with 2 μL of human TruStain FcX (Biolegend, San Diego, CA) and Live Dead Fixable Stain Blue (Invitrogen, Waltham, MA). Surface antibodies were added for 30 minutes at 4° C. Cells were then washed, fixed and permeabilized using the Intracellular Fixation and Permeabilization Buffer Set (eBioscience, San Diego, CA) and stained with intracellular antibodies for 30 minutes at room temperature. Samples were acquired on a BD LSRII flow cytometer (BD Biosciences, San Jose, CA) equipped with four lasers (UV, violet, blue and red; configuration and filter sets of LSR II listed in Supplemental Figure 1) and analysed using FlowJo V9.7 for Macintosh (Treestar, Ashland, OR). The gating strategy identified 123 peripheral immune cell subsets from the five staining panels that each contained up to 11 markers per panel (Figure 1), with non-viable cells excluded and negative gates set based on fluorescence minus one controls. All values were reported as a percentage (%) of PBMCs in order to help eliminate the bias that could occur in the smaller populations with fluctuations in leukocyte subpopulations. [11]
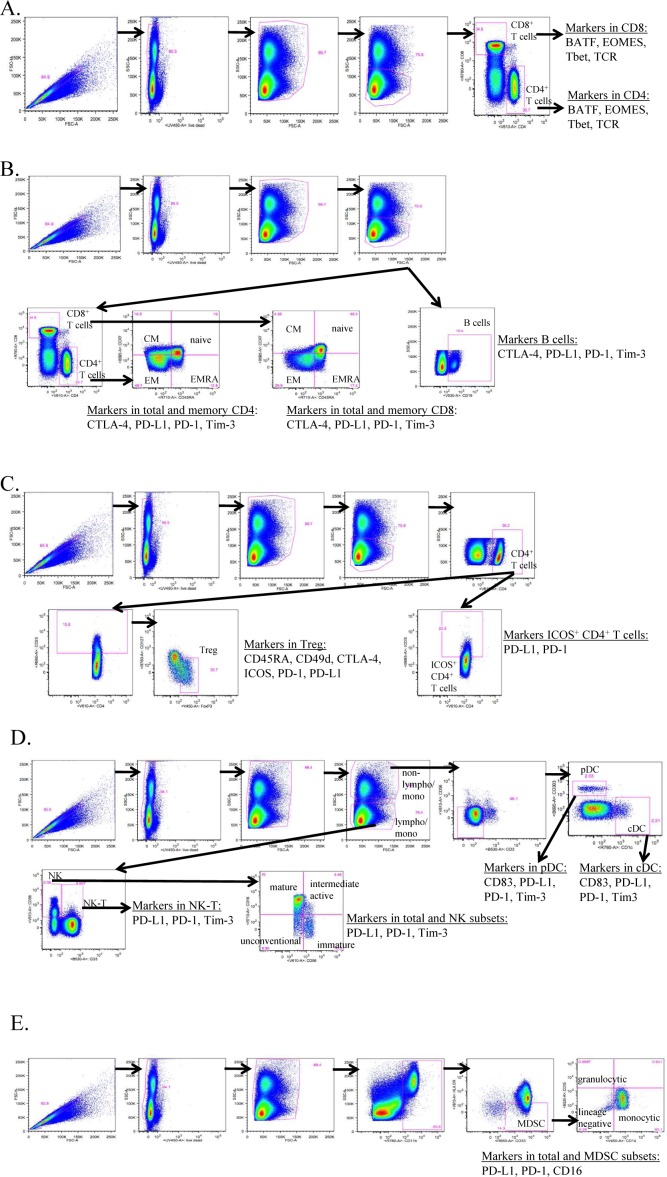
Gating strategy of five staining panels to identity 123 peripheral immune cell subsets by flow cytometry. One vial of frozen peripheral blood mononuclear cells (PBMCs) per subject was thawed and then stained using 30 unique markers in five separate immune flow cytometry panels to identify a total of 123 peripheral immune cell subsets. Each panel contained up to 11 markers. Panel 1 (A) identified markers in CD8+ and CD4+ T cells involved in PD-1 signalling. Panel 2 (B) identified the parental cell types of CD4+ and CD8+ T cells and B cells, as well as markers involved in function and maturation. Panel 3 (C) identified ICOS+ CD4+ T cells and the parental cell type of Tregs, as well as markers involved in function. Panel 4 (D) identified the parental cell types of NK, NK-T, cDC and pDC, as well as markers involved in maturation and function. Panel 5 (E) identified the parental cell type of MDSC, as well as markers involved in maturation and function. Samples were collected on an LSR II flow cytometer equipped with UV, red, blue and violet lasers, and analysed using FlowJo, with gating set using fluorescence minus one controls.
Table 1.
Flow cytometry analysis of parental immune cell types in PBMCs using 30 unique markers to identify 123 subsets
|
Frozen PBMCs were thawed then stained using 30 unique markers in 5 immune flow cytometry panels to identify a total of 123 peripheral immune cell subsets. Samples were collected on an LSR II flow cytometer equipped with U V, red, blue, and violet lasers, and analyzed using FlowJo with gating set using fluorescence minus one controls. Nine standard immune cell types as well as 114 additional subsets relating to maturation and function were compared between healthy donors under and over the age of 40, and between patients with metastatic cancer and age-matched healthy donors.
——–
BATF, basic leucine zipper transcription factor ATF-like; CTLA-4, cytotoxic T lymphocyte-associated protein-4; EOMES, eomesodermin; FoxP3, forkhead box P3; HLA, human leukocyte antigen; ICOS, inducible T cell co-stimulator; PBMCs, peripheral blood mononuclear cells; PD-1, programmed cell death-1; PD-L1, programmed cell death ligand-1; Tbet, T box expressed in T cells; TCR, T cell receptor; Tim-3, T cell immunoglobulin and mucin domain-3.
Table 2.
Standard parental immune cell types in healthy donors under and over age 40
| Immune cell type | Age <40 | Age >40 | P value | Direction of age >40 |
|---|---|---|---|---|
| CD8+ T cells | 19 | 8 | 0.0009 | ↓ |
| NK | 5 | 10 | 0.0040 | ↑ |
| CD4+ T cells | 34 | 29 | 0.8975 | = |
| Tregs | 1.4 | 1.5 | 0.9999 | = |
| B cells | 11 | 16 | 0.1645 | = |
| NK-T | 2.4 | 1.3 | 0.4116 | = |
| cDC | 0.4 | 0.3 | 0.9999 | = |
| pDC | 0.2 | 0.2 | 0.8975 | = |
| MDSC | 5 | 4 | 0.9999 | = |
A total of 9 standard parental immune cell types were analyzed. Values are displayed as median % of PBMCs. P-value was calculated with the Mann Whitney test with Holm adjustment made for multiple comparisons using the number of standard immune cell types with frequency above 0.01% of PBMCs (n=9). Differences were defined as subsets with an adjusted p<0.05, medians at least 50% different, and frequency above 0.01% of PBMCs.
——–
cDC, conventional dendritic cells; MDSC, myeloid derived suppressor cells; NK, natural killer; PBMCs, peripheral blood mononuclear cells; pDC, plasmacytoid DC; Tregs, regulatory T cells.
2.3 Microarray
Total RNA was isolated from PBMCs using the Qiagen RNAeasy Plus minikit (Valencia, CA) according to the manufacturer's instructions and quality-checked on an Agilent Bioanalyzer (Santa Clara, CA). All samples used for microarray analysis had an RNA integrity number >9; 100 ng of RNA was reverse transcribed and amplified using an Ambion WT expression kit (Austin, TX), following the manufacturer's suggested protocols. Sense strand cDNA was fragmented and labelled using an Affymetrix WT terminal labelling kit (Santa Clara, CA). Four replicates of each group were hybridized to Affymetrix human Gene ST 2.0 GeneChip in an Affymetrix hybridization oven at 45°C, at 60rpm for 16 hours. Washing and staining were performed on an Affymetrix Fluidics Station 450 and scanned on an Affymetrix GeneChip Scanner 3000. Data were collected using Affymetrix AGCC software.
2.4 Statistic
Statistical analyses for flow cytometry data were performed using GraphPad Prism 6 (GraphPad Software, La Jolla, CA). All p-values were calculated using the Mann-Whitney test. In view of the large number of tests performed, p-values were adjusted using Holm's method (step-down Bonferroni) to account for the increased probability of Type I errors (false positive) that occur when multiple outcome measures are assessed. [12] Adjustment was made for the number of subsets with a frequency above 0.01% of PBMCs (n=9 for standard subsets, n=29 for subsets in CD4+ T cells, n=25 for CD8+ T cells, n=5 for Tregs, n=14 for NK cells, n=3 for NK-T cells, n=4 for B cells, n=2 for cDCs, n=3 for pDCs and n=15 for MDSCs). Subsets with a potentially biologically relevant change were defined as subsets with an adjusted p<0.05, the median of groups showing a > 50% difference, and a frequency > 0.01% of PBMCs.
Statistical and clustering analysis for the microarray experiment was performed with Partek Genomics Suite software (St. Louis, MO) and employing a RMA normalization algorithm. Differentially expressed genes were identified via ANOVA analysis. Genes that were up- or down-regulated more than 1.5-fold and with a p<0.05 were considered significant. Significant genes were analysed for the enrichment for pathways using Ingenuity Pathway Analysis software (Redwood City, CA).
3. Results
3.1 Differences in peripheral immune cell subsets with age in healthy donors
Using multiparameter flow cytometry, a total of 123 peripheral immune cell subsets were examined, which included the nine standard parental immune cell types – CD4+ and CD8+ T cells, Tregs, B cells, NK and NK-T cells, cDCs, pDCs and MDSCs – and 114 subsets of these cell types relating to maturation and function (Table 1). As the risk of cancer rises at age 40 [6, 7], donors were separated into younger and older groups, using this age as a cut-off. PBMCs were assayed from 11 healthy donors under the age of 40 and 15 healthy donors over the age of 40 (Figure 2A). Compared to the younger group, the older group had a significantly lower absolute lymphocyte count (ALC) (p=0.0032, Figure 2B). No statistical differences were evident when subsets were examined by age decade within the groups or by gender (data not shown).
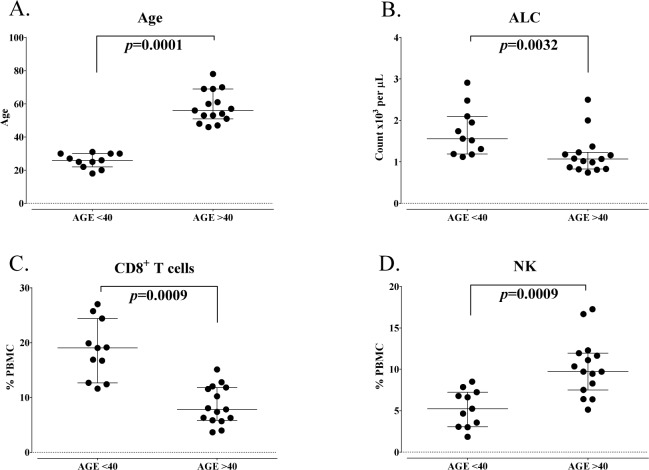
Standard parental immune cell types in healthy donors under and over the age of 40. A: Healthy donors included in this analysis were separated as younger (age less than 40 years, n=11) and older (age greater than 40 years, n=15). B: Absolute lymphocyte count (ALC) of healthy donors under and over age 40. Graphs display median age or ALC with 25–75 percentiles. P-value was calculated using the Mann-Whitney test. CD8+ T cells (C) and natural killer (NK) cells (D) were different between healthy donors under and over age 40, as defined by an adjusted p<0.05, the median of groups showing a > 50% difference, and a frequency above 0.01% of peripheral blood mononuclear cells (PBMCs). Graphs display median frequency as a percentage of PBMCs with 25–75 percentiles. P-value was calculated using the Mann-Whitney test and with Holm adjustment made for multiple comparisons using the number of standard immune cell types with a frequency above 0.01% of PBMCs (n=9).
Differences in peripheral immune cell subsets were identified as significant and relevant if the adjusted Holm p-value was < 0.05, if medians of the group were at least 50% different and if the subset had a frequency of above 0.01% of PBMCs. Using these criteria, of the nine standard immune cell types, seven were unchanged and two cell types (CD8+ T cells, NK cells) were significantly changed with age (Table 2). Healthy donors over the age of 40 had on average 60% less total CD8+ T cells compared to those under the age of 40 (median % of PBMCs = 8 in old and 19 in young, p=0.0009, Figure 2C). Older healthy donors, on the other hand, had on average 85% more NK cells compared to younger healthy donors (median % of PBMCs = 10 in older and 5 in younger, p=0.0009, Figure 2D).
Of the 114 subsets relating to maturation and function within the standard cell types, 12 subsets were significantly different in older healthy donors compared to younger individuals (Table 3A). The most notable decreases in subsets relating to maturation and function in healthy donors over age 40 were evident in CD8+ T cell subsets; these included on average 70% fewer PD-L1+CD8+ T cells (p=0.0080, Figure 3A), 55% fewer CTLA-4+CD8+ T cells (p=0.0480, Figure 3B) and 60% fewer T cell immunoglobulin and mucin domain-3 (Tim-3)+CD8+ T cells (p=0.0272, Figure 3C). The markers PD-L1, CTLA-4 and Tim-3 are inhibitory receptors involved in immune checkpoint pathways and are increased upon T cell activation and differentiation. [13] Donors over 40 also had decreases in subsets relating to maturation, with lower frequencies of naïve (p=0.0025, Figure 3D) and central memory (CM) (p=0.0063, Figure 3E) CD8+ T cells. The only subset that showed a trend (p=0.038) of increase in healthy donors over age 40 was Tim-3+ B cells (Figure 3F). Tim-3 is an inhibitory marker often examined in T cells and NK cells, and only rarely described in minor populations of B cells [14]. Total B cells were unchanged.
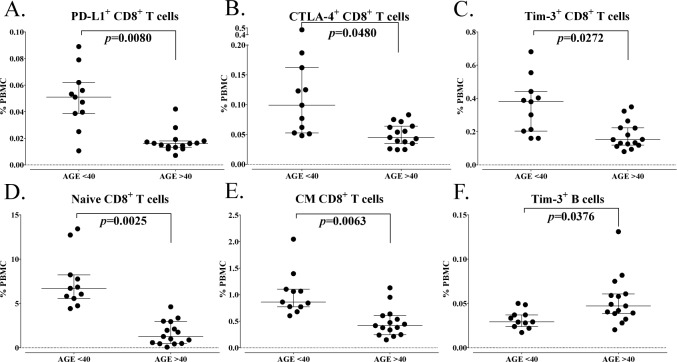
Differences in immune cell subsets related to maturation and function between healthy donors under and over the age of 40. A total of 114 immune cell subsets were analysed relating to maturation and function within the standard subsets. Subsets were considered different if a subset had an adjusted p<0.05, the median of groups showing a > 50% difference, and a frequency above 0.01% for peripheral blood mononuclear cells (PBMCs). A-F: Representative graphs are shown for notable subsets related to activation and maturation, with differences between healthy donors under and over the age of 40 indicated. Graphs display median frequency as a percentage of PBMCs with 25–75 percentiles. P-value was calculated using the Mann-Whitney test, with Holm adjustment made for multiple comparisons using the number of subsets within each standard subset with a frequency above 0.01% of PBMCs (n=29 for CD4+ T cells, 25 for CD8+ T cells, 5 for Tregs, 14 for natural killer cells (NK), 3 for NK-T cells, 4 for B cells, 2 for conventional dendritic cells (cDCs), 3 for plasmacytoid DCs (pDCs) and 15 for myeloid derived suppressor cells (MDSCs)).
Table 3.
Differences in immune cell subsets relating to maturation and function between healthy donors under and over age 40
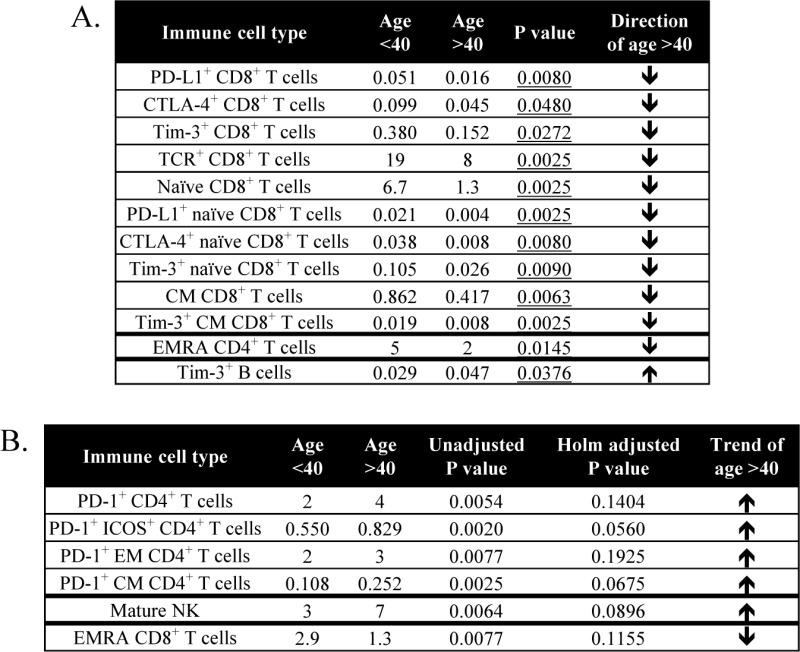 |
A total of 114 subsets were analyzed relating to maturation and function within the standard subsets. A: Table displays subsets that were different in healthy donors under and over age 40, as defined by an adjusted p<0.05, medians at least 50% different, and frequency above 0.01% of PBMCs. Values represent median % of PBMCs, and p-value was calculated with the Mann Whitney test with Holm adjustment made for multiple comparisons using the number of subsets within each standard subset with frequency above 0.01% of PBMCs (n=29 for CD4+ T cells, 25 for CD8+ T cells, 5 for Tregs, 14 for NK cells, 3 for NK-T cells, 4 for B cells, 2 for cDCs, 3 for pDCs, 15 for MDSCs). B: Table displays subsets with notable trends between healthy donors under and over age 40, as defined by unadjusted p< 0.01, medians at least 50% different, and frequency above 0.01% of PBMCs. Values represent median % of PBMCs.
——–
cDC, conventional dendritic cells; CM, central memory; CTLA-4, cytotoxic T lymphocyte-associated protein-4; EM, effector memory; EMRA, terminally differentiated effector memory; ICOS, inducible T cell co-stimulator; MDSC, myeloid derived suppressor cells; NK, natural killer; PBMCs, peripheral blood mononuclear cells; pDC, plasmacytoid DC; PD-1, programmed cell death-1; PD-L1, programmed cell death ligand-1; TCR, T cell receptor; Tim-3, T cell immunoglobulin and mucin domain-3; Tregs, regulatory T cells.
Other immune cell subsets also showed trends in differences with age; trends were defined as those subsets having an unadjusted p-value < 0.01 (without a significant Holm adjusted p-value), as well as at least a 50% difference in medians and a frequency of PBMCs above 0.01%. Using these criteria, six additional subsets were found to have trends in differences with age (Table 3B). While total CD4+ T cells did not change, the most notable trends were evident in several CD4+ T cell subsets expressing PD-1, which is an inhibitory receptor that is increased upon T cell activation [13]. Healthy donors over the age of 40 had higher levels of PD-1 in total CD4+ T cells, inducible T cell co-stimulator (ICOS)+CD4+ T cells, effector memory (EM) CD4+ T cells and CM CD4+ T cells (Table 3B). Thus, healthy donors over age 40 had lower levels of activation markers on CD8+ T cells, varied maturation status of CD8+ T cells and trends of higher activation markers in CD4+ T cells compared to healthy donors under age 40.
3.2 Differences in peripheral immune cell subsets between patients with carcinoma and age-matched healthy donors
PBMCs were evaluated for 30 patients with different types of metastatic solid tumours and 15 age-matched healthy donors, all over the age of 40 (p=0.1550, Figure 4A). The ALC was similar in both groups (p=0.1140, Figure 4B). Using the same criteria as described in the age analysis, seven of the standard parental immune cell types were similar and two (CD8+ T cells, B cells) were significantly different between cancer patients and healthy donors (Table 4). Surprisingly, cancer patients had on average 90% more CD8+ T cells compared to age-matched healthy donors (median % of PBMCs = 15 in patients and 8 in healthy donors, p=0.0168, Figure 4C). On the other hand, cancer patients also had on average 50% less total B cells compared to healthy donors (median % of PBMCs = 8 in patients and 16 in healthy donors, p=0.0027, Figure 4D). No notable differences were evident when subsets were compared between patients with different cancer types; however, this was likely due to the small number of patients within each indication that were examined (data not shown).
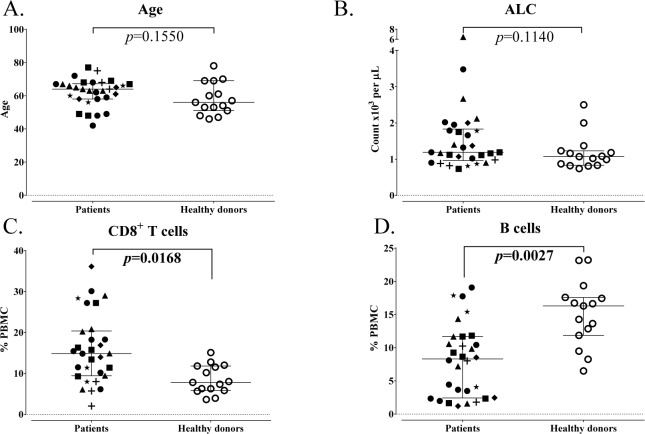
Standard parental immune cell types in age-matched advanced cancer patients and healthy donors. A: Patients with advanced cancer (n=30) and healthy donors (n=15) included in this analysis were age-matched above age 40. B: Absolute lymphocyte count (ALC) of cancer patients and healthy donors. Graphs display median age or ALC with 25–75 percentiles; cancer type indicated by shape. P-value was calculated using the Mann-Whitney test. CD8+ T cells (C) and B cells (D) were different in cancer patients and healthy donors, as defined by an adjusted p<0.05, the median of groups showing a > 50% difference, and a frequency above 0.01% for peripheral blood mononuclear cells (PBMCs). Graphs display median frequency as a percentage of PBMCs with 25–75 percentiles; cancer type indicated by shape (square: GI (anal, colon, oesophageal); n=6; triangle: pancreatic, n=6; star: breast, n=3; plus sign: mesothelioma, n=3; diamond: renal cell, n=3; closed circle: other (adrenocortical, chordoma, lung, medullary thyroid, neuroendocrine, ovarian, prostate, spindle cell), n=9; open circle: healthy donors, n=15). P-value was calculated using the Mann-Whitney test, with Holm adjustment made for multiple comparisons using the number of standard subsets with a frequency above 0.01% for PBMCs (n=9).
Table 4.
Standard parental immune cell types in age-matched advanced cancer patients and healthy donors
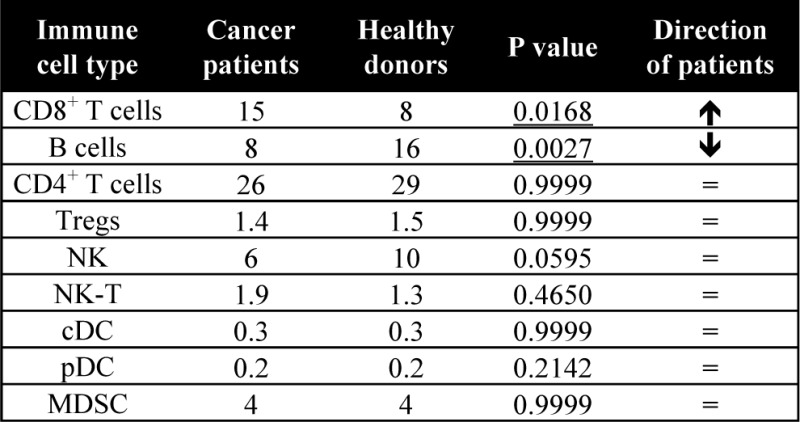 |
A total of 9 standard parental immune cell types were analyzed. Values are displayed as median % of PBMCs. P-value was calculated with the Mann Whitney test with Holm adjustment made for multiple comparisons using the number of standard immune cell types with frequency above 0.01% of PBMCs (n=9). Differences were defined as subsets with an adjusted p<0.05, medians at least 50% different, and frequency above 0.01% of PBMCs.
——–
cDC, conventional dendritic cells; MDSC, myeloid derived suppressor cells; NK, natural killer; PBMCs, peripheral blood mononuclear cells; pDC, plasmacytoid DC; Tregs, regulatory T cells.
Of the 114 subsets related to maturation and function within the standard immune cell types, 23 were changed with cancer (Table 5A). Some of the notable increases seen in cancer patients included subsets of T cells expressing basic leucine zipper transcription factor, ATF-like (BATF), PD-L1 and CTLA-4, which are inhibitory markers involved in immune checkpoint pathways and are increased upon T cell activation [13, 15]. While the percentage of CD4+ T cells was similar between cancer patients and healthy donors, cancer patients had 180% higher levels of BATF+CD4+ T cells (p=0.0029, Figure 5A). Along with an increase in the percentage of CD8+ T cells, cancer patients also had 170% higher levels of PD-L1+CD8+ T cells (p=0.0025, Figure 5B) and 165% higher levels of CTLA-4+CD8+ T cells (p=0.0025, Figure 5C). Using the less stringent criteria as described above in the age analysis to identify subsets with trends, cancer patients showed increases in T box expressed in T cells (Tbet+)CD8+ and eomesodermin (EOMES)+CD8+, as well as Tbet+CD4+ cells (Table 5B). These subtypes are known to be increased upon activation and differentiation. [16]
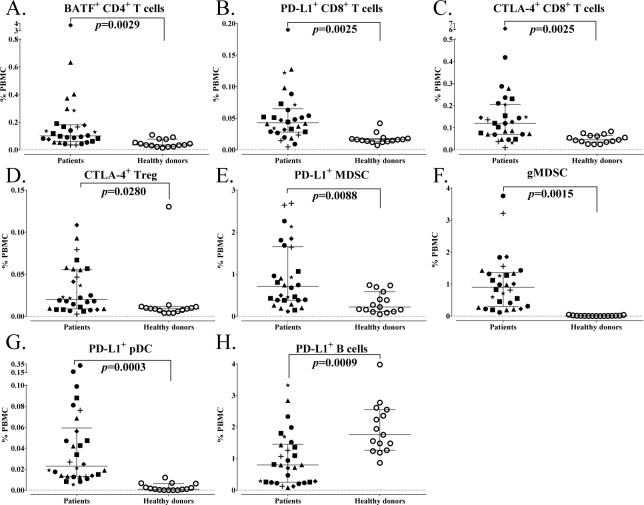
Differences in immune cell subsets related to maturation and function between age-matched advanced cancer patients and healthy donors. A total of 114 subsets were analysed related to maturation and function within the standard subsets. Subsets were considered different if a subset had an adjusted p<0.05, the median of groups showing a > 50% difference, and a frequency above 0.01% for peripheral blood mononuclear cells (PBMCs). A-H: Representative graphs are shown for notable subsets with differences between cancer patients and healthy donors. Graphs display median frequency as a percentage of PBMCs with 25–75 percentiles; cancer type indicated by shape (square: GI (anal, colon, oesophageal), n=6; triangle: pancreatic, n=6; star: breast, n=3; plus sign: mesothelioma, n=3; diamond: renal cell, n=3; closed circle: other (adrenocortical, chordoma, lung, medullary thyroid, neuroendocrine, ovarian, prostate, spindle cell), n=9; open circle: healthy donors, n=15). P-value was calculated using the Mann-Whitney test, with Holm adjustment made for multiple comparisons using the number of subsets within each standard subset with a frequency above 0.01% for PBMCs (n=29 for CD4+ T cells, 25 for CD8+ T cells, 5 for Tregs, 14 for natural killer (NK) cells, 3 for NK-T cells, 4 for B cells, 2 for conventional dendritic cells (cDCs), 3 for plasmacytoid DCs (pDCs) and 15 for myeloid derived suppressor cells (MDSCs)).
Table 5.
Differences in immune cell subsets relating to maturation and function between age-matched advanced cancer patients and healthy donors
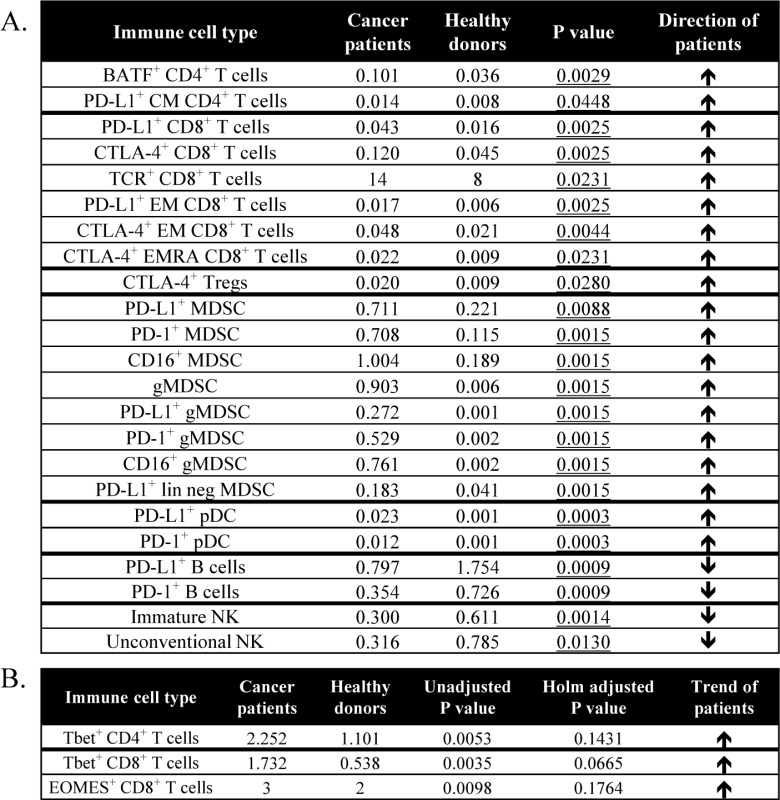 |
A total of 114 subsets were analyzed relating to maturation and function within the standard subsets. A: Table displays subsets that were different in cancer patients and age-matched healthy donors, as defined by an adjusted p<0.05, medians at least 50% different, and frequency above 0.01% of PBMCs. Values represent median % of PBMCs, and p-value was calculated with the Mann Whitney test with Holm adjustment made for multiple comparisons using the number of subsets within each standard subset with frequency above 0.01% of PBMCs (n=29 for CD4+ T cells, 25 for CD8+ T cells, 5 for Tregs, 14 for NK cells, 3 for NK-T cells, 4 for B cells, 2 for cDCs, 3 for pDCs, 15 for MDSCs). B: Table displays subsets with notable trends between cancer patients and healthy donors as defined by unadjusted p< 0.01, medians at least 50% different, and frequency above 0.01% of PBMCs. Values represent median % of PBMCs.
——–
BATF, basic leucine zipper transcription factor ATF-like; cDC, conventional dendritic cells; CM, central memory; CTLA-4, cytotoxic T lymphocyte-associated protein-4; EM, effector memory; EMRA, terminally differentiated effector memory; EOMES, eomesodermin; gMDSCs, granulocytic mononuclear derived suppressor cells; lin neg MDSCs, lineage negative MDSCs; NK, natural killer; PBMCs, peripheral blood mononuclear cells; pDC, plasmacytoid DC; PD-1, programmed cell death-1; PD-L1, programmed cell death ligand-1; Tbet, T box expressed in T cells; TCR, T cell receptor; Tim-3, T cell immunoglobulin and mucin domain-3; Tregs, regulatory T cells.
Cancer patients also had notable increases in subsets involving maturation and function in suppressive immune cells. While the percentage of Tregs and MDSCs was similar between cancer patients and healthy donors, cancer patients had higher levels of a Treg subset that expressed CTLA-4 (p=0.0280, Figure 5D), which is a suppressive marker for these regulatory cells [17], as well as increased levels of PD-L1+ MDSCs (p=0.0088, Figure 5E), a marker that has been implicated in suppressive function [18]. Cancer patients also had higher levels of granulocytic MDSCs (gMDSCs) (p=0.0015, Figure 5F), which have been found to be more suppressive than monocytic MDSCs (mMDSCs). [19]
While the percentage of pDC levels was also similar between cancer patients and healthy donors, cancer patients also had higher levels of PD-L1+ pDCs (p=0.0003, Figure 5G), which can have immunosuppressive and tolerogenic properties [20]. Cancer patients, on the other hand, had lower levels of PD-L1+ B cells (p=0.0009, Figure 5H), a marker that is upregulated upon B cell activation [21]. Thus, patients with advanced cancer had elevated levels of activation markers involved in immune checkpoint pathways in both CD4+ and CD8+ T cells, higher Tregs and MDSCs with a suppressive phenotype, and differences in PD-L1 expression on antigen-presenting cells (APCs) compared to age-matched healthy donors.
3.3. Differences in gene expression profiles between cancer patients and age-matched healthy donors
To determine whether changes in immune cell subsets seen at the protein level could be corroborated at the gene level, a study was performed in which gene expression profiling was performed in PBMCs from patients with advanced GI cancer (n=4) and age-matched healthy donors (n=5). A total of 157 genes were significantly different (p-value <0.05 and fold change > |1.5|) between the two groups (Figure 6A). Pathway analysis demonstrated that genes were localized to several pathways, including B cell receptor signalling and glutamate signalling pathways (Figure 6B). Several genes implicated in the regulation of immune cells including MDSCs, B cells and T cells were identified as differentially expressed between the two groups (Figure 6C). For MDSCs, this included decreases in CD200, a ligand receptor expressed on myeloid cells involved in the inhibition of MDSC signalling [22], as well as increases in CD300LB, an immune receptor expressed in myeloid cells involved in the activation of suppressor function [23]. With regard to B cells, changes included decreases in the gene expression of CD19, CD22, CD72, IKZF3 and GCSAM in cancer patients compared to healthy donors. CD19 is the hallmark differentiation antigen of B cell lineage, positively regulating antigen receptor signalling in these cells [24]; CD22 and CD72 are involved in B cell maturation [25, 26], IKZF3 is a transcription factor involved in B cell proliferation and development [27], and GCSAM, also known as HGAL, has been shown to activate B cell receptor signalling by enhancing its kinase activity [28]. Multiple T cell receptor genes were also decreased in both the alpha and beta families.
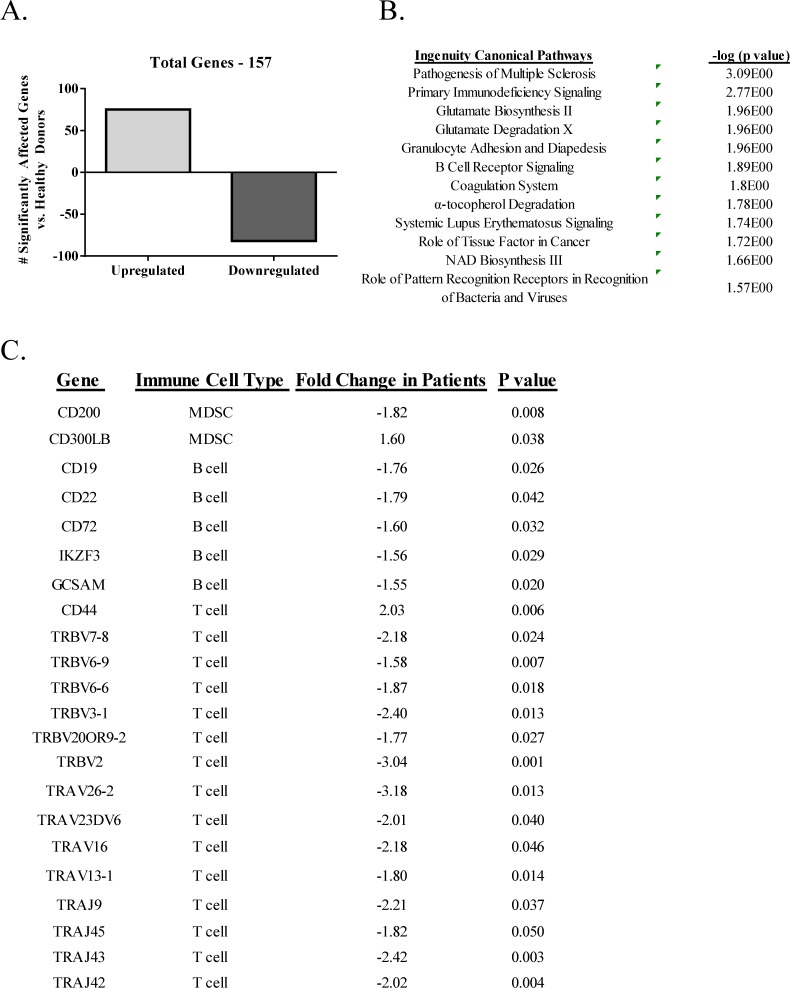
Microarray analysis in PBMCs from metastatic patients with GI cancer and age-matched healthy donors. Microarray analysis was performed on RNA isolated from PBMCs of patients with advanced GI cancer (n=4) and age-matched healthy donors (n=5). A: Total number of significantly affected genes (p < 0.05 and fold change > |1.5|). B: Ingenuity pathway analysis of the 157 significantly affected genes. Pathways are listed in the left column and p-value (Fisher's exact test) is listed in the right column. C: Key immune related genes identified as differentially expressed (p < 0.05 and fold change > |1.5|), with known key immunological function between advanced cancer patients and age-matched healthy donors. Includes gene name, known cell type, fold change and p-value.
4. Discussion
With the expanded use of immunotherapeutics such as checkpoint inhibitor MAbs, vaccines and immune modulators in the management of many cancer types, the identification (either prior to therapy and/or early in the therapeutic regimen) of patients most likely to benefit from immunotherapy becomes more important. For example, evidence has emerged from studies of patients with melanoma and other tumour types of prognostic factors derived from tumour biopsies such as: (a) the number of mutations, (b) the expression of PD-L1 on tumour cells and/or (c) the presence of immune infiltrate. However, using these factors has not always provided a good surrogate of patient benefits with clear outliers (both positive and negative) for all three of these parameters. Moreover, with the exception of melanoma and some metastatic lesions to the skin of other tumour types, biopsies of metastatic lesions of most solid tumours are not always feasible and numerous studies have shown that the phenotype of primary tumours often differs from metastatic lesions. Analyses of immune cells in the periphery may very well aid – along with other parameters mentioned – in selecting patients most likely to benefit from and/or in identifying patients early on in the agent regimen who will benefit from a specific immunotherapy.
Recent advances in human immunology using multicolour flow cytometry and high-throughput computation analysis (cytomics) now allow for the identification of numerous individual peripheral immune cell subsets [29–31]; moreover, the biological function and relevance of many of these subsets have been described [5]. To our knowledge, the study reported here is the most comprehensive to date, analysing 123 different peripheral immune cell subsets with a focus on subsets related to maturation and function (Table 1), comparing healthy donors under vs. over the age of 40, and comparing metastatic cancer patients with age-matched healthy donors. It should be noted that all comparisons between groups in this study employed the Mann-Whitney test and resulting p-values were adjusted using the step-down Holm adjustment for multiple comparisons. This adjustment was applied to account for the increased probability of Type I errors (false positives) that occur when multiple outcome measures (e.g., 123 subsets) are assessed. However, as p-value adjustments also increase the risk of Type II errors (false negatives), we additionally performed a less stringent analysis evaluating unadjusted p-values and identified trends of changes in subsets with an unadjusted p<0.01.
Changes in the immune system with aging are evidenced by the observation that older individuals have a higher prevalence of autoimmunity, chronic diseases and cancer [32]. Previous studies examining peripheral immune cells during aging have focused primarily on certain standard immune cell types and, in some cases, on their memory status. In addition, prior studies have examined PBMCs of individuals in a young group, defined as aged 18–34, vs. an older group, above the age of 65 [33, 34]; other studies have also used an older cut-off ranging between 60–65 years of age in order to separate older from younger individuals [35–37].
In the study reported here, age 40 [6, 7] was used as a demarcation to define younger and older healthy donor groups, as the risk of cancer rises substantially at age 40. With more cancers also arising earlier in life, it is also important to define the relationship of age on immune cell subsets evaluating a younger age population, rather than focusing on populations aged 65 and above. In this study, differences were not evident when subsets (albeit smaller number per group) were examined by age decade or gender; however, as described above, a number of changes were identified between healthy donors when age groups were defined as below or above the age of 40.
We show here for the first time that healthy donors over the age of 40 had lower ALC, lower CD8+ T cells, lower activation markers within CD8+ T cells, lower naïve and central memory CD8+ T cells and higher NK cells, compared to those under the age of 40 (Figures 2 and and3).3). NK results are in agreement with those of others reporting an increase in total NK cells with age; however, this increase of NK cells in older individuals was reported when examining donors according to young and old extremes, and when using age 60 as a cut-off to define older individuals [38–40]. In prior studies, using age 60 as a cut-off for older individuals, it has been shown that the CD8+ T cell compartment was more affected by age than CD4+ T cells [32, 35]. The most notable changes in the studies reported here with regard to age (under vs. over 40) were evident in the T cell compartment and specifically involved CD8+ T cells.
In addition to the standard immune cell types, we also examined many subsets related to maturation and function with known biological importance, including immune cells expressing immune checkpoints such as PD-1, PD-L1, CTLA-4 and Tim-3. With regards to maturation status, it is generally accepted that there is a decrease in naïve T cells and an increase in memory T cells with age [2]. It was shown here that healthy donors > 40 years had a decrease in both naïve and central memory CD8+ T cells. This substantiates and extends a prior report that elderly individuals have a decrease in both naïve and central memory CD8+ T cells in cases where younger donors with an average age of 30 were compared to older donors with an average age of 70 [35]. It has also been reported that T cell signalling can be altered with aging, involving the expression of T cell receptor (TCR) components, signal transduction and the expression of costimulatory receptors [41]. The most notable differences in our age analysis were related to activation markers in CD8+ T cells. We found (Figure 3) that healthy donors over the age of 40 had decreases in CD8+ T cells that expressed PD-L1, CTLA-4 and Tim-3, which are inhibitory molecules involved in T cell immune checkpoints and can serve as markers of immune activation [13, 42].
Many prior studies comparing healthy donors with cancer patients have focused mainly on standard immune cell types and maturation markers [43–48], while others [42, 49] have also examined several additional subsets. We report here that among the standard immune cell types, there were significantly higher levels of CD8+ T cells and lower levels of B cells in cancer patients compared to age-matched healthy donors (Figure 4). Notable differences in immune cells related to maturation and function were also evident between cancer patients and healthy donors. We show here for the first time that patients with multiple indications of advanced cancer had higher activation markers involved in immune checkpoint pathways in CD4+ and CD8+ T cells, several higher suppressive Treg and MDSC subsets, and altered expression of PD-L1 on APCs (Figure 5). CTLA-4 and PD-L1 are co-inhibitory molecules that are expressed on T cells upon activation [42, 50] and BATF is a transcription factor involved in PD-1 signalling [15]. Cancer patients had higher levels of BATF+CD4+ T cells, PD-L1+CD8+ T cells and CTLA-4+CD8+ T cells compared to healthy donors. Expression of PD-L1 on APCs was also altered in cancer patients, with lower levels detected on B cells and higher levels on pDCs when compared to healthy individuals.
Prior studies [51, 52] have shown that cancer patients also had higher levels of Tregs and MDSCs compared to healthy donors. In the studies reported here, while levels of total Tregs were similar to healthy donors, cancer patients had increased levels of CTLA-4+ Tregs, which is a phenotype of a biologically suppressive Treg [17]. It has also been previously reported that while prostate cancer patients had a similar frequency of total Tregs in peripheral blood as healthy donors, the CTLA-4+ Tregs from patients had greater suppressive functionality [53]. Additionally, patients with head and neck squamous cell carcinomas have also been shown to have increased levels of the CTLA-4+ on Tregs when compared to healthy donors [54]. While we did not find an increase in MDSCs in cancer patients in this study, cancer patients displayed an increased frequency in several subsets of MDSCs with a suppressive phenotype, including PD-L1+ MDSCs and gMDSCs.
In order to corroborate changes between cancer patients and healthy donors at the phenotypic level with those at the gene level, we performed genome-wide gene expression profiling in an additional subset of advanced cancer patients and age-matched healthy donors. In the flow cytometry analysis, some subsets of MDSCs were increased, while B cells were decreased in cancer patients relative to healthy donors. In the microarray data set, we observed a down-regulation of the MDSC suppressor CD200 and up-regulation of the MDSC activator CD300LB, as well as decreased expression of CD19 and several other markers of B cell maturation and activation. It has already been well-established that the identification of gene transcripts in PBMCs correlate to changes in survival, disease progression and other various clinical outcomes, especially in cancer [55–60]; however, these data demonstrate the potential for combining extensive phenotypical analysis with genome-wide gene expression analysis.
While the study reported here identified 123 immune cell subsets using flow cytometry, additional subsets could provide important insight regarding the effect of age and cancer on the immune system. For example, up to 17 unique B cell subsets have been described in the peripheral blood [61]; however, due to limitations in both the quantity of patient blood available, as well as the number of colours able to be run per panel on the LSR II, we were able to include only five B cell subsets in our study. Future studies might incorporate additional panels focusing on specific subsets such as B cells and NK cells – where additional phenotypic markers have been described in the literature – in order to gain deeper insight into the standard subsets. In addition, the utilization of new technologies such as CyTOF, the next generation of cell detection that allows for the simultaneous detection of up to 50 antibodies in a single panel, may overcome these limitations and allow for the efficient detection of numerous immune subsets from small samples [62, 63].
Analyses of the 123 immune cell subsets reported here required only 1 × 10⁷ PBMCs obtained from ~5–10 mL of peripheral blood. This is a minimally invasive procedure and analyses could be performed immediately prior to immunotherapy and/or early in the agent regimen. Analyses of PBMC subsets can also identify changes in the patient's immune constitution as a result of prior and/or more recent therapies. Studies [64] have shown that some so-called “non-immune”-based therapies, such as certain chemotherapeutics and targeted therapies, can have appreciable effects (either positive or negative) on subsequent immunotherapy regimens. Recent hypothesis-generating clinical studies have also provided evidence in different immunotherapy trials that analyses of immune cell subsets may correlate with patient benefits [8, 42, 65]. Larger trials will need to be carried out to expand and confirm these findings. Purified PBMCs in this study were frozen and stored for batch analyses to reduce any assay to assay variations.
The studies reported here are meant to provide a foundation for the use of the 123 peripheral immune cell subset panels in future randomized clinical studies involving well-defined and homogeneous patient populations, as well as for use as an adjunct to other prognostic analyses such as the interrogation of patient biopsies, when available. In addition, to more carefully assess the changes in immune cell subsets as cancer progresses, longitudinal studies are planned that will include patients with different stages of cancer. Using these panels, we were able to identify differences in peripheral immune cell subsets between younger and older healthy donors, and between advanced cancer patients and age-matched controls. While the studies here focused on differences in age and between healthy donors and cancer patients, the analysis of 123 peripheral immune cell subsets can potentially also be employed to provide valuable information in the prognosis and/or therapy of patients with autoimmunity and other chronic or infectious diseases.
5. Compliance with Ethical Research Standards
All of the subjects gave informed consent. Samples from healthy donors were obtained from the NIH Clinical Center Blood Bank (NCT00001846), and patients were enrolled in clinical trials approved by the NCI IRB (NCT01772004, NCT00088413).
8. Acknowledgements
The authors thank Debra Weingarten for her editorial assistance in the preparation of this manuscript.
7. Funding
Grant support was provided by the Intramural Research Program of the Center for Cancer Research, National Cancer Institute, National Institutes of Health.
References
Articles from Journal of Circulating Biomarkers are provided here courtesy of AboutScience
Full text links
Read article at publisher's site: https://doi.org/10.5772/62322
Read article for free, from open access legal sources, via Unpaywall:
https://journals.sagepub.com/doi/pdf/10.5772/62322
Citations & impact
Impact metrics
Citations of article over time
Alternative metrics

Discover the attention surrounding your research
https://www.altmetric.com/details/61997900
Article citations
Adjuvant nivolumab, capecitabine or the combination in patients with residual triple-negative breast cancer: the OXEL randomized phase II study.
Nat Commun, 15(1):2691, 27 Mar 2024
Cited by: 2 articles | PMID: 38538574 | PMCID: PMC10973408
Immune-restoring CAR-T cells display antitumor activity and reverse immunosuppressive TME in a humanized ccRCC mouse model.
iScience, 27(2):108879, 15 Jan 2024
Cited by: 5 articles | PMID: 38327771 | PMCID: PMC10847687
Raman Spectroscopy Combined with Malaria Protein for Early Capture and Recognition of Broad-Spectrum Circulating Tumor Cells.
Int J Mol Sci, 24(15):12072, 28 Jul 2023
Cited by: 0 articles | PMID: 37569448 | PMCID: PMC10419290
Association between the Immunophenotype of Peripheral Blood from mCRPC Patients and the Outcomes of Radium-223 Treatment.
Diagnostics (Basel), 13(13):2222, 29 Jun 2023
Cited by: 0 articles | PMID: 37443615
First-in-human phase Ib trial of M9241 (NHS-IL12) plus avelumab in patients with advanced solid tumors, including dose expansion in patients with advanced urothelial carcinoma.
J Immunother Cancer, 11(5):e005813, 01 May 2023
Cited by: 8 articles | PMID: 37236636 | PMCID: PMC10230972
Go to all (31) article citations
Data
Data behind the article
This data has been text mined from the article, or deposited into data resources.
BioStudies: supplemental material and supporting data
Clinical Trials (2)
- (2 citations) ClinicalTrials.gov - NCT01772004
- (1 citation) ClinicalTrials.gov - NCT00088413
Similar Articles
To arrive at the top five similar articles we use a word-weighted algorithm to compare words from the Title and Abstract of each citation.
A flowcytometric analysis to efficiently quantify multiple innate immune cells and T Cell subsets in human blood.
Cytometry A, 91(4):336-350, 06 Mar 2017
Cited by: 19 articles | PMID: 28264143
Crosstalk between dendritic cell subsets and implications for dendritic cell-based anticancer immunotherapy.
Expert Rev Clin Immunol, 10(7):915-926, 23 Apr 2014
Cited by: 22 articles | PMID: 24758519
Review
Analyses of Pretherapy Peripheral Immunoscore and Response to Vaccine Therapy.
Cancer Immunol Res, 4(9):755-765, 02 Aug 2016
Cited by: 24 articles | PMID: 27485137 | PMCID: PMC5138028
Evaluation of a 12-color flow cytometry panel to study lymphocyte, monocyte, and dendritic cell subsets in humans.
Cytometry A, 77(5):410-419, 01 May 2010
Cited by: 117 articles | PMID: 20099249

