Abstract
Background
The integration and visualization of multimodal datasets is a common challenge in biomedical informatics. Several recent studies of The Cancer Genome Atlas (TCGA) data have illustrated important relationships between morphology observed in whole-slide images, outcome, and genetic events. The pairing of genomics and rich clinical descriptions with whole-slide imaging provided by TCGA presents a unique opportunity to perform these correlative studies. However, better tools are needed to integrate the vast and disparate data types.Objective
To build an integrated web-based platform supporting whole-slide pathology image visualization and data integration.Materials and methods
All images and genomic data were directly obtained from the TCGA and National Cancer Institute (NCI) websites.Results
The Cancer Digital Slide Archive (CDSA) produced is accessible to the public (http://cancer.digitalslidearchive.net) and currently hosts more than 20,000 whole-slide images from 22 cancer types.Discussion
The capabilities of CDSA are demonstrated using TCGA datasets to integrate pathology imaging with associated clinical, genomic and MRI measurements in glioblastomas and can be extended to other tumor types. CDSA also allows URL-based sharing of whole-slide images, and has preliminary support for directly sharing regions of interest and other annotations. Images can also be selected on the basis of other metadata, such as mutational profile, patient age, and other relevant characteristics.Conclusions
With the increasing availability of whole-slide scanners, analysis of digitized pathology images will become increasingly important in linking morphologic observations with genomic and clinical endpoints.Free full text

Research and applications
Cancer Digital Slide Archive: an informatics resource to support integrated in silico analysis of TCGA pathology data
Abstract
Background
The integration and visualization of multimodal datasets is a common challenge in biomedical informatics. Several recent studies of The Cancer Genome Atlas (TCGA) data have illustrated important relationships between morphology observed in whole-slide images, outcome, and genetic events. The pairing of genomics and rich clinical descriptions with whole-slide imaging provided by TCGA presents a unique opportunity to perform these correlative studies. However, better tools are needed to integrate the vast and disparate data types.
Objective
To build an integrated web-based platform supporting whole-slide pathology image visualization and data integration.
Materials and methods
All images and genomic data were directly obtained from the TCGA and National Cancer Institute (NCI) websites.
Results
The Cancer Digital Slide Archive (CDSA) produced is accessible to the public (http://cancer.digitalslidearchive.net) and currently hosts more than 20 000 whole-slide images from 22 cancer types.
Discussion
The capabilities of CDSA are demonstrated using TCGA datasets to integrate pathology imaging with associated clinical, genomic and MRI measurements in glioblastomas and can be extended to other tumor types. CDSA also allows URL-based sharing of whole-slide images, and has preliminary support for directly sharing regions of interest and other annotations. Images can also be selected on the basis of other metadata, such as mutational profile, patient age, and other relevant characteristics.
Conclusions
With the increasing availability of whole-slide scanners, analysis of digitized pathology images will become increasingly important in linking morphologic observations with genomic and clinical endpoints.
Objective
The ability to integrate diverse datasets is a common challenge in biomedical informatics. No currently available tools readily support the integration of pathologic, radiologic, clinical, and genomics data within a single framework. Several recent studies that leverage data from The Cancer Genome Atlas (TCGA) have illustrated important relationships between observations from whole-slide pathology images, outcome, and genomic and transcriptomic events.1–3 For example, the development of molecular tumor subtypes is an active area of genomics research, and we have recently demonstrated that the presence of necrosis in a tissue sample strongly affects subtype-expression signatures in glioblastomas (GBMs).1
To support integration of multifaceted TCGA datasets, we have developed an informatics tool to support the visualization, annotation, and analysis of the large whole-slide pathology image datasets. This resource contains over 24 000 images from 24 tumor types along with associated pathology reports, clinical data, surgery and radiation treatment information, and genomic information. To this end, we have developed the Cancer Digital Slide Archive (CDSA), a web-based resource that enables fluid exploration of the TCGA pathology digital slides alongside associated clinical, genetic and radiologic descriptions. We provide an overview of the driving use case that prompted the development of this resource, discuss technical challenges encountered during its development, and present our solutions for supporting the management, integration, and analysis of large-scale whole-slide imaging datasets.
Background and significance
TCGA is a large National Cancer Institute (NCI)-funded initiative to establish a large bio-specimen repository consisting primarily of molecular data from thousands of tumor biopsies. While TCGA efforts have primarily focused on the storage, querying, and management of genomics and clinical data (table 1), a significant collection of digital whole-slide images (WSIs) of patient tissues has also been accrued. These images provide a tremendous potential resource for investigating the links between morphologic observations and genomic and clinical endpoints, but they were not conveniently accessible to the public. In this paper we discuss the implementation of a web-based resource for the visualization of whole-slide pathology imaging and integration between imaging, genomic and clinical datasets. This resource, the CDSA (http://cancer.digitalslidearchive.net), currently hosts over 20 000 WSIs and related clinical data from TCGA, along with radiology and genetic summaries where available. This searchable resource enables users to identify and explore sets of images with particular genomic, pathologic or clinical criteria.
Table 1
TCGA data resources (source: https://tcga-data.nci.nih.gov/tcga/tcgaAnalyticalTools.jsp)
| Resource name | Summary |
|---|---|
| The Cancer Imaging Archive (TCIA) | TCIA is a service provided by NCI that provides access to radiological imaging datasets in DICOM format from TCGA cases. TCIA supports imaging phenotype—genotype research, in addition to other imaging datasets for cancer imaging analysis |
| Cancer Genome Workbench (CGWB) | The CGWB is an application developed by NCI that provides whole-genome and heatmap views of sample-level data |
| Cancer Molecular Analysis (CMA) Portal | The CMA Portal is a web-based application created by caBIG (NCI) that allows researchers to integrate, visualize, and explore clinical and genomic characterization data from translational research studies |
| Integrative Genomics Viewer (IGV) | The IGV is a high-performance visualization tool created by the Broad Institute for interactive exploration of large, integrated datasets |
| cBio Cancer Genomics Portal | The cBioCancer Genomics Portal provides visualization, analysis and download of large-scale cancer genomics datasets. The portal is developed and maintained by the Computational Biology (cBio) Center at Memorial Sloan-Kettering Cancer Center |
| UCSC Cancer Genomics Browser | The Cancer Genomics Browser is a suite of web-based tools to visualize, integrate and analyze cancer genomics and its associated clinical data. It is developed and maintained by the UCSC Cancer Genomics Group |
| Biosig | Biosig, sponsored by the Lawrence Berkeley National Laboratory, allows the TCGA community to download computed histology-based information, and visualize images and overlaid computed information |
| Broad GDAC Firehose | The Broad GDAC Firehose provides L3 data and L4 analyses packaged in a form amenable to immediate algorithmic analysis. This enables a wide range of cancer biologists, clinical investigators, and genome and computational scientists to easily incorporate TCGA into the backdrop of ongoing research |
| MD Anderson GDAC MBatch | The MD Anderson GDAC's TCGA Batch Effects (also known as MD Anderson GDAC MBatch or MBatch) website enables researchers to identify and quantify batch effects present in TCGA data summaries |
NCI, National Cancer Institute; TCGA, The Cancer Genome Atlas.
The workflow of TCGA involves the physical collection of glass slides associated with pathology specimens for the quality assurance process and for achieving consensus diagnosis. Several groups are using these and other imaging datasets to study the interactions between computationally derived descriptions of histology, genetics, and clinical outcomes.1–5 These studies have illustrated the significant role of computational morphometry, particularly in cancer studies, and consequently the importance of integrating pathology imaging data into tissue-based studies of disease. In our integrated study of genomics and the tissue microenvironment in gliomas, we have used the TCGA imaging data to illustrate microenvironmental drivers of expression observed through computational analysis of pathology images. By comparing annotations of necrosis with genomic observations on adjacent tissues, we discovered that several master transcriptional regulators of the aggressive mesenchymal GBM phenotype are highly correlated with the presence of necrosis.6 Immunohistochemistry confirmed these in silico findings, showing that the master regulator, C/EBP-β, is specifically expressed in hypoxic tumor cells surrounding necrotic regions. This discovery has significant implications for GBM biology.7
While most of our work has been focused on GBM, our goal was to facilitate researchers to, at the very least, be able to quickly visualize the tissue used for diagnosis and genomic analysis. Owing to the sheer size and scope of the TCGA project, it is likely some samples may be mislabeled or misdiagnosed; thus, increasing researchers’ access to the raw data is an important part of producing reproducible science. Recent studies have shown an alarming lack of reproducibility in scientific studies.8 Informatics tools can be a critical component in reducing this growing problem.
As the TCGA data are public and multifaceted, they served as an ideal test-bed for developing an infrastructure for integrated pathology imaging studies. The limited availability of tools to manage WSIs remains a significant bottleneck in studies involving pathology imaging, as most existing software is not designed for multi-gigabyte images or is not open source, making customization difficult. This work extends some of our earlier work in whole-slide imaging and image analysis, dating back over the past 15 years.9–11
Review of current online digital pathology imaging resources
During our scientific studies of microenvironment in GBMs, we were unable to identify open-source tools to enable visualization of the TCGA WSIs, let alone integrate the genomics, radiology, annotations, or clinical information within a single framework. While WSI technology has existed for a number of years, many technical and practical challenges in its utilization remain. The vast amount of TCGA WSIs (20 000+ images) is much larger than anything managed by existing non-commercial options, prompting us to create the CDSA. Several existing online resources currently serve WSIs, and web-based WSI visualization has been feasible for over a decade.12–14 One such resource is SlideTutor from the University of Pittsburgh, a Java-based resource intended primarily as an educational resource.15 Three other resources providing comparable types and numbers of specimens are provided by the University of Iowa,16 the University of Leeds,17 and the United States & Canadian Academy of Pathology (USCAP).18 Each of these resources is well organized and easily reviewable by users, with some using commercial Aperio software for whole-slide scans.
Open-source tools for WSI viewing
Visualization of multi-gigapixel images is a common issue in a number of disciplines including pathology, geography, astronomy, and materials science. Among these applications, WSI visualization has special considerations because of the quality constraints for clinical use and the ever-evolving market of scanning devices. A single WSI digitized at 40× objective magnification contains upwards of 1010 pixels. These contents must be stored in a multiscale representation to enable fluid navigation by pathologists, who frequently switch between magnifications to inspect areas of interest. Compression must preserve quality while providing reasonable file sizes and random-access performance. To be useful in research, the proprietary formats produced by scanning devices must also be approachable by software developers.
A number of software solutions are available for serving image data from WSI content. A documented open-source library from the Open Microscope (OMERO) environment19 provides format conversions for many scanners, as well as an interface for requesting image data over the web. OMERO has a number of impressive features including desktop and web-based client interfaces, as well as an active user community. At the time we were developing CDSA, however, large-image support was not yet mature, although recent updates have made it possible to integrate OMERO technology within CDSA to broaden format support. Zoomify,18 a commercial solution for web-based visualization, enables multiresolution browsing and is used with WSIs in a site maintained by the Berkeley National Lab.20 The BIRN pathology workbench21 is another useful resource which integrates a Zoomify web-client with a Django/mySQL backend to provide metadata management for WSI repositories. The DeepZoom framework used in the CDSA was initially developed by Microsoft22 using Silverlight to support large-scale image web viewing. An open-source version, OpenZoom, is the version used in the CDSA.23 Besides providing smoother panning and zooming than competitors, its release as an open-source product enables us to enhance core features.
Methods
Hardware
The current CDSA is hosted on AMD dual-CPU AMD Opteron 6274 Processers (2.2 MHz) with a total of 24 cores and 128 gigabytes of RAM. The machine currently has 30 terabytes of storage, with the ability to add additional capacity for new datasets as they become available. The host operating system is Ubuntu 10.04 LTS.
Data sources
All TCGA WSIs were directly downloaded from the TCGA portal14 as SVS files, an image format developed by Aperio. CDSA contains scans of both diagnostic sections from formalin-fixed paraffin-embedded tissues and frozen tissue sections of specimens submitted to the TCGA. The frozen sections are immediately adjacent to tissue that was used for genomic analysis, and are typically taken from both the ‘top’ and ‘bottom’ of the tissue portion submitted for genomic analysis in order to improve spatial resolution. These locations are designated ‘TS’ and ‘BS’, respectively, in the filenames of a frozen section. It is well known that many solid tumors are heterogeneous, and the morphology and molecular qualities may vary considerably throughout a sample. The approach taken by TCGA in sampling tissues is limited in capturing potential heterogeneity, but was driven by practicality and the experience of pathologists who consulted on the TCGA project (figure 1).
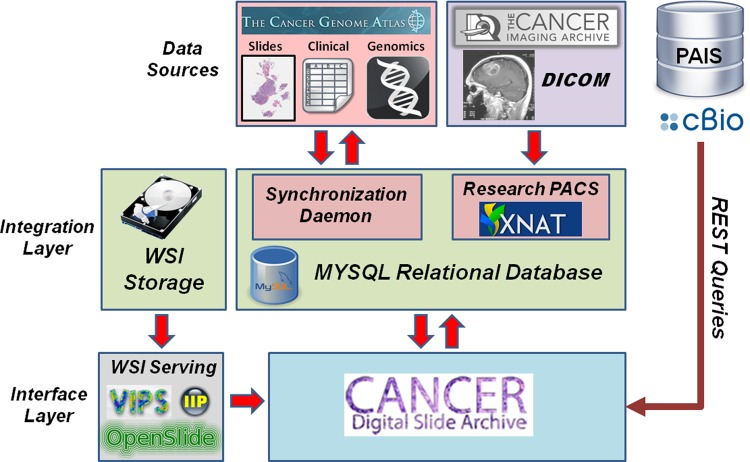
Information flow and integration in the Cancer Digital Slide Archive (CDSA). Whole-slide images (WSIs) and other data types are mirrored from The Cancer Genome Atlas repository. Radiology data from The Cancer Imaging Archive is downloaded and organized within an XNAT research PACs. These data sources are integrated using a MySQL database to register the available data and associations between elements. The CDSA portal draws on information from the MySQL database, as well as metadata from the Memorial Sloan Kettering cBioPortal, and image analysis results from a local instance of the Pathology Analytical Imaging Standards (PAIS) database. WSIs are converted into web-friendly formats and served through CDSA using VIPS, IIP, and OpenSlide.
Radiology images were downloaded directly from The Cancer Imaging Archive (TCIA).13 All clinical data were downloaded as tab-delimited files from the TCGA open-access portal.14 Images and multiresolution pyramids themselves (over 20 terabytes and growing) are not routinely backed up because of their size and their availability from the TCGA archive. Pyramid creation is automated and so pyramids are also not included in backups.
Digital slide format conversion
After mirroring of the data from the public repository, an image conversion process is instantiated to convert SVS-format WSIs into a pyramidal BigTIFF (Tagged Image File Format) format24 using the VIPS library.16 As WSIs can exceed 4 gigabytes each (the limit for standard TIFFs), use of the latest TIFF libraries (v4) is required.23 Conversion produces a single pyramidal TIFF containing multiple resolutions to enable fast remote viewing. After conversion, thumbnails are generated and WSIs are manually reviewed before release into CDSA. Figure 2 shows the view of a converted image as seen through a browser on the CDSA website, where images can be selected, panned and zoomed. The choice of compression codec dramatically affects the converted file size. Early experiments with lossless Lempel-Ziv-Welch (LZW) produced images 20–30 gigabytes in size. We subsequently selected JPEG with a quality factor of 75, as JPEG is often used in commercial software, with qualities ranging from 75 to 85. JPEG compression produces acceptable image quality and reasonable file sizes for our applications (0.5 gigabytes/WSI). We also note that adoption of the IIPImage server simplifies file management, allowing images to be served from a single pyramidal file rather than the individual 256×256 pixel files required by DeepZoom alone. A single WSI can produce 50 000+ such tiles, and there are over 20 000 WSIs in the CDSA. Although the slides included in the CDSA are in the SVS format, the underlying technology can also load and visualize other slide formats, and we currently have support for Hamamatsu NanoZoomer NDPI files and BigTIFF files. With the use of the BioFormats package, other WSI formats could also potentially be integrated.
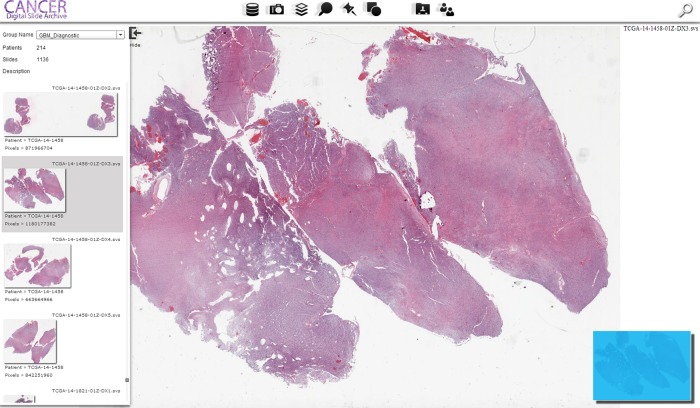
Entry page for the Cancer Digital Slide Archive. Images are grouped by cancer type based on The Cancer Genome Atlas (TCGA) acronyms, followed by the acronym expansion. Both permanent diagnostic quality images and frozen sections used for quality control are provided. The interface consists of a main viewing window where panning and zoom are controlled, a navigation window in the bottom left which overlays the current view on a thumbnail, a file selection panel on the left which enables dataset navigation, and a set of functions at the top for viewing integrated data types and creating snapshots, annotations, and landmarks.
Linking pathology with metadata and external data providers
Clinical and slide metadata for the TCGA project are currently available in text format from the TCGA data portal ((figurefigure 3). Available data include information about the clinical examination, radiation treatment, drug treatment and chemotherapy, and surgery, as well as observations obtained from the WSI during quality assurance. Direct access to the underlying database and schema was not available, so the available clinical data were loaded into a relational database (mySQL) for CDSA integration. Other data resources can be tied to a patient, or a specimen can also be incorporated into the CDSA; for example, given a patient ID we can dynamically query a resource such as the MSKCC cBioPortal and return a list of identified mutations or the expression of a gene of interest.
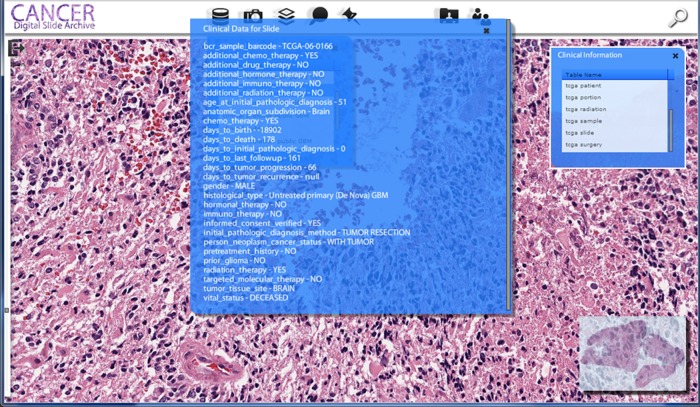
Integration with clinical data. By clicking on the database icon (first black icon on the left), a list of data sources appears. For The Cancer Genome Atlas dataset, available information on the clinical characteristics of the patient, information about the slide, surgery status, radiation treatment information, are also available. Other data sources can also be linked as long as they share a common key to the slide (eg, patient or sample ID).
As a demonstration of this, we have currently downloaded the published list of gene mutation data provided by the MSKCC cBioPortal/TCGA. As the set of genes sequenced varied, in the TCGA Thumbnail Browser, the browser will dynamically add the relevant gene list as seen in figure 6 (in this case only EGFR and PDGFRA were included). The user can then filter these results to identify cases with a specific set of mutations and then visualize the relevant images.
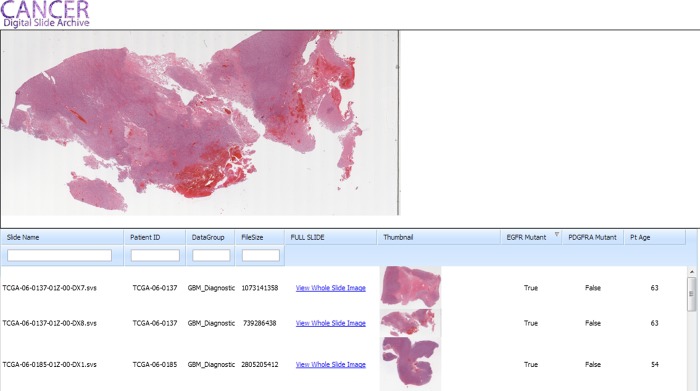
The Cancer Digital Slide Archive Thumbnail Browser allows quick screening and search of image datasets. The search panel below has textboxes to filter on criteria, and, when a user hovers over a small thumbnail, the large preview panel (top) is updated. In this example, data on EGFR and PDGFRA mutation status, along with age, are viewable, allowing searching of images/patients that match the chosen criteria.
All public data provided by the TCGA are deidentified and linked using only unique TCGA identifiers.
Radiology image integration
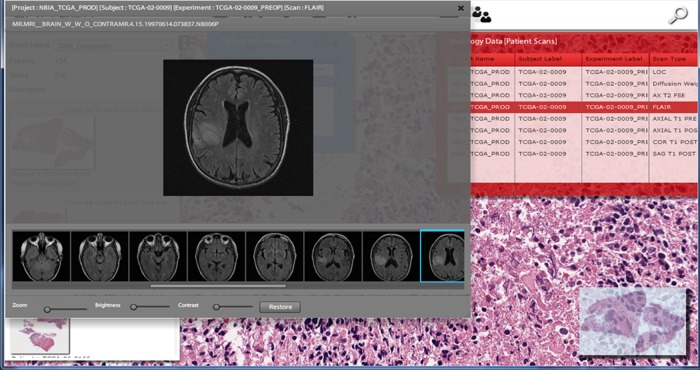
Radiology data for a limited set of TCGA patients has also been released by the NCI. We have integrated a subset of these images available through TCIA,25 specifically for GBM and BRCA cases. Radiology imaging was imported into a local instance of XNAT18 for storage and indexing. Using the pyXNAT interface18 and the DCMTK DICOM toolkit,18 we have developed a lightweight radiology image browser and incorporated it into our framework, which sits on top of the XNAT platform. TCGA pathology data and the TCIA imaging data are linked using unique TCGA identifiers. Figure Figure44 illustrates an example of combined radiographic and pathology image integration.
Annotation capabilities
The CDSA can directly overlay manual annotations produced using the Aperio ImageScope software, which are stored in a structured XML document. Machine-generated annotations can also be visualized. After image analysis (eg, cell segmentation), results can be viewed by embedding object boundaries directly into imaging content, manipulating the pixel values to indicate machine-generated boundaries. Figure 5 provides an example of a slide embedded with image-analysis-derived boundaries.
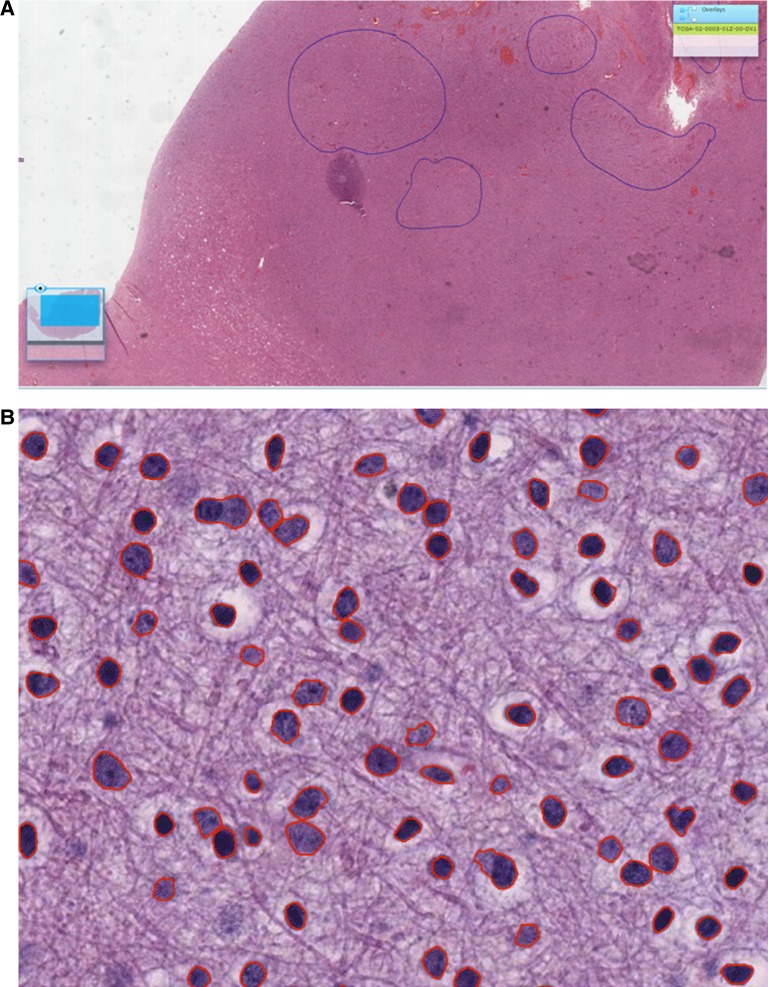
(A) Manually generated annotations generated using the Aperio Scanscope program can be visualized. (B) After automated segmentation, images with segmented boundaries integrated (in red) can be subsequently converted into whole-slide images and loaded into the Cancer Digital Slide Archive web portal.
Results
Image availability
TCGA contains ~2.8 terabytes of WSIs from tissue specimens. The current version of CDSA contains over 20 000 pyramidal TIFF files that are available for web-based visualization.
One of our initial projects focused on analysis of tumor nuclei from GBM WSIs; this dataset compromises ~480 digital slides (ranging in size from 56 M to 1.6 GB). Although our image analysis pipeline is largely automated,2 4 a visual review for artifacts before machine analysis is crucial to ensure reliable results (eg, figure 5). Outside of artifacts related to tissue preparation, we were surprised to discover a number of other artifacts that could affect image analysis algorithms (see online supplementary figure S1).
Discussion
We have developed a public web-based resource that integrates pathology, radiology and clinical data for the TCGA dataset. This project evolved from our investigative need to organize and curate large-scale pathology imaging data that are linked to clinical and genomic descriptions. Throughout this process, we have encountered numerous practical aspects related to working with large, multifaceted datasets. The primary goal of the CDSA was not simply to develop another web-based image viewer, but to develop a system to integrate multiple data sources (eg, radiology, clinical, genetics, imaging, etc) to support our research. Assembling the pipelines developed during this process, we were subsequently able to develop the CDSA and provide a resource for the imaging and pathology community.
File formats
Unlike the DICOM standard, which has been widely used in radiology for many years, a similar standard for digital pathology images has only recently emerged, and is not widely supported by vendors of scanning hardware.24–27 At the time we initiated this project, simply reading these large image files with non-proprietary software was a tremendous challenge. The images made available by TCGA are stored as SVS files, a custom file format developed by Aperio to extend the TIFF. However, stable BigTIFF support (needed for images >4 GB) has only recently been implemented in the open-source libtiff library, and is not available everywhere. After having successfully converted over 12 000 SVS images, we subsequently uncovered a small collection of TCGA SVS files (~10% or ~1200 files) that were compressed using the JPEG2000 codec instead of JPEG, rendering the libtiff tools useless. To circumvent this issue, we have recently integrated the OpenSlide library,28 which can handle the JPEG2000 codec.
Viewing software
Our application, the CDSA, is a custom user interface written with Adobe Flex. This interface facilitates the addition of features that are important for our work, but largely serves as a backbone to provide site navigation. The software providing actual browsing and serving of image content is built on two open-source projects: OpenZoom and IIPImage server.29
Image annotation and markup
A substantial challenge in image analysis involves the image annotation and markup by both machine-based algorithms and human experts. Our portal currently provides direct integration of human-generated annotations using the Aperio ImageScope client (see figure 5B) and also directly via a web browser where users can annotate with a mouse or trackpad.
Arguably one of the most valuable features of our framework is the ability to go directly from an annotation or markup to the image or region itself. We provide ‘deep linking’ support, which allows a user to either go directly to the slide of interest or to a specific point of interest given only a URL (eg, the viewer will pan and zoom directly to a given location in the WSI). In this way, an interesting feature or observation produced by an individual or machine can be sent to a collaborator as a URL, enabling more immediate feedback.
Image annotation and markup: remaining challenges
Standards are slowly emerging for the storage of WSI files via the DICOM working groups, as well as for image markup and annotations (including Annotation and Image Markup (AIM), Pathology Analytical Imaging Standards (PAIS), and the OME-TIFF format, among others). We have reference implementations that integrate with our PAIS,30–32 although it is important to note that other standards exist to store annotations including one developed by the Open Microscopy Environment Consortium (OME-TIFF). Unlocking the true value and latent content embedded in these images, however, requires the ability to semantically describe imaging features in understandable and reproducible terminologies. Within the CDSA are images from over 20 distinct tumor types, each of which generally has its own characteristic vocabulary to describe features. For example, oligodendrocytes, which can be seen in the neoplastic cells of oligodendrogliomas, often have a perinuclear halo characterized by clear cytoplasm and well-defined cell borders. While this concept would be readily apparent to a domain expert who is providing markups, a direct linkage to an ontology that would allow other users to determine this describes cell with these features as a specific type of glioma would make such annotations significantly more powerful. As a large number of ontologies are available,18 and image annotations can take place at multiple scales, development of an efficient mechanism to cleanly link the annotation and ontologies together remains a practical challenge. Outside of the feature of interest itself, storing and communicating information on the relative quality of the annotation, as well as the type and quality of the image, need to be considered. For example, a detailed provenance model would record information on not only the annotator (eg, whether it was done by a domain expert, a student, etc), but also on the raw image itself (any steps between the initial image generation and conversion into a web-viewable image, compression between the web server and the client's machine, etc). This becomes further complicated with automated feature extraction via an algorithm, where multiple processing steps (with multiple parameters) and algorithms are involved, which can subsequently produce thousands if not millions of distinct observations. For example, the results of nuclear segmentation of the TCGA dataset produced over 190 million discrete segmented objects; thus practical considerations on what this additional information should be and how to use it can be challenging.
Future work
A complete Javascript implementation of our user interface is actively under development with the recent migration of the OpenZoom Flash codebase (which is no longer supported) to Javascript. We are also actively investigating other mechanisms for searching and analyzing the image set. The main entry point to the CDSA is primarily by looking for a specific slide or patient on the basis of previous analysis. Since a wide variety of metadata are being exposed, we have prototyped several other ways to interact with this dataset. For example, the ‘CDSA Thumbnail Browser’ (figure 6) allows free text search on several fields including diagnostic group and patient ID, allowing a quick view of the number of slides available for a given patient. Depending on the search tag used, this could allow all image sections available for a given patient to be found. Perhaps even more compelling, this interface can easily be joined against any number of clinical and/or genetic characteristics. In figure 6 we have added three additional columns: EGFR and PDGFRA mutation status for the patient and age at time of diagnosis. This interface will be expanded to allow a user to filter on the basis of mutation status of genes of interest for a particular tumor type. Extending this interface to allow joining against an arbitrary set of data elements is currently being evaluated. In our current reference implementation, once an investigator finds images with a specific set of characteristics, clicking on the relevant link allows either direct download of the WSI file, or the investigator to be ‘deep linked’ directly into the full CDSA browser in a separate window. This also allows a researcher to provide colleagues with a simple URL and be able to directly link to a slide of interest, enabling a user to completely bypass the search interface.
These deep links also allow relatively straightforward integration of pathology imaging data with other data providers, such as reports and views generated on the genomics data. This could have very practical applications for tissue quality control (QC), where links to problematic or uncertain regions could be embedded into a QC report. Similarly, since radiology data are directly integrated into our interface, radiology images could be evaluated along with simultaneous visualization of clinical, genetic and pathology data.
Conclusion
While WSIs themselves provide a wealth of information, a tremendous amount of added value lies in integrating high-resolution pathology with associated clinical and genomic metadata. We are currently working on integrating a controlled vocabulary and/or ontology system with our markup framework within the GBM domain, with the long-term goal of expanding this work to other domains. Multiple layers of annotations provide descriptive metadata highlighting interesting content within the images. This would allow an investigator to search across a large population of images and find relevant images; for example, if both angiogenic regions and necrotic regions were annotated on a collection of images, the investigator could select cases with both features present, neither feature present, or either feature present, and subsequently feed this information into other processing pipelines (eg, genetic comparisons).
As the CDSA matures further, we envision this tool becoming an incredibly useful teaching and research resource as more and more annotations become available.
Footnotes
Collaborators: Jun Kong.
Contributors: The authors listed are justifiably credited with authorship. In detail: DAG: conception, design, analysis, programming backend and frontend, and interpretation of data, drafting of manuscript. FW: design of imaging database, manuscript editing. TK: design of imaging database, manuscript editing. DJB: conception, human factors design, manuscript editing. JC: human factors design, manuscript editing, backend development. DS: conception, design, programming backend and frontend. YP: testing, human factors design, manuscript draft and editing. JHS: conception, design, manuscript editing. LADC: conception, design, software pipelines, drafting of manuscript.
Funding: This work was supported in part by PHS Grant UL 1RR025008 from the Clinical and Translational Science Award Program, National Institutes of Health, Grant numbers R01LM009239 and R01LM011119 from the National Library of Medicine, Contract No HHSN261200800001E from the national Cancer Institute, National Institutes of Health, and the Georgia Research Alliance.
Competing interests: None.
Provenance and peer review: Not commissioned; externally peer reviewed.
References
Articles from Journal of the American Medical Informatics Association : JAMIA are provided here courtesy of Oxford University Press
Full text links
Read article at publisher's site: https://doi.org/10.1136/amiajnl-2012-001469
Read article for free, from open access legal sources, via Unpaywall:
https://academic.oup.com/jamia/article-pdf/20/6/1091/17374642/20-6-1091.pdf
Citations & impact
Impact metrics
Citations of article over time
Article citations
Applications of artificial intelligence in digital pathology for gastric cancer.
Front Oncol, 14:1437252, 28 Oct 2024
Cited by: 0 articles | PMID: 39529836
Review
Identification and validation of a prognostic model based on three TLS-Related genes in oral squamous cell carcinoma.
Cancer Cell Int, 24(1):350, 26 Oct 2024
Cited by: 0 articles | PMID: 39462422 | PMCID: PMC11515094
Cancer pharmacoinformatics: Databases and analytical tools.
Funct Integr Genomics, 24(5):166, 19 Sep 2024
Cited by: 0 articles | PMID: 39294509
Review
Deep feature batch correction using ComBat for machine learning applications in computational pathology.
J Pathol Inform, 15:100396, 12 Sep 2024
Cited by: 0 articles | PMID: 39398947 | PMCID: PMC11470259
AI powered quantification of nuclear morphology in cancers enables prediction of genome instability and prognosis.
NPJ Precis Oncol, 8(1):134, 19 Jun 2024
Cited by: 0 articles | PMID: 38898127 | PMCID: PMC11187064
Go to all (73) article citations
Similar Articles
To arrive at the top five similar articles we use a word-weighted algorithm to compare words from the Title and Abstract of each citation.
A data model and database for high-resolution pathology analytical image informatics.
J Pathol Inform, 2:32, 26 Jul 2011
Cited by: 23 articles | PMID: 21845230 | PMCID: PMC3153692
The Digital Slide Archive: A Software Platform for Management, Integration, and Analysis of Histology for Cancer Research.
Cancer Res, 77(21):e75-e78, 01 Nov 2017
Cited by: 80 articles | PMID: 29092945 | PMCID: PMC5898232
PanCancer insights from The Cancer Genome Atlas: the pathologist's perspective.
J Pathol, 244(5):512-524, 22 Feb 2018
Cited by: 86 articles | PMID: 29288495 | PMCID: PMC6240356
Review Free full text in Europe PMC
An Image Analysis Resource for Cancer Research: PIIP-Pathology Image Informatics Platform for Visualization, Analysis, and Management.
Cancer Res, 77(21):e83-e86, 01 Nov 2017
Cited by: 27 articles | PMID: 29092947 | PMCID: PMC5679396
Funding
Funders who supported this work.
NCATS NIH HHS (1)
Grant ID: UL1 TR000454
NCI NIH HHS (3)
Grant ID: HHSN261200800001E
Grant ID: HHSN261200800001C
Grant ID: U24 CA194362
NCRR NIH HHS (1)
Grant ID: UL1RR025008
NLM NIH HHS (5)
Grant ID: R01 LM009239
Grant ID: K22 LM011576
Grant ID: R01 LM011119
Grant ID: R01LM011119
Grant ID: R01LM009239
