Hello guys,
After the monthly close BTC have managed to move a little bit... thank god.
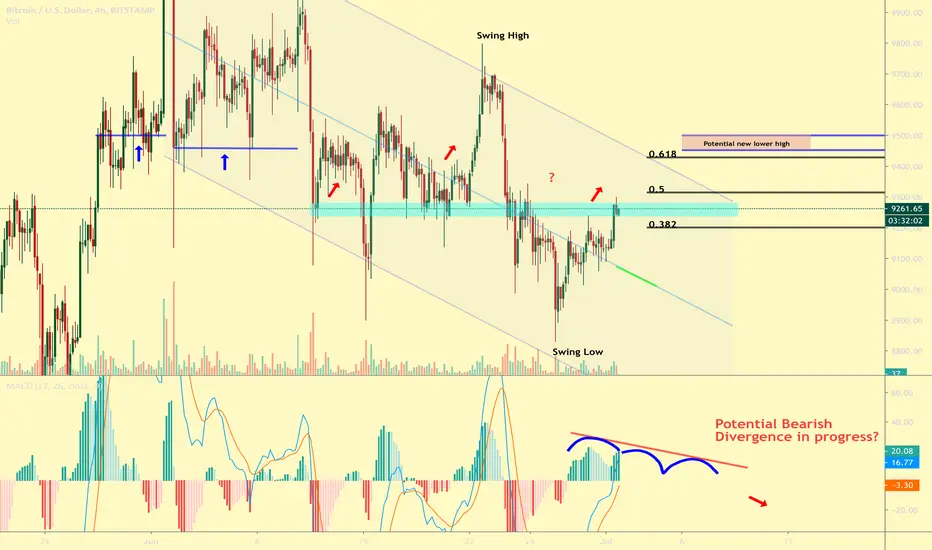
As can be seen on the chart we moved right in the previous accumulation area which acted as support for about 10 days. (12-22th)
After the previous lower high formed we retraced right trough the area and it became resistance ever since.
The Bulls need to close a higher timeframe candle above this area (marked with the blue box), for us to move to the next area of resistance.
With a conservative view the next area of resistance would be the 0.5 retrace right around 9315 but I don't think the resistance would be strong enough to
bring the rally as off so far down.
Personally I think the area 9425 is rather more interesting to pay close attention to as it is the .618 retrace combined with the downward upper channel line which acts as a demand zone.
I would watch this area and take profit aswell and based upon price action might even short the area.
Thereby we have the areas marked with the blue arrow pointing out previous "Points of control" based on the volume profile.
These guys can be a target for the whales to liquidate the first over-leveraged shorts and trap longs who falsely assumed the breakout, so be careful and watch price action first.
Overall view:
-Short term : some more upside
-Mid term: consolidation , with a lower high finally formed
-Long term: downside below 9000
After the monthly close BTC have managed to move a little bit... thank god.
As can be seen on the chart we moved right in the previous accumulation area which acted as support for about 10 days. (12-22th)
After the previous lower high formed we retraced right trough the area and it became resistance ever since.
The Bulls need to close a higher timeframe candle above this area (marked with the blue box), for us to move to the next area of resistance.
With a conservative view the next area of resistance would be the 0.5 retrace right around 9315 but I don't think the resistance would be strong enough to
bring the rally as off so far down.
Personally I think the area 9425 is rather more interesting to pay close attention to as it is the .618 retrace combined with the downward upper channel line which acts as a demand zone.
I would watch this area and take profit aswell and based upon price action might even short the area.
Thereby we have the areas marked with the blue arrow pointing out previous "Points of control" based on the volume profile.
These guys can be a target for the whales to liquidate the first over-leveraged shorts and trap longs who falsely assumed the breakout, so be careful and watch price action first.
Overall view:
-Short term : some more upside
-Mid term: consolidation , with a lower high finally formed
-Long term: downside below 9000
Comment
15MIN:buying coming in at the bottom site of the blue box,
good sign to see buy pressure here
Comment
we are showing some weakness on the buy side by moving out of the blue box.low volume so most likely little fake out
Trade active
entered today at 9140Disclaimer
The information and publications are not meant to be, and do not constitute, financial, investment, trading, or other types of advice or recommendations supplied or endorsed by TradingView. Read more in the Terms of Use.