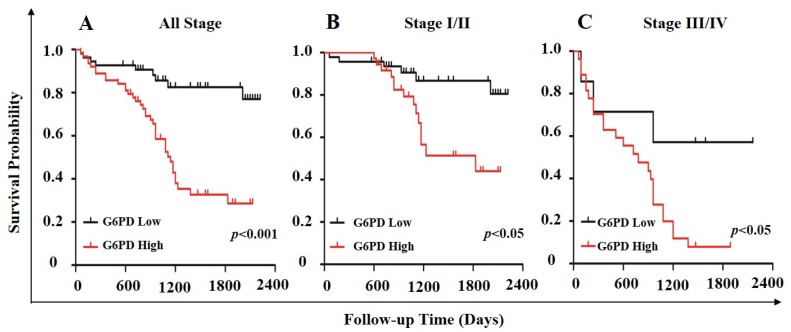
Figure 5.
Association of G6PD expression level with survival in ccRCC. Stratification of ccRCC into low and high G6PD expression groups was based on an optimal threshold determined by immunohistologic analysis. Kaplan-Meier overall survival curves for all 117 patients (A; p<0.001), 83 patients with stage I/II ccRCC (B; p<0.05), and 34 patients with stage III/IV ccRCC (C; p<0.05) were shown. Significance measures were based on log-rank test of the p value (vs. G6PD low group).

