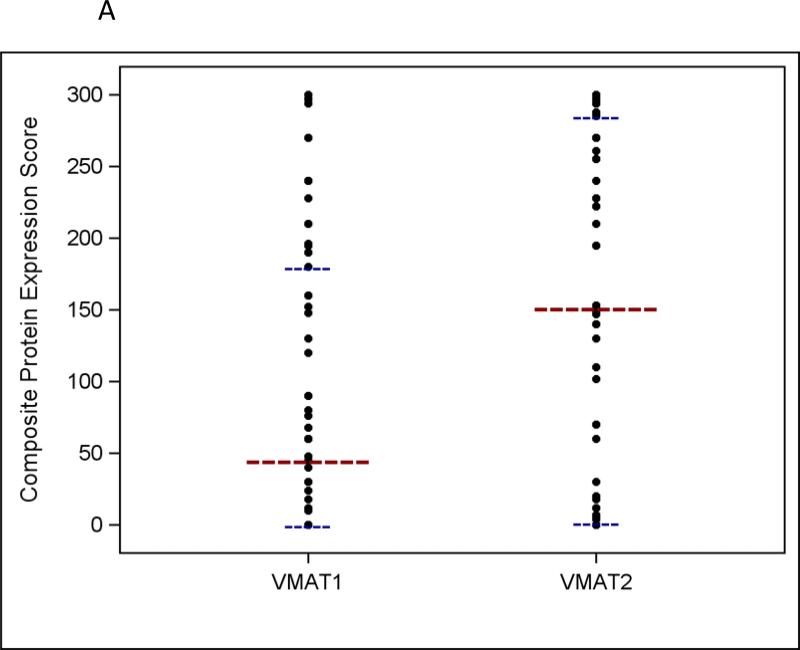
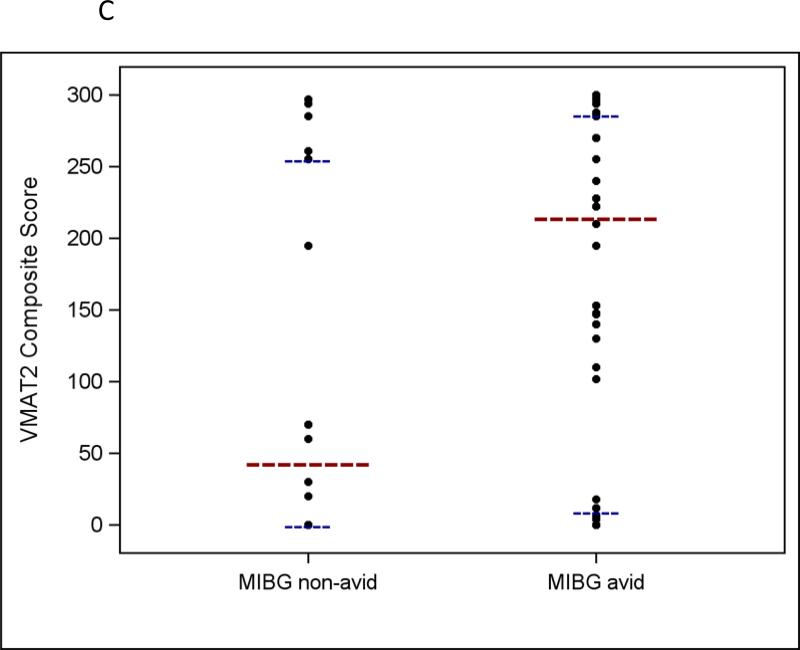
Fig 2.
a Distribution of VMAT1 and VMAT2 composite protein expression scores in human neuroblastoma tumor samples (n = 74 for VMAT1 and n = 76 for VMAT2). b VMAT1 composite protein expression scores according to MIBG avidity in patients with neuroblastoma (p = 0.76). c VMAT2 composite protein expression scores according to MIBG avidity in patients with neuroblastoma (p = 0.04). For all panels, the longer horizontal dashed lines indicate group medians and the shorter horizontal dashed lines indicate 25th and 75th percentiles.


