
Information graphics
Discover Pinterest’s best ideas and inspiration for Information graphics. Get inspired and try out new things.
3k people searched this
·
Last updated 1mo

Behance is the world's largest creative network for showcasing and discovering creative work

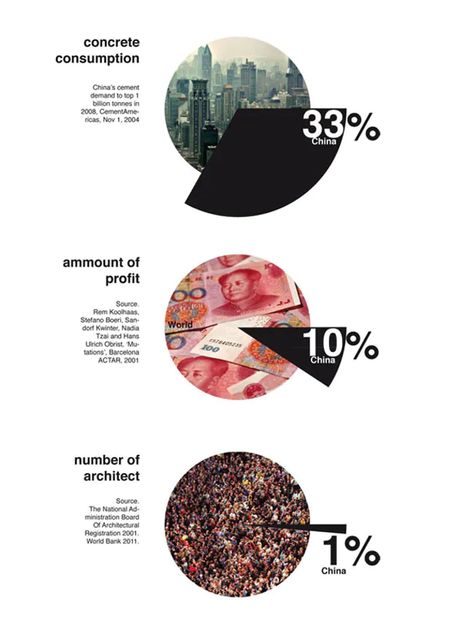
How do we distinguish between what is ahead and what is behind?Layman: “Err, we shade?”Architects: “Buddy, use different line weights.”....

Download this free vector of Productivity improvement boosting isometric infographics with tips for time management concentration on goals coffee and estimates vector illustration and explore millions of professional vectors on Freepik.

Branding, Art Direction, Exhibition Design, Adobe Illustrator

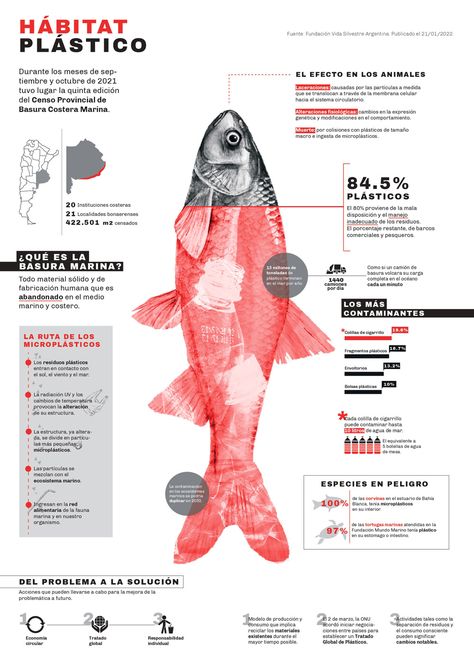
Esquemática/InfografiaTipografía 2, Cátedra Longinotti, FADU-UBA
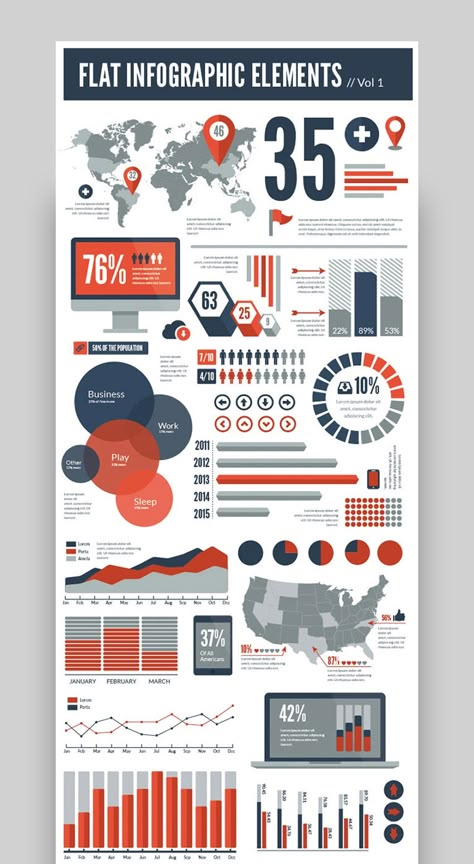
Do you need to tell a compelling story with data? A well-designed infographic is a great way to visualize a concept. Here are the best infographic templates.
Archinect image gallery.

Graphic Design, Infographic, Editorial Design, Adobe Illustrator, Adobe InDesign


Discover how to make an infographic that captivates and informs your audience. Learn step-by-step strategies to make an infographic stand out.


Are you protecting the files on your computer? According to research by Seagate and Harris Interactive, 54% of U.S. adults know someone who has lost files due to computer failures.

Infographic designed for The City of Milwaukee's Environmental Collaboration Office. This infographic is meant to show the statistics and accomplishments of ECO's programs and initiatives.
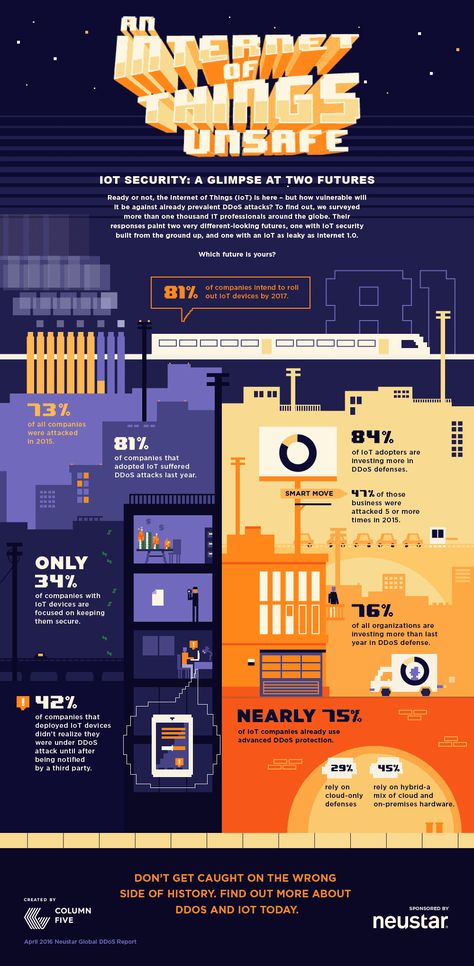
How prepared are businesses to fend off a cyberattack? Here's what technology executives say.


Leisure Engagement after Stroke After a stroke, it's important to stay active and engaged in leisure activities. Find helpful infographics and resources to support your recovery at

The project deals with information graphics and social related interests of the Danish people. I have used the context of specific opinion polls within each interest to shape and design diagrams to understand more layers of information about the data.


