Block diagram: Difference between revisions
Jump to navigation
Jump to search
Content deleted Content added
+gallery_page |
Reverted 2 edits by LotobomyMaster2 (talk) (TwinkleGlobal) Tag: Undo |
||
| (4 intermediate revisions by 3 users not shown) | |||
| Line 5: | Line 5: | ||
=== From left to right === |
=== From left to right === |
||
<gallery> |
<gallery> |
||
File:Work ratio.jpg |
|||
| ⚫ | |||
| ⚫ | |||
</gallery> |
</gallery> |
||
=== From top to bottom === |
=== From top to bottom === |
||
<gallery> |
<gallery> |
||
File:Finite State Machine Logic.svg |
|||
File:Data Planning Model.png |
|||
Image:Data_Planning_Model.png |
|||
File:BzLifecycle.png |
|||
</gallery> |
</gallery> |
||
=== Circular === |
=== Circular === |
||
<gallery> |
<gallery> |
||
File:Modeling and Simulation Advantages.jpg |
|||
File:Empirische cyclus globaal.svg |
|||
</gallery> |
</gallery> |
||
=== Special orientation === |
=== Special orientation === |
||
<gallery> |
<gallery> |
||
File:Modelo Porter.png|Cross orientation |
|||
File:Wasserfallmodell.svg|Waterfall |
|||
</gallery> |
</gallery> |
||
| Line 31: | Line 30: | ||
=== Number of blocks === |
=== Number of blocks === |
||
<gallery> |
<gallery> |
||
File:Dreipunk.svg|One block: a [[process diagram]] |
|||
File:Block diagram for feedback.PNG|Two blocks |
|||
File:XDSI-BRI.jpg|Three blocks |
|||
File:Smith Predictor.png|Four blocks |
|||
File:Blockdiagrammzustandsraum.PNG|Five blocks |
|||
File:TV-block-diagram.svg|More blocks |
|||
</gallery> |
</gallery> |
||
=== No blocks === |
=== No blocks === |
||
<gallery> |
<gallery> |
||
File:Signalfluss verzweigung.png|Lines and code |
|||
File:Cellular respiration flowchart (en).svg|Words as blocks |
|||
</gallery> |
</gallery> |
||
P.S. It is questionable if these diagrams can be considered block diagrams |
P.S. It is questionable if these diagrams can be considered block diagrams |
||
| Line 48: | Line 47: | ||
=== Illustrated blocks === |
=== Illustrated blocks === |
||
<gallery> |
<gallery> |
||
File:Cups simple.svg |
|||
File:Perlwikipedia.png |
|||
</gallery> |
</gallery> |
||
| Line 55: | Line 54: | ||
=== Illustrated block diagrams === |
=== Illustrated block diagrams === |
||
<gallery> |
<gallery> |
||
File:Podcast-Schema.svg |
|||
File:Empirische cyclus globaal.svg |
|||
File:Ludwig Feuerbachs Projektionstheorie.png |
|||
| ⚫ | |||
| ⚫ | |||
</gallery> |
</gallery> |
||
| Line 71: | Line 69: | ||
[[Category:Block diagrams| ]] |
[[Category:Block diagrams| ]] |
||
[[Category:Gallery pages of diagrams]] |
[[Category:Gallery pages of diagrams]] |
||
[[Category:Galleries initiated by User:Mdd]] |
|||
[[de:Blockschaltbild]] |
[[de:Blockschaltbild]] |
||
Latest revision as of 13:45, 5 February 2024

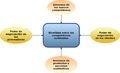
A block diagram is a diagram, in which the principal parts or functions are represented by blocks connected by lines, that show the relationships of the blocks.
Orientation
[edit]From left to right
[edit]
From top to bottom
[edit]


Circular
[edit]

Special orientation
[edit]-
 Cross orientation
 -
 Waterfall


Building blocks
[edit]Number of blocks
[edit]-
 One block: a process diagram
 -
 Two blocks
 -
 Three blocks
 -
 Four blocks
 -
 Five blocks
 -
 More blocks


No blocks
[edit]-
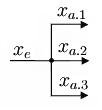 Lines and code
 -
 Words as blocks

.svg)
P.S. It is questionable if these diagrams can be considered block diagrams


