Two-particle transverse momentum correlations in pp and p-Pb collisions at LHC energies
- Acharya, Shreyasi et al
- arXiv:2211.08979CERN-EP-2022-230
 | Two-particle transverse momentum correlations $G_{2}^{\rm CD}$ (top) and $G_{2}^{\rm CI}$ (bottom) for the largest (left), medium (centre) and lowest (right) charged particle multiplicity classes in pp collisions at $\sqrt{s}=7\;\text{TeV}$. The correlator values are not shown in the intervals $|\Delta\eta|<0.1$ and $|\Delta\varphi|<0.09$, which are affected by track merging effects (see text for details). |
 | Two-particle transverse momentum correlations $G_{2}^{\rm CD}$ (top) and $G_{2}^{\rm CI}$ (bottom) for the largest (left), medium (centre) and lowest (right) charged particle multiplicity classes in pp collisions at $\sqrt{s}=7\;\text{TeV}$. The correlator values are not shown in the intervals $|\Delta\eta|<0.1$ and $|\Delta\varphi|<0.09$, which are affected by track merging effects (see text for details). |
 | Two-particle transverse momentum correlations $G_{2}^{\rm CD}$ (top) and $G_{2}^{\rm CI}$ (bottom) for the largest (left), medium (centre) and lowest (right) charged particle multiplicity classes in pp collisions at $\sqrt{s}=7\;\text{TeV}$. The correlator values are not shown in the intervals $|\Delta\eta|<0.1$ and $|\Delta\varphi|<0.09$, which are affected by track merging effects (see text for details). |
 | Two-particle transverse momentum correlations $G_{2}^{\rm CD}$ (top) and $G_{2}^{\rm CI}$ (bottom) for the largest (left), medium (centre) and lowest (right) charged particle multiplicity classes in pp collisions at $\sqrt{s}=7\;\text{TeV}$. The correlator values are not shown in the intervals $|\Delta\eta|<0.1$ and $|\Delta\varphi|<0.09$, which are affected by track merging effects (see text for details). |
 | Two-particle transverse momentum correlations $G_{2}^{\rm CD}$ (top) and $G_{2}^{\rm CI}$ (bottom) for the largest (left), medium (centre) and lowest (right) charged particle multiplicity classes in pp collisions at $\sqrt{s}=7\;\text{TeV}$. The correlator values are not shown in the intervals $|\Delta\eta|<0.1$ and $|\Delta\varphi|<0.09$, which are affected by track merging effects (see text for details). |
 | Two-particle transverse momentum correlations $G_{2}^{\rm CD}$ (top) and $G_{2}^{\rm CI}$ (bottom) for the largest (left), medium (centre) and lowest (right) charged particle multiplicity classes in pp collisions at $\sqrt{s}=7\;\text{TeV}$. The correlator values are not shown in the intervals $|\Delta\eta|<0.1$ and $|\Delta\varphi|<0.09$, which are affected by track merging effects (see text for details). |
 | Two-particle transverse momentum correlations $G_{2}^{\rm CD}$ (top) and $G_{2}^{\rm CI}$ (bottom) for the largest (left), medium (centre), and lowest (right) charged particle multiplicity classes in p--Pb collisions at $\sqrt{s_{\rm NN}}=5.02\;\text{TeV}$. The correlator values are not shown in the intervals $|\Delta\eta|<0.1$ and $|\Delta\varphi|<0.09$, which are affected by track merging effects (see text for details). |
 | Two-particle transverse momentum correlations $G_{2}^{\rm CD}$ (top) and $G_{2}^{\rm CI}$ (bottom) for the largest (left), medium (centre), and lowest (right) charged particle multiplicity classes in p--Pb collisions at $\sqrt{s_{\rm NN}}=5.02\;\text{TeV}$. The correlator values are not shown in the intervals $|\Delta\eta|<0.1$ and $|\Delta\varphi|<0.09$, which are affected by track merging effects (see text for details). |
 | Two-particle transverse momentum correlations $G_{2}^{\rm CD}$ (top) and $G_{2}^{\rm CI}$ (bottom) for the largest (left), medium (centre), and lowest (right) charged particle multiplicity classes in p--Pb collisions at $\sqrt{s_{\rm NN}}=5.02\;\text{TeV}$. The correlator values are not shown in the intervals $|\Delta\eta|<0.1$ and $|\Delta\varphi|<0.09$, which are affected by track merging effects (see text for details). |
 | Two-particle transverse momentum correlations $G_{2}^{\rm CD}$ (top) and $G_{2}^{\rm CI}$ (bottom) for the largest (left), medium (centre), and lowest (right) charged particle multiplicity classes in p--Pb collisions at $\sqrt{s_{\rm NN}}=5.02\;\text{TeV}$. The correlator values are not shown in the intervals $|\Delta\eta|<0.1$ and $|\Delta\varphi|<0.09$, which are affected by track merging effects (see text for details). |
 | Two-particle transverse momentum correlations $G_{2}^{\rm CD}$ (top) and $G_{2}^{\rm CI}$ (bottom) for the largest (left), medium (centre), and lowest (right) charged particle multiplicity classes in p--Pb collisions at $\sqrt{s_{\rm NN}}=5.02\;\text{TeV}$. The correlator values are not shown in the intervals $|\Delta\eta|<0.1$ and $|\Delta\varphi|<0.09$, which are affected by track merging effects (see text for details). |
 | Two-particle transverse momentum correlations $G_{2}^{\rm CD}$ (top) and $G_{2}^{\rm CI}$ (bottom) for the largest (left), medium (centre), and lowest (right) charged particle multiplicity classes in p--Pb collisions at $\sqrt{s_{\rm NN}}=5.02\;\text{TeV}$. The correlator values are not shown in the intervals $|\Delta\eta|<0.1$ and $|\Delta\varphi|<0.09$, which are affected by track merging effects (see text for details). |
 | Longitudinal (left) and azimuthal (right) projections of the two-particle transverse momentum correlations $G_{2}^{\rm CD}$ (top) and $G_{2}^{\rm CI}$ (bottom) for selected charged particle multiplicity classes in pp collisions at $\sqrt{s}=7\;\text{TeV}$. The correlator values are not shown in the intervals $|\Delta\eta|<0.1$ and $|\Delta\varphi|<0.09$, which are affected by track merging effects (see text for details). Vertical bars (mostly smaller than the marker size) and shaded bands represent statistical and uncorrelated systematic uncertainties, respectively. Correlated systematic uncertainties are represented as small boxes at the sides of the panels. |
 | Longitudinal (left) and azimuthal (right) projections of the two-particle transverse momentum correlations $G_{2}^{\rm CD}$ (top) and $G_{2}^{\rm CI}$ (bottom) for selected charged particle multiplicity classes in pp collisions at $\sqrt{s}=7\;\text{TeV}$. The correlator values are not shown in the intervals $|\Delta\eta|<0.1$ and $|\Delta\varphi|<0.09$, which are affected by track merging effects (see text for details). Vertical bars (mostly smaller than the marker size) and shaded bands represent statistical and uncorrelated systematic uncertainties, respectively. Correlated systematic uncertainties are represented as small boxes at the sides of the panels. |
 | Longitudinal (left) and azimuthal (right) projections of the two-particle transverse momentum correlations $G_{2}^{\rm CD}$ (top) and $G_{2}^{\rm CI}$ (bottom) for selected charged particle multiplicity classes in pp collisions at $\sqrt{s}=7\;\text{TeV}$. The correlator values are not shown in the intervals $|\Delta\eta|<0.1$ and $|\Delta\varphi|<0.09$, which are affected by track merging effects (see text for details). Vertical bars (mostly smaller than the marker size) and shaded bands represent statistical and uncorrelated systematic uncertainties, respectively. Correlated systematic uncertainties are represented as small boxes at the sides of the panels. |
 | Longitudinal (left) and azimuthal (right) projections of the two-particle transverse momentum correlations $G_{2}^{\rm CD}$ (top) and $G_{2}^{\rm CI}$ (bottom) for selected charged particle multiplicity classes in pp collisions at $\sqrt{s}=7\;\text{TeV}$. The correlator values are not shown in the intervals $|\Delta\eta|<0.1$ and $|\Delta\varphi|<0.09$, which are affected by track merging effects (see text for details). Vertical bars (mostly smaller than the marker size) and shaded bands represent statistical and uncorrelated systematic uncertainties, respectively. Correlated systematic uncertainties are represented as small boxes at the sides of the panels. |
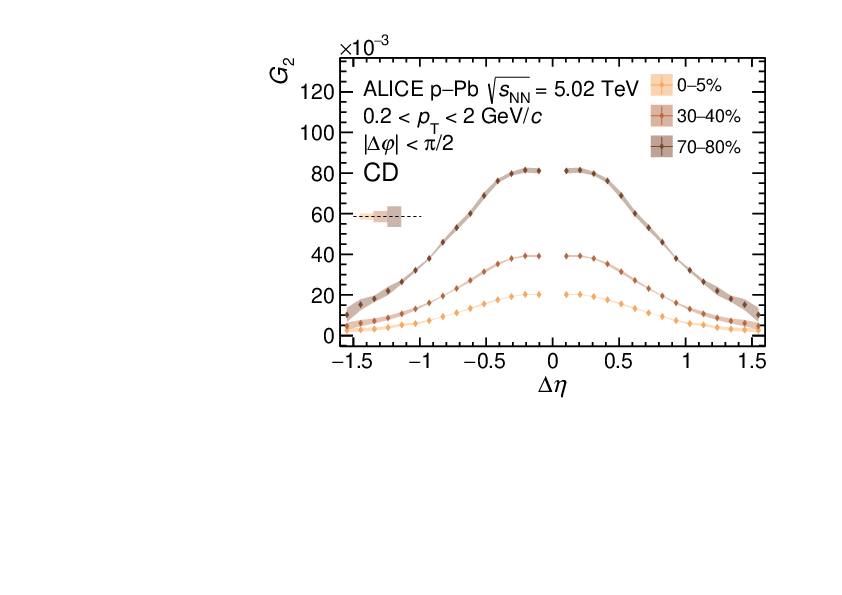 | Longitudinal (left) and azimuthal (right) projections of the two-particle transverse momentum correlations $G_{2}^{\rm CD}$ (top) and $G_{2}^{\rm CI}$ (bottom) for selected charged particle multiplicity classes in p--Pb collisions at $\sqrt{s_{\rm NN}}=5.02\;\text{TeV}$. The correlator values are not shown in the intervals $|\Delta\eta|<0.1$ and $|\Delta\varphi|<0.09$, which are affected by track merging effects (see text for details). Vertical bars (mostly smaller than the marker size) and shaded bands represent statistical and uncorrelated systematic uncertainties, respectively. Correlated systematic uncertainties are represented as small boxes at the sides of the panels. |
 | Longitudinal (left) and azimuthal (right) projections of the two-particle transverse momentum correlations $G_{2}^{\rm CD}$ (top) and $G_{2}^{\rm CI}$ (bottom) for selected charged particle multiplicity classes in p--Pb collisions at $\sqrt{s_{\rm NN}}=5.02\;\text{TeV}$. The correlator values are not shown in the intervals $|\Delta\eta|<0.1$ and $|\Delta\varphi|<0.09$, which are affected by track merging effects (see text for details). Vertical bars (mostly smaller than the marker size) and shaded bands represent statistical and uncorrelated systematic uncertainties, respectively. Correlated systematic uncertainties are represented as small boxes at the sides of the panels. |
 | Longitudinal (left) and azimuthal (right) projections of the two-particle transverse momentum correlations $G_{2}^{\rm CD}$ (top) and $G_{2}^{\rm CI}$ (bottom) for selected charged particle multiplicity classes in p--Pb collisions at $\sqrt{s_{\rm NN}}=5.02\;\text{TeV}$. The correlator values are not shown in the intervals $|\Delta\eta|<0.1$ and $|\Delta\varphi|<0.09$, which are affected by track merging effects (see text for details). Vertical bars (mostly smaller than the marker size) and shaded bands represent statistical and uncorrelated systematic uncertainties, respectively. Correlated systematic uncertainties are represented as small boxes at the sides of the panels. |
 | Longitudinal (left) and azimuthal (right) projections of the two-particle transverse momentum correlations $G_{2}^{\rm CD}$ (top) and $G_{2}^{\rm CI}$ (bottom) for selected charged particle multiplicity classes in p--Pb collisions at $\sqrt{s_{\rm NN}}=5.02\;\text{TeV}$. The correlator values are not shown in the intervals $|\Delta\eta|<0.1$ and $|\Delta\varphi|<0.09$, which are affected by track merging effects (see text for details). Vertical bars (mostly smaller than the marker size) and shaded bands represent statistical and uncorrelated systematic uncertainties, respectively. Correlated systematic uncertainties are represented as small boxes at the sides of the panels. |
 | Evolution with the average charged particle multiplicity of the longitudinal (left) and azimuthal (right) widths of the two-particle transverse momentum differential correlation $G_{2}^{\rm CD}$ (top row) and $G_{2}^{\rm CI}$ (bottom row) in pp, p--Pb, and Pb--Pb collisions at $\sqrt{s} = 7\;\text{TeV}$, $\sqrt{s_{\rm NN}} = 5.02\;\text{TeV}$, and $\sqrt{s_{\rm NN}} = 2.76\;\text{TeV}$, respectively. Vertical bars (mostly smaller than the marker size) and filled boxes represent statistical and systematic uncertainties, respectively. |
 | Longitudinal (left) and azimuthal (right) projections of the two-particle transverse momentum correlation $G_{2}^{\rm CI}$ for selected charged particle multiplicity classes in pp collisions at $\sqrt{s}=7\;\text{TeV}$ after subtracting the azimuthal ZYAM base level (see text for details) for each multiplicity class. Vertical bars (mostly smaller than the marker size) and shaded bands represent statistical and uncorrelated systematic uncertainties, respectively. |
 | Longitudinal (left) and azimuthal (right) projections of the two-particle transverse momentum correlation $G_{2}^{\rm CI}$ for selected charged particle multiplicity classes in pp collisions at $\sqrt{s}=7\;\text{TeV}$ after subtracting the azimuthal ZYAM base level (see text for details) for each multiplicity class. Vertical bars (mostly smaller than the marker size) and shaded bands represent statistical and uncorrelated systematic uncertainties, respectively. |
 | Longitudinal projections of slices of one azimuthal bin (left) and azimuthal projections of slices of one longitudinal bin (right), for selected bins of the two-particle transverse momentum correlation $G_{2}^{\rm CI}$ and its bidimensional fit using Eq.~(\ref{eq:fitfunc}) for the 0--5\% (top) and 70--80\% (bottom) charged particle multiplicity classes in pp collisions at $\sqrt{s}=7\;\text{TeV}$. Vertical bars (mostly smaller than the marker size) and shaded bands represent statistical and uncorrelated systematic uncertainties, respectively. |
 | Longitudinal projections of slices of one azimuthal bin (left) and azimuthal projections of slices of one longitudinal bin (right), for selected bins of the two-particle transverse momentum correlation $G_{2}^{\rm CI}$ and its bidimensional fit using Eq.~(\ref{eq:fitfunc}) for the 0--5\% (top) and 70--80\% (bottom) charged particle multiplicity classes in pp collisions at $\sqrt{s}=7\;\text{TeV}$. Vertical bars (mostly smaller than the marker size) and shaded bands represent statistical and uncorrelated systematic uncertainties, respectively. |
 | Longitudinal projections of slices of one azimuthal bin (left) and azimuthal projections of slices of one longitudinal bin (right), for selected bins of the two-particle transverse momentum correlation $G_{2}^{\rm CI}$ and its bidimensional fit using Eq.~(\ref{eq:fitfunc}) for the 0--5\% (top) and 70--80\% (bottom) charged particle multiplicity classes in pp collisions at $\sqrt{s}=7\;\text{TeV}$. Vertical bars (mostly smaller than the marker size) and shaded bands represent statistical and uncorrelated systematic uncertainties, respectively. |
 | Longitudinal projections of slices of one azimuthal bin (left) and azimuthal projections of slices of one longitudinal bin (right), for selected bins of the two-particle transverse momentum correlation $G_{2}^{\rm CI}$ and its bidimensional fit using Eq.~(\ref{eq:fitfunc}) for the 0--5\% (top) and 70--80\% (bottom) charged particle multiplicity classes in pp collisions at $\sqrt{s}=7\;\text{TeV}$. Vertical bars (mostly smaller than the marker size) and shaded bands represent statistical and uncorrelated systematic uncertainties, respectively. |
 | Evolution with the average charged particle multiplicity of the longitudinal (left) and azimuthal (right) widths of the two-particle transverse momentum correlations $G_{2}^{\rm CD}$ (top row) and $G_{2}^{\rm CI}$ (bottom row) in pp, p--Pb, and Pb--Pb collisions at $\sqrt{s} = 7\;\text{TeV}$, $\sqrt{s_{\rm NN}} = 5.02\;\text{TeV}$, and $\sqrt{s_{\rm NN}} = 2.76\;\text{TeV}$, respectively, compared to models. Statistical and systematic uncertainties of the data points are shown as vertical bars (mostly smaller than the marker size) and filled boxes, respectively, while the thickness of the shaded bands represents statistical uncertainties of the models. The data points and the results of HIJING simulations for Pb--Pb collisions are taken from Ref.~\cite{ALICE:2019smr}. |